
CITY AND COUNTY OF
SAN FRANCISCO, CALIFORNIA
Annual Comprehensive Financial Report
Year ended June 30, 2023
Prepared by:
Office of the Controller
Ben Rosenfield
Controller

CITY AND COUNTY OF SAN FRANCISCO
Annual Comprehensive Financial Report
Year Ended June 30, 2023
TABLE OF CONTENTS
Page
INTRODUCTORY SECTION
Controller’s Letter of Transmittal ......................................................................................................... i
Certificate of Achievement - Government Finance Officers Association ............................................ v
City and County of San Francisco Organization Chart ....................................................................... vi
List of Principal Officials ...................................................................................................................... vii
FINANCIAL SECTION
Independent Auditor’s Report ............................................................................................................. 1
Management’s Discussion and Analysis (Unaudited) ......................................................................... 4
Basic Financial Statements:
Government-wide Financial Statements:
Statement of Net Position ......................................................................................................... 26
Statement of Activities .............................................................................................................. 28
Fund Financial Statements:
Balance Sheet - Governmental Funds ..................................................................................... 29
Reconciliation of the Governmental Funds Balance Sheet to the Statement of Net Position .. 30
Statement of Revenues, Expenditures, and Changes in Fund Balances - Governmental
Funds ................................................................................................................................... 31
Reconciliation of the Statement of Revenues, Expenditures, and Changes in Fund
Balances of Governmental Funds to the Statement of Activities ........................................ 32
Statement of Net Position - Proprietary Funds ......................................................................... 33
Statement of Revenues, Expenses, and Changes in Fund Net Position - Proprietary
Funds ................................................................................................................................... 35
Statement of Cash Flows - Proprietary Funds.......................................................................... 36
Statement of Fiduciary Net Position - Fiduciary Funds ............................................................ 38
Statement of Changes in Fiduciary Net Position - Fiduciary Funds ......................................... 39
Notes to the Basic Financial Statements:
(1) The Financial Reporting Entity .............................................................................................. 40
(2) Summary of Significant Accounting Policies .......................................................................... 44
(3) Reconciliation of Government-wide and Fund Financial Statements .................................... 55
(4) Effects of New Accounting Pronouncements ......................................................................... 61
(5) Deposits and Investments ...................................................................................................... 63
(6) Property Taxes ....................................................................................................................... 86
(7) Capital Assets ........................................................................................................................ 87
(8) Bonds, Loans, Leases and Other Payables........................................................................... 91
(9) Employee Benefit Programs .................................................................................................. 118
(10) Fund Equity ............................................................................................................................ 143
(11) Unavailable Resources in Governmental Funds ................................................................... 146
(12) San Francisco County Transportation Authority .................................................................... 147
(13) Detailed Information for Enterprise Funds ............................................................................. 149
(14) Successor Agency to the Redevelopment Agency of the City and County of San
Francisco ................................................................................................................................ 168
(15) Treasure Island Development Authority ................................................................................. 172

CITY AND COUNTY OF SAN FRANCISCO
Annual Comprehensive Financial Report
Year Ended June 30, 2023
TABLE OF CONTENTS
(16) Interfund Receivables, Payables and Transfers .................................................................... 174
(17) Leases, Commitments and Contingent Liabilities .................................................................. 177
(18) Risk Management .................................................................................................................. 185
(19) Subsequent Events ................................................................................................................ 188
Required Supplementary Information (Unaudited):
Pension Plans:
Schedules of the City’s Proportionate Share of the Net Pension Liability/(Asset) ................... 191
Schedules of Changes in Net Pension Liability and Related Ratios ........................................ 195
Schedules of Changes in Total Pension Liability and Related Ratios ...................................... 197
Schedules of Employer Contributions - Pension Plans ............................................................ 198
Other Postemployment Healthcare Benefits Plans:
Schedules of Changes in Net Other Postemployment
Benefits Liability and Related Ratios ................................................................................... 207
Schedules of Employer Contributions - Other Postemployment Healthcare Benefits Plans ... 213
Budgetary Comparison Schedule - General Fund ......................................................................... 217
Combining Financial Statements and Schedules:
Nonmajor Governmental Funds ..................................................................................................... 223
Combining Balance Sheet - Nonmajor Governmental Funds .................................................. 226
Combining Statement of Revenues, Expenditures, and Changes in Fund Balances -
Nonmajor Governmental Funds .......................................................................................... 227
Combining Balance Sheet - Nonmajor Governmental Funds - Special Revenue Funds ......... 228
Combining Statement of Revenues, Expenditures, and Changes in Fund Balances -
Nonmajor Governmental Funds - Special Revenue Funds ................................................. 232
Combining Schedule of Revenues, Expenditures, and Changes in Fund Balances -
Budget and Actual - Budget Basis - Special Revenue Funds ............................................. 236
Schedule of Current Expenditures by Department - Budget and Actual - Budget Basis
- Special Revenue Funds .................................................................................................... 248
Combining Balance Sheet - Nonmajor Governmental Funds - Debt Service Funds ............... 255
Combining Statement of Revenues, Expenditures, and Changes in Fund Balances -
Nonmajor Governmental Funds - Debt Service Funds ....................................................... 256
Schedule of Revenues, Expenditures and Changes in Fund Balance - Budget and
Actual - Budget Basis - Debt Service Fund ......................................................................... 257
Combining Balance Sheet - Nonmajor Governmental Funds - Capital Projects Funds ........... 258
Combining Statement of Revenues, Expenditures, and Changes in Fund Balances -
Nonmajor Governmental Funds - Capital Projects Funds ................................................... 259
Internal Service Funds ................................................................................................................... 260
Combining Statement of Net Position - Internal Service Funds ............................................... 261
Combining Statement of Revenues, Expenses and Changes in Fund Net Position -
Internal Service Funds......................................................................................................... 262
Combining Statement of Cash Flows - Internal Service Funds………………………………... . 263
Fiduciary Funds ............................................................................................................................. 264
Combining Statement of Fiduciary Net Position - Fiduciary Funds - Pension and
Other Employee Benefit Trust Funds .................................................................................. 265
Combining Statement of Changes in Fiduciary Net Position - Fiduciary Funds - Pension
and Other Employee Benefit Trust Funds ........................................................................... 266

CITY AND COUNTY OF SAN FRANCISCO
Annual Comprehensive Financial Report
Year Ended June 30, 2023
TABLE OF CONTENTS
Combining Statement of Fiduciary Net Position - Fiduciary Funds - Custodial Funds ............ 267
Combining Statement of Changes in Fiduciary Net Position - Fiduciary Funds - Custodial
Funds ................................................................................................................................... 270
Other Information:
Schedule of Fund Balance – General Fund ............................................................................. 273
General Fund Schedule of Revenues, Expenditures, and Changes
In Fund Balance ................................................................................................................... 274
STATISTICAL SECTION
Net Position by Component – Last Ten Fiscal Years ......................................................................... 276
Changes in Net Position – Last Ten Fiscal Years .............................................................................. 277
Fund Balances of Governmental Funds – Last Ten Fiscal Years ...................................................... 279
Changes in Fund Balances of Governmental Funds – Last Ten Fiscal Years ................................... 280
Assessed Value of Taxable Property – Last Ten Fiscal Years ........................................................... 282
Direct and Overlapping Property Tax Rates – Last Ten Fiscal Years ................................................ 283
Principal Property Assessees – Current Fiscal Year and Nine Fiscal Years Ago .............................. 284
Property Tax Levies and Collections – Last Ten Fiscal Years ........................................................... 285
Ratios of Outstanding Debt by Type – Last Ten Fiscal Years ............................................................ 286
Ratios of General Bonded Debt Outstanding – Last Ten Fiscal Years .............................................. 287
Legal Debt Margin Information – Last Ten Fiscal Years ..................................................................... 288
Direct and Overlapping Debt ............................................................................................................... 289
Pledged-Revenue Coverage – Last Ten Fiscal Years ........................................................................ 290
Demographic and Economic Statistics – Last Ten Fiscal Years ........................................................ 292
Principal Employers – Current Year and Nine Years Ago .................................................................. 293
Full-Time Equivalent City Government Employees by Function – Last Ten Fiscal Years.................. 294
Operating Indicators by Function – Last Ten Fiscal Years ................................................................. 295
Capital Asset Statistics by Function – Last Ten Fiscal Years ............................................................. 296

INTRODUCTORY SECTION
▪
Controller’s Letter of Transmittal
▪
Certificate of Achievement - Government Finance
Officers Association
▪
City and County of San Francisco Organization Chart
▪
List of Principal Officials

OFFICE OF THE CONTROLLER
CITY AND COUNTY OF SAN FRANCISCO
Ben Rosenfield
Controller
Todd Rydstrom
Deputy Controller
i
December 29, 2023
The Honorable Mayor London N. Breed
The Honorable Members of the Board of Supervisors
Residents of the City and County of San Francisco
San Francisco, California
I am pleased to present the Annual Comprehensive Financial Report (ACFR) of the City and County of San
Francisco, California (the City) for the year (FY) ended June 30, 2023, with the independent auditor’s report.
The report is submitted in compliance with City Charter sections 2.115 and 3.105, and California
Government Code Sections 25250 and 25253. The Office of the Controller prepared the ACFR in
conformance with the principles and standards for accounting and financial reporting set forth by the
Governmental Accounting Standards Board (GASB).
The City is responsible for the accuracy of the data and for the completeness and fairness of its
presentation. The existing comprehensive structure of internal accounting controls in the City provides
reasonable assurance that the financial statements are free of any material misstatements. Because the
cost of internal control should not exceed the anticipated benefits, the objective is to provide reasonable,
rather than absolute assurance that the financial statements are free of material misstatements. I believe
that the reported data is accurate in all material respects and that its presentation fairly depicts the City’s
financial position and changes in its financial position as measured by the financial activity of its various
funds. I am confident that the included disclosures provide the reader with an understanding of the City’s
financial affairs.
The City’s Charter requires an annual audit of the Controller’s records. The records have been audited by
Macias Gini & O’Connell LLP and are presented in the basic financial statements in this ACFR. The ACFR
also incorporates financial statements of various City enterprise funds and component units that issue
separate financial statements, including the San Francisco International Airport, the San Francisco Water
Enterprise, Hetch Hetchy Water and Power, the Municipal Transportation Agency, the San Francisco
Wastewater Enterprise, the Port of San Francisco, the City and County of San Francisco Finance
Corporation, the San Francisco County Transportation Authority, the City and County of San Francisco
Health Service System, the San Francisco City and County Employees’ Retirement System, the City and
County of San Francisco Retiree Health Care Trust, and the Successor Agency to the San Francisco
Redevelopment Agency.
This letter of transmittal is designed to complement the Management’s Discussion and Analysis (MD&A)
section of the ACFR. The MD&A provides a narrative overview and analysis of the basic financial
statements and is presented after the independent auditor’s report.
SAN FRANCISCO GOVERNMENT:
Profile of San Francisco Government
The City and County of San Francisco was established in 1850 and is the only legal subdivision of the State
of California with the governmental powers of both a city and a county. The City’s legislative power is
exercised through a Board of Supervisors, while its executive power is vested upon a Mayor and other
appointed and elected officials. Key public services provided by the City include public safety and
protection, public transportation, water and sewer, parks and recreation, public health, social services and
land-use and planning regulation. The heads of most of these departments are appointed by the Mayor and
advised by commissions and boards appointed by City elected officials.

CITY AND COUNTY OF SAN FRANCISCO OFFICE OF THE CONTROLLER
ii
Elected officials include the Mayor, Members of the Board of Supervisors, Assessor-Recorder, City
Attorney, District Attorney, Public Defender, Sheriff, Superior Court Judges, and Treasurer. Since 2000, the
eleven-member Board of Supervisors has been elected through district elections. The eleven district
elections are staggered for five and six seats at a time and held in even-numbered years. Board members
serve four-year terms and vacancies are filled by Mayoral appointment.
Recent Economic and Financial Results
The COVID-19 pandemic, and the necessary public health response to it, ended the longest period of
economic expansion in U.S. history, beginning in the final quarter of FY 2019-20. Within the first month,
over 20 million jobs were lost across the country, national real gross domestic product declined by 31.2
percent on an annualized basis, and the San Francisco metro division lost nearly 170,000 jobs between
March and April 2020. Since then, the national, state, and local economies began to recover, first slowly in
FY 2020-21 and then more rapidly in FY 2021-22.
Local economic results for FY 2022-23 were more mixed, with continued recovery in important parts of San
Francisco’s economy with more mixed results in others. Domestic and international air travel at San
Francisco International Airport reached 80.6% and 85.3%, respectively, of pre-pandemic levels during the
fiscal year, but international travel increased steadily, almost reaching pre-pandemic levels by the end of
the fiscal year. Ridership on BART and Muni slowly rose during the fiscal year. Office attendance grew
slowly in the first half of FY 2022-23 but maintained steady in the second half of the fiscal year. Office
vacancies also continued to increase, reaching more than 30% in the 2
nd
quarter of 2023. Office asking
rents declined, now below $80 per square foot versus above $90 per square foot pre-pandemic. The
number of employed San Francisco residents recovered to approximately 560,000, but a level still lower
than pre-pandemic levels. The unemployment rate, after reaching lows of less than 2% at the end of FY
2021-22, increased to over 3% by the end of FY 2022-23, a higher rate but still lower than the rate in
California and the country.
The City’s financial results are similarly mixed in FY 2022-23. In the General Fund, gross receipts tax
revenue reflected continued softness in the office-using sectors declining from $813 million in FY 2021-22
to $803 million in FY 2022-23. After reaching a historic high of $520 million in FY 2021-22, real property
transfer tax collections dropped to the lowest level in more than a decade to $186 million, as few large office
buildings traded hands, and those that did traded at reduced prices. However, the City continued to make
gains in the hospitality industry, with General Fund hotel tax revenue growing from $158 million in FY 2021-
22 to $253 million in FY 2022-23. Sales tax, which reflects general increases in spending in the City, grew
modestly from $188 million in FY 2021-22 to $198 million in FY 2022-23. Overall General Fund revenue
growth was driven by the implementation of a new business tax, the overpaid executive tax – adopted by
voters in 2020 – which raised more than $200 million in FY 2022-23.
The City’s bottom-line financial results for the fiscal year continue to be strong, although lower than the prior
year, reflecting slowing economic trends and heavy use of prior year resources to balance the adopted FY
2022-23 budget. General Fund cash decreased by 3.5 percent to $3.71 billion and total GAAP fund balance
decreased 8.8 percent to $2.65 billion. Although these results are lower on a year-over-year basis, the City
ended the year stronger than forecasted and well above recent historical norms. Modest overall weakness
in tax revenues was more than offset by operating savings and revenues in departments. As a result, the
City deposited $9.4 million to the Budget Stabilization Reserve. Primary rainy day and budget stabilization
reserves, which do not include one-time reserves, totaled $389.7 million, or 6.3 percent of revenues.
Projected Economic and Financial Conditions in Subsequent Years
The City is heavily focused on supporting the City’s continued economic, financial, and operational health
and recovery while managing challenges driven by developing economic shifts in the City and throughout
the nation.
FY 2022-23 revenue results and initial FY 2023-24 data indicate the pace of the City’s pandemic rebound
has slowed after its initial rebound, and future growth is expected to be driven by economic fundamentals
such as interest rates and employment, as well as domestic and international political forces. The City’s

CITY AND COUNTY OF SAN FRANCISCO OFFICE OF THE CONTROLLER
iii
most recent budget forecast, issued in December 2023, assumes hotel tax revenues will grow substantially
but not return to 2019 levels until FY 2027-28. Office vacancy is expected to slowly decline beginning in
2025 but is not expected to reach pre-pandemic levels within the next ten years. Broader economic
challenges – including the persistence of remote office work, sustained high interest rates, and forecasted
cooling of the technology sector – are projected to translate into revenue weakness versus the budget for
FY 2023-24.
The FY 2023-24 and FY 2024-25 budget was balanced with a heavy reliance on one-time solutions, leaving
the City with an ongoing structural deficit. To begin addressing the anticipated current year and ongoing
shortfall, the Mayor’s Office issued General Fund mid-year target cuts of 3% to City departments in October
2023. Additional cut targets of 10%, plus a 5% contingency, were issued in December 2023 for the FY
2024-25 and FY 2025-26 budget years.
OTHER INFORMATION:
San Francisco’s Budgetary Process
The budget is adopted at the account, authority or project level of expenditure within each department, and
the department, fund, account, authority or project is the legal level of budgetary control. The notes to the
budgetary comparison schedule in the required supplementary information section summarize the
budgetary roles of City officials and the timetable for their various budgetary actions according to the City
Charter.
The City has historically adopted annual budgets for all governmental funds and typically adopts project-
length budgets for capital projects and certain debt service funds. The voters adopted amendments to the
Charter in 2009 designed to further strengthen the City’s long-range financial planning. As a result of these
changes, the City is required to adopt a “rolling” two-year budget each year unless the Board of Supervisors
authorizes a “fixed” two-year budget for a given fund, in which case authorization occurs every two years.
For the fiscal year period of 2022-23 and 2023-24, there were four departments on a two-year fixed budget,
while the majority of the City’s budget remains on a rolling cycle.
As further required by these amendments, the Board of Supervisors and Mayor adopt a five-year financial
plan every two years. The latest plan was issued in January 2023 and updated in March 2023. Additionally,
these Charter changes provided a mechanism for the Controller to propose, and the Board to adopt, various
binding financial policies, which can only be suspended by a supermajority of the Board. Financial policies
have now been adopted under these provisions governing the City’s budget reserve practices, the use of
non-recurring revenues, and limits on the use of debt paid from the General Fund.
Internal and Budgetary Controls
In developing and evaluating the City’s accounting system, consideration is given to the adequacy of
internal accounting controls. Internal accounting controls are designed to provide reasonable, but not
absolute, assurance regarding: (1) the safeguarding of assets against loss from unauthorized use or
disposition, and (2) the reliability of financial records for preparing financial statements and maintaining
accountability for assets. The concept of reasonable assurance recognizes that: (1) the cost of a control
should not exceed the benefits likely to be derived, and (2) the evaluation of costs and benefits requires
estimates and judgments by management. All internal control evaluations occur within the above
framework. We believe that the City’s internal accounting controls adequately safeguard assets and provide
reasonable assurance of proper recording of financial transactions.
The City maintains budgetary controls to ensure that legal provisions of the annual budget are in compliance
and expenditures do not exceed budgeted amounts. Controls are exercised by integrating the budgetary
accounts in fund ledgers for all budgeted funds. An encumbrance system is also used to account for
purchase orders and other contractual commitments. Encumbered balances of appropriations at year-end
are carried forward and are not reappropriated in the following year’s budget.

CITY AND COUNTY OF SAN FRANCISCO OFFICE OF THE CONTROLLER
iv
Independent Audit
The City’s Charter requires an annual audit of the Controller’s records. These records, represented in the
basic financial statements included in the ACFR have been audited by the nationally recognized certified
public accounting firm, Macias Gini & O’Connell LLP. The various enterprise funds, the Health Service
System, the Employees’ Retirement System, the Retiree Health Care Trust, the San Francisco County
Transportation Authority, the San Francisco Finance Corporation, and the Successor Agency to the San
Francisco Redevelopment Agency have been separately audited. The independent auditor’s report on our
current year’s financial statements is presented in the Financial Section.
Award for Financial Reporting
The Government Finance Officers Association of the United States and Canada (GFOA) awarded a
Certificate of Achievement for Excellence in Financial Reporting to the City for its Annual Comprehensive
Financial Report (ACFR) for the year ended June 30, 2022. This was the 41st consecutive year, beginning
with the year ended June 30, 1982, that the City has achieved this prestigious award. In order to be awarded
a Certificate of Achievement, a government must publish an easily readable and efficiently organized
ACFR. The ACFR must satisfy both Generally Accepted Accounting Principles (GAAP) and applicable legal
requirements.
A Certificate of Achievement is valid for a period of one year only. We believe that our current ACFR
continues to meet the Certificate of Achievement Program’s requirements and we are submitting it to GFOA
to determine its eligibility for another certificate.
Acknowledgements
I would like to express my appreciation to the entire staff of the Controller’s Office and the broader group
of City financial staff whose professionalism, dedication, and efficiency are responsible for the preparation
of this report, and more broadly the City’s financial operations during this past year. I would also like to
thank Macias Gini & O’Connell LLP for their invaluable professional support in the preparation of the ACFR.
Finally, I want to thank the Mayor and the Board of Supervisors for their leadership in directing the policy
and operations of our city government.
Respectfully submitted,
Ben Rosenfield
Controller

v

vi
CITY AND COUNTY OF SAN FRANCISCO
List of Principal Officials
As of June 30, 2023
vii
ELECTED OFFICIALS
Mayor .......................................................................................................... London Breed
Board of Supervisors:
President .............................................................................................. Aaron Peskin
Supervisor ............................................................................................. Dean Preston
Supervisor ............................................................................................. Shamann Walton
Supervisor ............................................................................................. Rafael Mandelman
Supervisor ............................................................................................. Connie Chan
Supervisor ............................................................................................. Hillary Ronen
Supervisor ............................................................................................. Myrna Melgar
Supervisor ............................................................................................. Catherine Stefani
Supervisor ............................................................................................. Joel Engardio
Supervisor ............................................................................................. Matt Dorsey
Supervisor ............................................................................................. Ahsha Safai
Assessor/Recorder ...................................................................................... Joaquín Torres
City Attorney ................................................................................................ David Chiu
District Attorney ........................................................................................... Brooke Jenkins
Public Defender ........................................................................................... Manohar Raju
Sheriff .......................................................................................................... Paul Miyamoto
Superior Courts
Presiding Judge ................................................................................... Judge Anne-Christine
Massullo
Treasurer/Tax Collector .............................................................................. José Cisneros
APPOINTED OFFICIALS
City Administrator ........................................................................................ Carmen Chu
Controller ..................................................................................................... Benjamin Rosenfield
DEPARTMENT DIRECTORS/ADMINISTRATORS
Airport .......................................................................................................... Ivar C. Satero
Appeals Board ............................................................................................. Julie Rosenberg
Arts Commission ......................................................................................... Ralph Remington
Asian Art Museum ...................................................................................... Jay Xu
Board of Supervisors .................................................................................. Angela Calvillo
Assessment Appeals Board ................................................................. Alistair Gibson
County Transportation Authority ........................................................... Tilly Chang
Building Inspection ...................................................................................... Patrick O’Riordan
California Academy of Sciences ................................................................. Scott D. Sampson
Child Support Services ................................................................................ Karen M. Roye
Children, Youth and Their Families ............................................................. Maria Su
Civil Service................................................................................................. Sandra Eng
Early Childhood ………………………………………………………………… Ingrid Mezquita
Economic and Workforce Development ...................................................... Sarah Dennis Phillips
Elections ...................................................................................................... John Arntz
Emergency Management ........................................................................... Mary Ellen Carroll
Entertainment .............................................................................................. Maggie Weiland
Environment ................................................................................................ Tyrone Jue (Acting)
Ethics ........................................................................................................... Gayathri Thaikkendiyil (Acting)
Fine Arts Museums ..................................................................................... Thomas P. Campbell
Fire .............................................................................................................. Jeanine Nicholson
CITY AND COUNTY OF SAN FRANCISCO
List of Principal Officials
As of June 30, 2023
viii
DEPARTMENT DIRECTORS/ADMINISTRATORS (Continued)
General Services Agency
Animal Care and Control ..................................................................... Virginia Donohue
Convention Facilities Management ..................................................... Kenneth Bukowski
County Clerk ......................................................................................... Diane Rea
Medical Examiner ................................................................................. Christopher Liverman
Public Works ......................................................................................... Carla Short (Interim)
Purchaser/Contract Administration ....................................................... Sailaja Kurella
Real Estate ........................................................................................... Andrico Penick
Department of Technology ................................................................... Linda Gerull
Health Service System ............................................................................... Abbie Yant
Homelessness and Supportive Housing .................................................... Shireen McSpadden
Human Resources ...................................................................................... Carol Isen
Human Rights ............................................................................................. Sheryl Evans Davis
Human Services .......................................................................................... Trent Rhorer
Aging and Adult Services .................................................................... Kelly Dearman
Juvenile Probation ....................................................................................... Katherine Weinstein Miller
Law Library Board of Trustees .................................................................... Marcia Bell
Library ......................................................................................................... Michael Lambert
Municipal Transportation Agency ............................................................... Jeffrey Tumlin
Planning ...................................................................................................... Rich Hillis
Police ........................................................................................................... William Scott
Police Accountability .................................................................................. Paul Henderson
Port .............................................................................................................. Elaine Forbes
Public Health ............................................................................................... Grant Colfax
Public Utilities .............................................................................................. Dennis Herrera
Recreation and Park ................................................................................... Phil Ginsburg
Residential Rent Board ............................................................................... Christina Varner
Retirement System ...................................................................................... Alison Romano
Sheriff Accountability ................................................................................... Vacant
Small Business ............................................................................................ Katy Tang
Status of Women ......................................................................................... Kimberly Ellis
Successor Agency to the Redevelopment Agency ..................................... Thor Kaslofsky
Superior Court ............................................................................................. Brandon E. Riley
Adult Probation .................................................................................... Cristel Tullock
War Memorial .............................................................................................. Kate Sofis
DISCRETELY PRESENTED COMPONENT UNIT
Treasure Island Development Authority ...................................................... Robert P. Beck

FINANCIAL SECTION
▪
Independent Auditor’s Report
▪
Management’s Discussion and Analysis
▪
Basic Financial Statements
▪
Required Supplementary Information
▪
Combining Financial Statements and
Schedules
▪
Other Information

www.mgocpa.com
Macias Gini & O’Connell LLP
2121 N. California Blvd., Suite 750
Walnut Creek, CA 94596
1
Independent Auditor’s Report
Honorable Mayor and Members of the Board of Supervisors
City and County of San Francisco, California
Opinions
We have audited the financial statements of the governmental activities, the business-type activities, each major
fund, and the aggregate discretely presented component unit and remaining fund information of the City and
County of San Francisco, California (City), as of and for the year ended June 30, 2023, and the related notes to
the financial statements, which collectively comprise the City’s basic financial statements as listed in the table of
contents.
In our opinion, based on our audit and the reports of the other auditors, the accompanying financial statements
referred to above present fairly, in all material respects, the respective financial position of the governmental
activities, the business-type activities, each major fund, and the aggregate discretely presented component unit
and remaining fund information of the City, as of June 30, 2023, and the respective changes in financial position,
and, where applicable, cash flows thereof for the year then ended in accordance with accounting principles
generally accepted in the United States of America.
We did not audit the financial statements of the San Francisco County Transportation Authority, San Francisco
International Airport (major fund), and Municipal Transportation Agency (major fund), which collectively represent
the following percentages of the assets, net position/fund balances, and revenues/additions of the following
opinion units.
Opinion Unit
Assets
Net Position/
Fund Balances
Revenues/
Additions
Governmental activities 1.1% 2.4% 1.6%
Business-type activities 53.7% 56.3% 41.0%
Aggregate discretely presented component
unit and remaining fund information
0.4% 0.1% 0.7%
Those financial statements were audited by other auditors whose reports have been furnished to us, and our
opinions, insofar as they relate to the amounts included for those entities, are based solely on the reports of the
other auditors.
Basis for Opinions
We conducted our audit in accordance with auditing standards generally accepted in the United States of America
(GAAS). Our responsibilities under those standards are further described in the Auditor’s Responsibilities for the
Audit of the Financial Statements section of our report. We are required to be independent of the City and to
meet our other ethical responsibilities, in accordance with the relevant ethical requirements relating to our audit.
We believe that the audit evidence we have obtained is sufficient and appropriate to provide a basis for our audit
opinions.
Emphasis of Matter
As discussed in Note 4 to the basic financial statements, effective July 1, 2022, the City adopted the provisions
of Governmental Accounting Standards Board (GASB) Statement No. 96, Subscription-Based Information
Technology Arrangements. Our opinions are not modified with respect to this matter.
2
Responsibilities of Management for the Financial Statements
The City’s management is responsible for the preparation and fair presentation of the financial statements in
accordance with accounting principles generally accepted in the United States of America, and for the design,
implementation, and maintenance of internal control relevant to the preparation and fair presentation of financial
statements that are free from material misstatement, whether due to fraud or error.
In preparing the financial statements, management is required to evaluate whether there are conditions or events,
considered in the aggregate, that raise substantial doubt about the City’s ability to continue as a going concern
for twelve months beyond the financial statement date, including any currently known information that may raise
substantial doubt shortly thereafter.
Auditor’s Responsibilities for the Audit of the Financial Statements
Our objectives are to obtain reasonable assurance about whether the financial statements as a whole are free
from material misstatement, whether due to fraud or error, and to issue an auditor’s report that includes our
opinions. Reasonable assurance is a high level of assurance but is not absolute assurance and therefore is not
a guarantee that an audit conducted in accordance with GAAS will always detect a material misstatement when
it exists. The risk of not detecting a material misstatement resulting from fraud is higher than for one resulting
from error, as fraud may involve collusion, forgery, intentional omissions, misrepresentations, or the override of
internal control. Misstatements are considered material if there is a substantial likelihood that, individually or in
the aggregate, they would influence the judgment made by a reasonable user based on the financial statements.
In performing an audit in accordance with GAAS, we:
Exercise professional judgment and maintain professional skepticism throughout the audit.
Identify and assess the risks of material misstatement of the financial statements, whether due to fraud or
error, and design and perform audit procedures responsive to those risks. Such procedures include
examining, on a test basis, evidence regarding the amounts and disclosures in the financial statements.
Obtain an understanding of internal control relevant to the audit in order to design audit procedures that are
appropriate in the circumstances, but not for the purpose of expressing an opinion on the effectiveness of
the City’s internal control. Accordingly, no such opinion is expressed.
Evaluate the appropriateness of accounting policies used and the reasonableness of significant accounting
estimates made by management, as well as evaluate the overall presentation of the financial statements.
Conclude whether, in our judgment, there are conditions or events, considered in the aggregate, that raise
substantial doubt about the City’s ability to continue as a going concern for a reasonable period of time.
We are required to communicate with those charged with governance regarding, among other matters, the
planned scope and timing of the audit, significant audit findings, and certain internal control-related matters that
we identified during the audit.
Required Supplementary Information
Accounting principles generally accepted in the United States of America require that the management’s
discussion and analysis, the schedules of the City’s proportionate share of the net pension liability/(asset), the
schedules of changes in net pension liability and related ratios, the schedules of changes in total pension liability
and related ratios, the schedules of employer contributions – pension plans, the schedules of changes in net
other postemployment benefits liability and related ratios, the schedules of employer contributions – other
postemployment healthcare benefits plans, and the budgetary comparison schedule – General Fund, as listed in
the table of contents, be presented to supplement the basic financial statements. Such information is the
responsibility of management and, although not a part of the basic financial statements, is required by the GASB
who considers it to be an essential part of financial reporting for placing the basic financial statements in an
appropriate operational, economic, or historical context. We and the other auditors have applied certain limited
procedures to the required supplementary information in accordance with GAAS, which consisted of inquiries of
management about the methods of preparing the information and comparing the information for consistency with
management’s responses to our inquiries, the basic financial statements, and other knowledge we obtained
during our audit of the basic financial statements. We do not express an opinion or provide any assurance on the
information because the limited procedures do not provide us with sufficient evidence to express an opinion or
provide any assurance.

3
Supplementary Information
Our audit was conducted for the purpose of forming opinions on the financial statements that collectively comprise
the City’s basic financial statements. The combining financial statements and schedules are presented for
purposes of additional analysis and are not a required part of the basic financial statements. The combining
financial statements and schedules are the responsibility of management and were derived from and relate
directly to the underlying accounting and other records used to prepare the basic financial statements. Such
information has been subjected to the auditing procedures applied in the audit of the basic financial statements
and certain additional procedures, including comparing and reconciling such information directly to the underlying
accounting and other records used to prepare the basic financial statements or to the basic financial statements
themselves, and other additional procedures in accordance with GAAS. In our opinion, the combining financial
statements and schedules are fairly stated, in all material respects, in relation to the basic financial statements
as a whole.
Other Information
The City’s management is responsible for the other information included in the annual comprehensive financial
report. The other information comprises the introductory, other information and statistical sections but does not
include the basic financial statements and our auditor's report thereon. Our opinions on the basic financial
statements do not cover the other information, and we do not express an opinion or any form of assurance
thereon.
In connection with our audit of the basic financial statements, our responsibility is to read the other information
and consider whether a material inconsistency exists between the other information and the basic financial
statements, or the other information otherwise appears to be materially misstated. If, based on the work
performed, we conclude that an uncorrected material misstatement of the other information exists, we are
required to describe it in our report.
Walnut Creek, California
December 29, 2023
CITY AND COUNTY OF SAN FRANCISCO
Management’s Discussion and Analysis (Unaudited)
Year Ended June 30, 2023
4
This section of the City and County of San Francisco’s (the City) Annual Comprehensive Financial Report
(ACFR) presents a narrative overview and analysis of the financial activities of the City for the year ended
June 30, 2023. We encourage readers to consider the information presented here in conjunction with
additional information in our transmittal letter.
FINANCIAL HIGHLIGHTS
The assets and deferred outflows of resources of the City exceeded its liabilities and deferred inflows of
resources at the end of the fiscal year by approximately $13.40 billion (net position). Of this balance,
$10.94 billion represents the City’s net investment in capital assets, $4.13 billion represents restricted net
position, and unrestricted net position has a deficit of $1.67 billion. The City’s total net position increased
by $777.8 million, or 6.1 percent, from the previous fiscal year before a cumulative effect of accounting
change which reduced net position by $203.8 million, for a change of $574.0 million after restatement. Of
this amount, total net investment in capital assets and unrestricted net position increased by $373.3 million
or 3.5 percent and $243.1 million or 12.7 percent, respectively, offset by a decrease in restricted net position
of $42.4 million or 1.0 percent.
The City’s governmental funds reported total revenues of $8.67 billion, which is a $129.9 million or
1.5 percent increase from the prior year. Within this, revenues from property taxes, hotel room tax, other
local taxes, interest and investment income and rent and concessions grew by approximately $158.8
million, $104.3 million, $210.9 million, $317.7 million and $52.8 million, respectively, offset by decreases in
federal revenues and real property transfer tax of $461.0 million and $334.1 million, respectively.
Governmental funds expenditures totaled $8.42 billion for this period, a $663.8 million or 8.6 percent
increase, reflecting an increase in demand for governmental services of $729.7 million, offset by decreases
in debt service of $36.1 million and capital outlay of $29.8 million.
The City’s total short-term debt decreased by $697.0 million in this fiscal year. The increase of $9.0 million
in the governmental activities was due to the issuance of Commercial Paper (CP) to finance the City’s
projects for the acquisition and development of affordable rental housing, critical repair, and improvements
to City-owned buildings, to finance and refinance approved capital projects, including the Hope SF
properties, Homeless Services Center, Laguna Honda Hospital Wings Reuse Project, and AITC
Immunization and Travel Clinic Relocation, and improvement and equipping of certain existing real property
including the Hall of Justice facilities, and purchase of police vehicles. The short-term debt in the business-
type activities decreased by $706.0 million. The Airport issued $417.3 million to fund its capital improvement
projects. The Water Enterprise and the Hetch Hetchy Water and Power issued a total of $487.8 million of
CP to fund their capital projects and repaid $206.3 million and $40.0 million of CP, respectively. The Airport,
Water Enterprise and the Hetch Hetchy Water and Power reclassed $497.8 million, $371.5 million, and
$116.4 million of CP short-term debt repaid by revenue bonds issued in fiscal year 2023-24, to long-term
debt. The Wastewater Enterprise paid off its outstanding CP of $379.2 million through the issuance of
revenue bonds.
The City’s governmental activities long-term debt including lease and subscription liabilities decreased by
$123.9 million. A total of $238.6 million in general obligation bonds with bond premium of $5.4 million were
issued to provide funds to acquire or improve real property to stabilize, improve and make permanent
investment in supportive housing facilities that deliver services to persons experiencing mental health
challenges, substance use disorder, and or homelessness, improve parks, open spaces and recreation
facilities and condition of the City’s streets; to protect the waterfront, BART and Muni infrastructure,
buildings, historic piers , and road from earthquakes, flooding and rising sea level by repairing the 100 year-
old Embarcadero Seawall; to finance the acquisition, construction and preservation of affordable housing
to low and middle income households through programs that will prioritize vulnerable populations such as
the City’s working families, veterans, seniors and persons with disabilities, to assist in the acquisition,
rehabilitation and preservation of affordable housing, assist the City’s middle-income residents or workers
in obtaining affordable rental or homeownership opportunities. The City, through the Infrastructure and
Revitalization Financing District No. 1 (Treasure Island) also issued $29.4 million in tax increment revenue
bonds with bond premium of $1.0 million to fund the acquisition of certain public facilities and improvement
CITY AND COUNTY OF SAN FRANCISCO
Management’s Discussion and Analysis (Unaudited) (Continued)
Year Ended June 30, 2023
5
for the Treasure Island/Yerba Buena Island Development project and to finance the acquisition and
construction of affordable housing on Treasure Island. The increase in debt was offset by $346.6 million
scheduled debt service payments and amortization of bond premium of $27.8 million. In addition, GASB 87
and GASB 96 requires recognizing lease liabilities of $496.2 million and subscription liabilities of $35.3
million with a net decrease of $15.1 million and $8.8 million, respectively due to principal payments made
exceeded any new leases and subscriptions that commenced during the year.
The business-type activities long-term debt including lease and subscription liabilities increased by $1.70
billion. The Airport issued $241.9 million in revenue refunding bonds with bond premium of $21.6 million to
refund certain outstanding revenue bonds and repay outstanding CP notes. The Wastewater Enterprise
issued $1.11 billion in revenue bonds with bond premium of $178.5 million to refinance the CP notes for
Wastewater capital projects and to refund revenue bonds for debt service savings. The Water and the
Wastewater Enterprises also drew down additional loan of $60.4 million from the State of California to fund
various water and sewer system improvement projects. The Wastewater Enterprise received a loan from
the United States Environmental Protection Agency of $122.4 million to fund a portion of the cost of its
Biosolids Digester Facility Project. The Airport, Water Enterprise and the Hetch Hetchy Water and Power
reclassed $497.8 million, $371.5 million, and $116.4 million of CP short-term debt repaid by revenue bonds
issued in fiscal year 2023-24, to long-term debt. The increase in debt was partially offset by $900.6 million
in refunded bonds and scheduled debt service payments and $113.6 million of bond premium and discount
amortization. In addition, GASB 87 and GASB 96 requires recognizing lease liabilities of $230.2 million and
subscription liabilities of $2.8 million with a net decrease of $5.7 million and $0.9 million, respectively due
to principal payments made exceeded any new leases and subscriptions that commenced during the year.
The City adopted the provisions of several Governmental Accounting Standards Board (GASB) Statements
as of July 1, 2022. Statement No. 91, Conduit Debt Obligations clarifies the definition of conduit debt and
establishes new recognition, measurement, and disclosure requirements. The net effect of this change was
a $106.6 million reduction in the City’s beginning net position. Statement No. 96, Subscription-Based
Information Technology Arrangements clarifies measurement and recognition of capitalizable costs,
intangible assets, and subscription liabilities for arrangements which convey control of the right to use
another party’s software for a period of time in an exchange or exchange-like transaction. The net effect of
this change was a $5.2 million increase in the City’s beginning net position. In addition, the City re-evaluated
the reporting of Mission Rock Special Tax District (STD) and changed its reporting entity from a fiduciary
component unit to a blended component unit. The impact of the change in reporting entity resulted in a
decrease of $102.3 million in the City’s beginning net position.

CITY AND COUNTY OF SAN FRANCISCO
Management’s Discussion and Analysis (Unaudited) (Continued)
Year Ended June 30, 2023
6
OVERVIEW OF THE FINANCIAL STATEMENTS
This discussion and analysis are intended to serve as an introduction to the City’s basic financial
statements. The City’s basic financial statements comprise three components: (1) Government-wide
financial statements, (2) Fund financial statements, and (3) Notes to the financial statements. This report
also contains other supplementary information in addition to the basic financial statements themselves.
These various elements of the Annual Comprehensive Financial Report (ACFR) are related as shown in
the graphic below.
Organization of City and County of San Francisco Annual Comprehensive Financial Report
ACFR
Introductory
Section
INTRODUCTORY SECTION
+
Financial
Section
Management's Discussion and Analysis (MD&A)
Government -
wide Financial
Statements
Fund Financial Statements
Statement of
net position
Governmental
Funds
Proprietary
Funds
Fiduciary
Funds
Balance
sheet
Statement of
net position
Statement of
fiduciary
net position
Statement of
revenues,
expenses, and
changes in
fund net position
Statement of
activities
Statement of
revenues,
expenditures, and
changes in fund
balances
Statement of
changes in
fiduciary
net position
Statement of
cash flows
Notes to the Financial Statements
Required Supplementary Information Other Than MD&A
Information on individual nonmajor funds and other
supplementary information that is not required
+
Statistical
Section
STATISTICAL SECTION

CITY AND COUNTY OF SAN FRANCISCO
Management’s Discussion and Analysis (Unaudited) (Continued)
Year Ended June 30, 2023
7
The following table summarizes the major features of the financial statements. The overview section below
also describes the structure and contents of each of the statements in more detail.
Government -
wide Financial
Statements
Fund Financial Statements
Governmental
Funds
Proprietary
Funds
Fiduciary
Funds
Scope
Entire entity
(except
fiduciary funds)
The day-to-day
operating activities of
the City for basic
governmental
services
The day-to-day
operating activities
of the City for
business-type
enterprises
Instances in which
the City
administers
resources on
behalf of others,
such as employee
benefits
Accounting
basis and
measurement
focus
Accrual
accounting and
economic
resources focus
Modified accrual
accounting and
current financial
resources focus
Accrual accounting
and economic
resources focus
Accrual accounting
and economic
resources focus
Type of
balance
information
All assets,
deferred
outflows of
resources,
liabilities, and
deferred inflows
of resources,
both financial
and capital,
short-term and
long-term
Balances of
spendable resources
All assets, deferred
outflows of
resources,
liabilities, and
deferred inflows of
resources, both
financial and
capital, short-term
and long-term
All resources held
in a trustee or
custodial capacity
for others
Type of inflow
and outflow
information
All inflows and
outflows during
year, regardless
of when cash is
received or paid
Near-term inflows and
outflows of spendable
resources
All inflows and
outflows during
year, regardless of
when cash is
received or paid
All additions and
deductions during
the year,
regardless of when
cash is received or
paid
Government-wide Financial Statements
The government-wide financial statements are designed to provide readers with a broad overview of the
City’s finances, in a manner similar to a private-sector business.
The statement of net position presents information on all of the City’s assets, deferred outflows of
resources, liabilities, and deferred inflows of resources, with the difference reported as net position. Over
time, increases or decreases in net position may serve as a useful indicator of whether or not the financial
position of the City is improving or deteriorating.

CITY AND COUNTY OF SAN FRANCISCO
Management’s Discussion and Analysis (Unaudited) (Continued)
Year Ended June 30, 2023
8
The statement of activities presents information showing how the City’s net position changed during the
most recent fiscal year. All changes in net position are reported as soon as the underlying event giving rise
to the change occurs, regardless of the timing of related cash flows. Thus, revenues and expenses are
reported in this statement for some items that will only result in cash flows in future fiscal periods, such as
revenues pertaining to uncollected taxes and expenses pertaining to earned but unused vacation and sick
leave.
Both of the government-wide financial statements distinguish functions of the City that are principally
supported by taxes and intergovernmental revenues (governmental activities) from other functions that are
intended to recover all or a significant portion of their costs through user fees and charges (business-type
activities). The governmental activities of the City include public protection, public works, transportation and
commerce, human welfare and neighborhood development, community health, culture and recreation,
general administration and finance, distributions to other governments, and general City responsibilities.
The business-type activities of the City include an airport, port, transportation system (including parking),
water and power operations, an acute care hospital, a long-term care hospital, and sewer operations.
The government-wide financial statements include not only the City itself (known as the primary
government), but also a legally separate development authority, the Treasure Island Development Authority
(TIDA), for which the City is financially accountable. Financial information for this component unit is reported
separately from the financial information presented for the primary government. Included within the
governmental activities of the government-wide financial statements are the San Francisco County
Transportation Authority (Transportation Authority), several infrastructure financing districts and
infrastructure and revitalization financing districts, and San Francisco Finance Corporation. Included within
the business-type activities of the government-wide financial statements is the operation of the San
Francisco Parking Authority. Although legally separate from the City, these component units are blended
with the primary government because of their governance or financial relationships to the City. The City
also considers the Successor Agency to the Redevelopment Agency (Successor Agency) and various
Community Facilities Districts as fiduciary component units of the City.
Fund Financial Statements
The fund financial statements are designed to report information about groupings of related accounts that
are used to maintain control over resources that have been segregated for specific activities or objectives.
The City, like other state and local governments, uses fund accounting to ensure and demonstrate
compliance with finance-related legal requirements. All of the funds of the City can be divided into the
following three categories: governmental funds, proprietary funds, and fiduciary funds.
Governmental funds. Governmental funds are used to account for essentially the same functions reported
as governmental activities in the government-wide financial statements – i.e. most of the City’s basic
services are reported in governmental funds. These statements, however, focus on (1) how cash and other
financial assets can readily be converted to available resources and (2) the balances left at year-end that
are available and the constraints for spending. Such information may be useful in determining what financial
resources are available in the near future to finance the City’s programs.
Because the focus of governmental funds is narrower than that of the government-wide financial
statements, it is useful to compare the information presented for governmental funds with similar information
presented for governmental activities in the government-wide financial statements. By doing so, readers
may better understand the long-term impact of the government’s near-term financing decisions. Both the
governmental funds balance sheet and the governmental funds statement of revenues, expenditures, and
changes in fund balances provide a reconciliation to facilitate this comparison between governmental funds
and governmental activities.

CITY AND COUNTY OF SAN FRANCISCO
Management’s Discussion and Analysis (Unaudited) (Continued)
Year Ended June 30, 2023
9
The City maintains several individual governmental funds organized according to their type (special
revenue, debt service, capital projects and permanent funds). Information is presented separately in the
governmental funds balance sheet and in the governmental funds statement of revenues, expenditures,
and changes in fund balances for the General Fund, which is considered to be a major fund. Data from the
remaining governmental funds are combined into a single, aggregated presentation. Individual fund data
for each of the nonmajor governmental funds is provided in the form of combining statements elsewhere in
this report.
Proprietary funds. Proprietary funds are generally used to account for services for which the City charges
customers – either outside customers, or internal units or departments of the City. Proprietary funds provide
the same type of information as shown in the government-wide financial statements, only in more detail.
The City maintains the following two types of proprietary funds:
• Enterprise funds are used to report the same functions presented as business-type activities in the
government-wide financial statements. The City uses enterprise funds to account for the operations of
the San Francisco International Airport (SFO or Airport), San Francisco Water Enterprise (Water),
Hetch Hetchy Water and Power (Hetch Hetchy), San Francisco Municipal Transportation Agency
(SFMTA), San Francisco General Hospital (SFGH), San Francisco Wastewater Enterprise
(Wastewater), Port of San Francisco (Port), and the Laguna Honda Hospital (LHH), all of which are
considered to be major funds of the City.
• Internal Service funds are used to report activities that provide supplies and services for certain City
programs and activities. The City uses internal service funds to account for its fleet of vehicles,
management information and telecommunication services, printing and mail services, and for lease-
purchases of equipment by the San Francisco Finance Corporation. Because these services
predominantly benefit governmental rather than business-type functions, they have been included
within governmental activities in the government-wide financial statements. The internal service funds
are combined into a single, aggregated presentation in the proprietary fund financial statements.
Individual fund data for the internal service funds is provided in the form of combining statements
elsewhere in this report.
Fiduciary funds. Fiduciary funds are used to account for resources held for the benefit of parties outside
the City. The City employees’ pension and health plans, retirees’ health care, the Successor Agency, the
external portion of the Treasurer’s Office investment pool, and the other custodial funds are reported under
the fiduciary funds. Since the resources of these funds are not available to support the City’s own programs,
they are not reflected in the government-wide financial statements. The accounting used for fiduciary funds
is much like that used for proprietary funds.
Notes to the Basic Financial Statements
The notes to the basic financial statements provide additional information that is essential to a full
understanding of the data provided in the government-wide and fund financial statements.
Required Supplementary Information
In addition to the basic financial statements and accompanying notes, this report presents certain required
supplementary information concerning the City’s net pension liability (asset), pension contributions, net
OPEB liability, and OPEB contributions.
The City adopts a rolling two-year budget for its General Fund. A budgetary comparison schedule has been
provided for the General Fund to demonstrate compliance with this budget.

CITY AND COUNTY OF SAN FRANCISCO
Management’s Discussion and Analysis (Unaudited) (Continued)
Year Ended June 30, 2023
10
Combining Statements and Schedules
The combining statements and schedules referred to earlier in connection with nonmajor governmental
funds, internal service funds, and fiduciary funds are presented immediately following the required
supplementary information.
Condensed Statement of Net Position
(in thousands)
Analysis of Net Position
The City’s total net position, which may serve as a useful indicator of the government’s financial position,
was $13.40 billion at the end of fiscal year 2022-23, a 4.5 percent increase over the prior year. The City’s
governmental activities account for $5.52 billion of this total and $7.88 billion stem from its business-type
activities.
The largest portion of the City’s net position is the $10.94 billion in net investment in capital assets (e.g.
land, buildings, and equipment) which includes the reclassification of $407.1 million from governmental
activities to business-type activities related to the City’s general obligation bonds and certificates of
participation that fund various enterprise fund department’s projects. This reflects a $373.3 million or 3.5
percent increase over the prior year. With that, increases of $308.0 million in the governmental activities
and $87.8 million in the business-type activities, highlighted by increases of $214.2 million at SFMTA and
$142.5 million at Wastewater Enterprise offset by decreases of $276.4 million at Airport and $8.0 million at
Port, respectively. Since the City uses capital assets to provide services, these assets are not available for
future spending. Further, the resources required to pay the outstanding debt must come from other sources
since the capital assets themselves cannot be liquidated to pay that liability.
Another portion of the City’s net position is the $4.13 billion that represents restricted resources that are
subject to external limitations regarding their use. The remaining portion of total net position is a deficit of
$1.65 billion, which consists of a $2.03 billion deficit in governmental activities and $168.1 million deficit in
business-type activities. The governmental activities and business-type activities deficit is largely due to
Total
2023 2022 * 2023 2022 * 2023 2022 *
Assets:
Current and other assets.......................... 9,823,170$ 11,106,323$ 8,695,483$ 8,664,608$ 18,518,653$ 19,770,931$
Capital assets............................................. 7,803,629 7,587,262 25,146,242 24,258,288 32,949,871 31,845,550
Total assets........................................... 17,626,799 18,693,585 33,841,725 32,922,896 51,468,524 51,616,481
Deferred outflows of resources: 1,471,655 1,146,971 1,194,152 1,035,907 2,665,807 2,182,878
Liabilities:
Current liabilities......................................... 3,186,880 2,794,731 2,287,448 2,839,086 5,474,328 5,633,817
Noncurrent liabilities.................................. 9,413,014 7,668,025 22,575,386 19,802,906 31,988,400 27,470,931
Total liabilities.......................................... 12,599,894 10,462,756 24,862,834 22,641,992 37,462,728 33,104,748
Deferred inflows of resources: 976,014 4,046,781 2,294,394 3,820,651 3,270,408 7,867,432
Net position:
Net investment in capital assets **......... 4,491,155 4,183,166 6,851,218 6,763,452 10,935,272 10,561,965
Restricted **................................................. 3,062,057 3,185,319 1,195,544 1,168,057 4,132,463 4,174,837
Unrestricted (deficit) **............................... (2,030,666) (2,037,466) (168,113) (435,349) (1,666,540) (1,909,623)
Total net position..................................... 5,522,546$ 5,331,019$ 7,878,649$ 7,496,160$ 13,401,195$ 12,827,179$
Business-type activities
Governmental activities
** See Note 10(d) to the basic financial statements.
* Prior Year amounts have not been restated for implementation of GASB Statement Nos. 91, 94, and 96 and the change in reporting
entity.

CITY AND COUNTY OF SAN FRANCISCO
Management’s Discussion and Analysis (Unaudited) (Continued)
Year Ended June 30, 2023
11
recording net liabilities related to pension and other postemployment benefits (see Note 9). The
governmental activities deficit also included $532.2 million in long-term bonds liabilities that fund the LHH
rebuild project, certain park facilities and Embarcadero seawall earthquake safety projects at the Port,
improvement projects for reliable emergency water supply for the Water Enterprise, and road paving and
street safety in SFMTA (see Note 10(d)). The business-type activities deficit also includes structural
operating losses from SFGH and LHH subsidized by the General Fund.
Condensed Statement of Activities
(in thousands)
Analysis of Changes in Net Position
The City’s change in net position was $777.8 million in fiscal year 2022-23, a 64.0 percent decrease from
the prior fiscal year before the cumulative effect of $203.8 million for the adoption of GASB Statement Nos.
91 and 96 and change of reporting entity effective July 1, 2022, as noted above. The decrease in the change
in net position was due to decreases of $1.28 billion and $103.5 million from governmental activities and
business-type activities, respectively.
Governmental activities Business-type activities Total Governmental activities
2023 2022 * 2023 2022 * 2023 2022 *
Revenues
Program revenues:
Charges for services...................................................................... 889,685$ 785,299$ 4,395,388$ 3,848,186$ 5,285,073$ 4,633,485$
Operating grants and contributions............................................. 1,762,809 2,185,343 444,009 545,636 2,206,818 2,730,979
Capital grants and contributions.................................................. 150,625 105,459 235,952 185,816 386,577 291,275
General revenues:
Property taxes.................................................................................. 3,167,382 3,004,800 - - 3,167,382 3,004,800
Business taxes................................................................................ 1,290,918 1,326,675 - - 1,290,918 1,326,675
Sales and use tax........................................................................... 309,385 293,155 - - 309,385 293,155
Hotel room tax.................................................................................. 278,961 174,609 - - 278,961 174,609
Utility users tax................................................................................. 110,661 105,225 - - 110,661 105,225
Other local taxes.............................................................................. 564,753 676,304 - - 564,753 676,304
Interest and investment income (loss)....................................... 157,267 (160,687) 108,704 (108,628) 265,971 (269,315)
Other.................................................................................................. 99,471 80,295 240,145 327,454 339,616 407,749
Total revenues.............................................................................. 8,781,917 8,576,477 5,424,198 4,798,464 14,206,115 13,374,941
Expenses
Public protection.............................................................................. 1,671,702 1,252,725 - - 1,671,702 1,252,725
Public works, transportation
and commerce............................................................................. 446,286 336,059 - - 446,286 336,059
Human welfare and
neighborhood development....................................................... 2,883,425 2,332,530 - - 2,883,425 2,332,530
Community health........................................................................... 1,206,314 1,151,847 - - 1,206,314 1,151,847
Culture and recreation................................................................... 537,393 398,314 - - 537,393 398,314
General administration and finance............................................ 482,618 335,772 - - 482,618 335,772
Distributions to other governments............................................. 49,113 47,296 - - 49,113 47,296
General City responsibilities........................................................ 175,522 129,138 - - 175,522 129,138
Unallocated Interest on long-term debt...................................... 155,749 155,467 - - 155,749 155,467
Airport................................................................................................ - - 1,278,517 1,175,430 1,278,517 1,175,430
Transportation................................................................................. - - 1,439,742 1,076,249 1,439,742 1,076,249
Port..................................................................................................... - - 127,817 110,108 127,817 110,108
Water................................................................................................. - - 666,970 606,409 666,970 606,409
Power................................................................................................ - - 544,742 477,202 544,742 477,202
Hospitals.......................................................................................... - - 1,419,409 1,300,196 1,419,409 1,300,196
Sewer................................................................................................ - - 343,018 326,952 343,018 326,952
Total expenses............................................................................. 7,608,122 6,139,148 5,820,215 5,072,546 13,428,337 11,211,694
Increase/(decrease) in net position
before transfers......................................................................... 1,173,795 2,437,329 (396,017) (274,082) 777,778 2,163,247
Transfers....................................................................................... (885,106) (866,631) 885,106 866,631 - -
Change in net position................................................................ 288,689 1,570,698 489,089 592,549 777,778 2,163,247
Net position at beginning of year, as previously reported.......... 5,331,019 3,759,197 7,496,160 6,896,026 12,827,179 10,655,223
Cumulative effect of accounting change........................................ (97,162) 1,124 (106,600) 7,585 (203,762) 8,709
Net position at beginning of year, as restated.............................. 5,233,857 3,760,321 7,389,560 6,903,611 12,623,417 10,663,932
Net position at end of year................................................................ 5,522,546$ 5,331,019$ 7,878,649$ 7,496,160$ 13,401,195$ 12,827,179$
* Prior Year amounts have not been restated for implementation of GASB Statement Nos. 91, 94, and 96 and the change in reporting entity.

CITY AND COUNTY OF SAN FRANCISCO
Management’s Discussion and Analysis (Unaudited) (Continued)
Year Ended June 30, 2023
12
The City’s governmental activities experienced a $205.4 million or 2.4 percent growth in total revenues with
an increase in total expenses of $1.47 billion or 23.9 percent this fiscal year. Business-type activities
revenues increased by $625.7 million or 13.0 percent, and total expenses increased by $747.7 million, or
14.7 percent. The net transfer to business-type activities increased by $18.5 million. The major components
of increased revenue Citywide are increased charges for services of $651.6 million, property taxes of
$162.6 million and interest and investment income of $535.3 million, offset by decreases of operating grants
and contributions of $524.2 million, business taxes of $35.8 million and other local taxes of $111.5 million.
Discussion of these and other changes is presented in the governmental activities and business-type
activities sections that follow.
CITY AND COUNTY OF SAN FRANCISCO
Management’s Discussion and Analysis (Unaudited) (Continued)
Year Ended June 30, 2023
13
Governmental Activities. Governmental activities increased the City’s total net position by $288.7 million,
excluding the impact of a $97.2 million restatement. Key factors contributing to the changes are discussed
below.
Overall, total revenues from governmental activities were $8.78 billion, a $205.4 million or 2.4 percent
improvement over the prior year. For the same period, expenses totaled $7.61 billion, a $1.47 billion or 23.9
percent increase before transfers of $885.1 million.
Property tax revenues rose by $162.6 million or 5.4 percent mainly due to $143.0 million increased
collections of secured and unsecured property taxes and $17.4 million growth of in-lieu of vehicle license
fee. Business tax revenues, however, fell moderately by $35.8 million or 2.7 percent primarily because of
increased deferrals related to tax litigation for gross receipt taxes in fiscal year 2022-23.
Other local taxes dropped by $111.6 million, or 16.5 percent, of which the real property transfer tax
accounted for $334.1 million decrease. This revenue is one of the most volatile of all sources due to its
highly progressive rate structure, and is entirely driven by high-value transfers, predominately commercial
properties in the City’s downtown core. This tax is also highly sensitive to economic cycles and interest
rates. Since the beginning of the COVID-19 pandemic in spring 2020, businesses in office-using sectors
have largely adopted remote and hybrid work practices, resulting in persistently high office vacancies and
reduced commercial real estate values. The rising interest rate environment increased the cost of
borrowing and dampened investment in the commercial real sector. Additional factors affecting transfer tax
revenue include credit availability, foreign capital flows, and the relative attractiveness of San Francisco
real estate compared to other investment options. The number of transfers of high-value commercial real
estate decreased from 101 in fiscal year 2021-22 to only 55 in fiscal year 2022-23. In addition, the fiscal
year 2021-22 revenue included two once-in-a-generation transfers, which together yielded approximately
$88.0 million. The decrease in transfer tax revenues was partly offset by $206.0 million of the Overpaid
Executive Tax (OET) which was approved by voters in November 2020, and became effective in tax year
2022, with the first collections in fiscal year 2022-23. As pandemic restrictions eased and economic activity
increased, the City’s parking tax also saw an improvement of $11.6 million, and traffic congestion mitigation
tax an increase of $2.3 million.
Hotel room tax was up by $104.4 million owing to the steady and strong levels of domestic and international
tourism and the return of some conferences and conventions. Total enplanements at San Francisco
International Airport improved by 34.6 percent over fiscal year 2021-22, although still below that of fiscal
year 2018-19. By region, international enplanement to Asia, Canada and Oceania had the strongest growth.
Revenue per Available Room (RevPAR), a measure highly correlated with hotel tax revenue, is a function
of occupancy and average daily room rates (ADR). The annual average RevPAR increased from $108.16
in fiscal year 2021-22 to $154.76 in fiscal year 2022-23, an improvement of $46.60, or 43.1 percent. The
annual ADR increased from $194.24 in fiscal year 2021-22 to $243.03 in fiscal year 2022-23, an
improvement of $48.79 or 25.1 percent. The annual average occupancy levels also lifted from 54.2 percent
to 63.8 percent, or 9.6 percent over the prior year. In addition, there was a total of 33 conferences with over
286,000 attendees that took place in Moscone Center in the current year compared to 23 conferences and
126,000 attendees in the prior year. The effect of convention compression pricing drove the RevPar to
spike with each event.
Sales and use tax revenue grew by $16.2 million or 5.5 percent as business rebounded, primarily in
restaurants and hotels sector as in-person activities, tourism, conventions and other events increased
daytime population. This was followed by fuel and service stations from increased prices of crude oil, jet
fuel, diesel and gasoline, consumer consumption and air travel. The gain was, however, slightly offset by
decrease of allocation from e-commerce as a major online merchant began to deliver goods to San
Franciscans through in-state fulfillment centers, resulting in shifting sales tax revenue from San Francisco
to the jurisdictions in which the centers are located.
CITY AND COUNTY OF SAN FRANCISCO
Management’s Discussion and Analysis (Unaudited) (Continued)
Year Ended June 30, 2023
14
Interest and investment income jumped by $318.0 million, principally because the unrealized loss
adjustment of the City Treasury investments pool decreased from $259.7 million with an earned income
yield of 0.91% at June 2022 to $17.9 million and 3.01%, at June 2023. The variance is due to the inverted
yield curve as the Federal Reserve continued to aggressively increase interest rates to stem surging
inflation. Actual interest earnings also improved due to the Pool’s higher year-to-date interest earning rate
of 2.12% this fiscal year versus 0.6% in the prior year.
Total grants and contributions decreased by $377.4 million or 16.5 percent. Operating grants and
contributions declined by $422.5 million or 19.3 percent primarily due to the reduction and expiration of the
significant, one-time COVID disaster relief sources to the City. In fiscal years 2020-21 and 2021-22, the
City received $312.4 million of American Rescue Plan Act (ARPA) State and Local Fiscal Recovery Fund
(SLFRF) revenues in each year, and used the aid to replace revenue losses that the City experienced due
to business closures and other dynamics related to the COVID-19 emergency. There were no SLFRF
revenues in 2023. Additionally, the City received $2.6 million of FEMA reimbursements for COVID-19
expenses compared to $183.4 million in the prior year. The $180.8 million reduction is primarily driven by
FEMA’s re-prioritization to review submissions of jurisdictions who have not yet received reimbursements
of any COVID-related costs. The City expects additional reimbursement from FEMA in future years. Capital
grants and contributions increased by $45.2 million or 42.8 percent mostly driven by property acquisitions
funded by federal grants for human welfare projects.
Total charges for services rose by $104.4 million or 13.3 percent owing to the continual rebound in economic
activity. Gains included $54.0 million in rents and concessions from convention, performance, and
recreational facilities, $20.8 million in private grants, and $15.2 million in services to other agencies.
Licenses, permits, and other revenues made up the remaining increases.
Net transfers from governmental activities to business-type activities were $885.1 million, a $18.5 million or
2.1 percent increase from the prior year. Major changes included $62.8 million more transfers from General
Fund to General Hospital and $23.0 million more to Laguna Honda Hospital, respectively, to support salary,
fringe, pharmaceutical and other expenditure increases. The Port also received $39.2 million transfers
primarily from Series 2023B General Obligation Bond proceeds for seawall projects. This was partly offset
by a decrease of net transfers to SFMTA primarily due to a total of $122.3 million transfers of two general
obligation bonds proceeds issued in the Street Improvement Capital Project Funds to fund the
transportation and road improvement projects in the prior year versus no similar issuance in this fiscal year.
Transfers from General Fund to SFMTA increased by $36.9 million due in part to increased voter mandated
funding requirements tied to aggregate discretionary revenue and the opening of the Central subway
service in this fiscal year. The net transfers to SFMTA decreased by $77.9 million compared to prior year.
Water also received $14.4 million less transfer due to the one-time bond proceeds from the Series 2021E
Earthquake Safety and Emergency Response General Obligation Bonds issuance in fiscal year 2021-22.
In addition, the transfer from the San Francisco International Airport to the General Fund increased by $10.8
million due to higher concession, parking, and transportation revenues driven by the rise in air travel.
Total governmental expenses grew by $1,469.0 million, or 23.9 percent, mainly attributed to the surge of
pension liability expenses of $668.4 million resulting from investment losses and changes in assumption of
the discount rate from 7.4 percent to 7.2 percent. Though the loss was slightly offset by the decrease in the
Supplemental COLA assumptions, there were liability experience losses that further increased the net
pension liability and the related expenses. City grants payments increased by $346.0 million, aid assistance
payments and issuance of loans with related allowance have a combined increase of $137.4 million.
Salaries, fringe and overhead costs also increased by $223.4 million due to citywide wage increases over
the prior year. Departments in human welfare and neighborhood development functions had major
combined increases in expenses of $550.9 million, followed by public protection departments of $419.0
million, and general administration and finance and culture and recreation of $146.8 million and $139.1
million, respectively.

CITY AND COUNTY OF SAN FRANCISCO
Management’s Discussion and Analysis (Unaudited) (Continued)
Year Ended June 30, 2023
15
CITY AND COUNTY OF SAN FRANCISCO
Management’s Discussion and Analysis (Unaudited) (Continued)
Year Ended June 30, 2023
16
Business-type activities increased the City’s net position by $489.1 million and key factors contributing
to this increase are as follows:
• The San Francisco International Airport had a decrease in net position at fiscal year-end of
$56.1 million, compared to a $165.4 million decrease in the prior year, a $109.3 million difference.
Operating revenues totaled $1,064.1 million for fiscal year 2022-23, an increase of $242.9 million or
29.6 percent over the prior year and included an increase of $161.4 million in aviation primarily due to
passenger traffic beginning to rebound, $22.9 million in rents and concessions, $51.3 million in parking
and transportation, and $7.3 million in other revenues due to increased passenger traffic. For the same
period, the Airport’s operating expenses increased by $92.9 million, or 11.5 percent, for a net operating
income of $161.4 million for the period. Net nonoperating activities saw a deficit of $197.4 million versus
$180.0 million deficit in the prior year, a $17.4 million increase. The increase of $92.9 million in
operating expenses is primarily due to an increase in personal services of $66.8 million due to an
increase in pension expenses as a result of investment losses, and $16.3 million in contractual services
due to increased expenses for various professional services contracts, such as parking, shuttle buses,
and technology services. The net increase of $17.4 million in nonoperating activities is primarily due to
a decrease in other nonoperating revenues of $144.9 million from the Federal ARPA grant being fully
expended in fiscal year 2021-22, offset by an increase in interest income and investment income of
$106.7 million due to investment fair value adjustments, and an increase of $19.5 million in passenger
facility charges from the growth of passenger traffic and the easing of the COVID-19 restrictions. Capital
contributions decreased by $12.3 million primarily due to assets transferred from SFO Fuel to Airport
in the prior year. Transfers out increased by $10.8 million due to higher service payments to the City
resulting from higher revenues.
• The City’s Water Enterprise, the third largest such entity in California, reported an increase in net
position of $58.7 million at the end of fiscal year 2022-23, compared to a decrease of $17.9 million at
the end of the previous year, a $76.6 million difference. Operating revenues totaled $691.1 million,
operating expenses totaled $460.3 million, nonoperating activities totaled a net expense of $154.9
million and the net decrease from transfers was $20.0 million. Compared to the prior year, operating
revenues increased $118.0 million which was mainly due to an adopted rate increase of 15.9 percent
for wholesale customers and a 5.0 percent drought surcharge for retail customers beginning July 1,
2022. The enterprise reported a total increase in operating expenses of $58.5 million in fiscal year
2022-23 mostly due to an increase of $52.3 million in personal services from adjustments to pension
expenses based on actuarial estimates. Net nonoperating activity decreased by $18.8 million of net
expense primarily due to increased interest and investment income of $22.1 million from prior year
unrealized losses and higher interest earned on pooled cash. Transfers out increased $20.0 million due
to various Mountain Tunnel Improvement projects.
• Hetch Hetchy Water and Power and CleanPowerSF ended fiscal year 2022-23 with a net position
increase of $82.8 million, compared to a $43.5 million increase the prior year, a difference of $39.3
million. This change consisted of an increase in operating income of $37.5 million, an increase in net
nonoperating activities of $8.8 million, an increase in capital contributions of $2.5 million, and a
decrease in net transfers from the City of $9.5 million. This enterprise consists of three segments:
Hetchy Water upcountry operations and water system, which reported a $24.9 million increase in
change in net position, Hetchy Power (also known as the Power Enterprise), which reported a $24.2
million increase in change in net position, and CleanPowerSF, which reported a $33.7 million increase
in net position. Hetchy Water operating revenues increased by $3.4 million mainly due to an increase
in water assessment fees from the Water Enterprise to fund upcountry water-related costs, while
operating expenses decreased by $2.3 million mainly due to lower capital spending on the Mountain
Tunnel Improvement Project. Hetchy Power’s operating revenues increased by $30.8 million mainly
due to increases of $19.5 million in wholesale revenue from Congestion Revenue Right credits from
California Independent System Operator and $12.2 million in billings from non-work order City
departments as a result of increased operations due to easing of COVID-19 restrictions. On the
operating expenses side, Hetchy Power reported an increase of $35.2 million mainly attributed to an
increase of $20.4 million in purchased electricity and transmission, distribution, and other power costs
attributed to volatile and higher pricing in power market and $11.0 million in general and administrative
CITY AND COUNTY OF SAN FRANCISCO
Management’s Discussion and Analysis (Unaudited) (Continued)
Year Ended June 30, 2023
17
expenses due to higher judgments and claims expenses. CleanPowerSF’s operating revenues
increased by $68.9 million mostly due to increases in electricity sales to retail and commercial
customers resulting from increased consumption. Operating expenses for CleanPowerSF increased by
$32.7 million mainly due to increases in purchased electricity and transmission, distribution, and other
power costs due to volatile and increased pricing in power market, and higher resource adequacy
capacity purchases related to compliance requirements from the California Public Utilities Commission.
The City’s Wastewater Enterprise’s net position increased by $36.2 million, compared to a $60.1 million
increase in the prior year, a $23.9 million change. Operating revenues decreased by $4.9 million
primarily due to decreases in capacity fees resulting from fewer permits issued. Operating expenses
increased by $4.2 million mainly due to expenses related to GASB 68 pension adjustment and 5.25
percent increase in cost of living adjustment. Net nonoperating activities increased by $17.8 million of
net expense principally due to $15.0 million federal and state grants received prior year for customer
utility arrearage relief and principal forgiveness of capital project improvements for the Southeast Plant.
The Port ended fiscal year 2022-23 with a net position increase of $79.6 million, $43.2 million more
than the $36.4 million increase in the previous year. In fiscal year 2022-23, operating revenues
increased by $7.7 million primarily due to increased commercial and industrial, and cruise activity.
Operating expenses increased $17.9 million over the prior year. This was primarily due to increases of
$6.4 million in personal services from increased pension expenses attributed to investment losses, and
$3.5 million of increased spending on contractual services primarily due to an increase in spending on
the Waterfront Resilience Program and Mission Rock development project.
The SFMTA had an increase in net position of $158.1 million for fiscal year 2022-23, compared to an
increase of $527.8 million in the prior year, a $369.7 million change. SFMTA’s total operating revenues
were $350.2 million, while total operating expenses reached $1.42 billion. Operating revenues
increased by $34.7 million compared to the prior year and is mainly due to increases in fare collections
of $26.8 million and parking of $8.6 million. Operating expenses increased by $363.4 million, primarily
due to an increase in personal services by $318.3 million primarily from significant increase in pension
expenses and other postemployment benefits obligations based on actuarial reports. Net nonoperating
activities decreased by $17.4 million, mainly from a $108.6 million decrease in federal grants, offset by
an increase of $55.0 million in interest and investment income and $24.7 million increase in state grants,
and $7.8 million increase in development fees. Capital contributions increased by $58.6 million.
Transfers in decreased by $82.0 million.
LHH, the City’s skilled nursing care hospital, had an increase in net position of $15.0 million at the end
of fiscal year 2022-23, compared to an increase of $61.4 million at the end of the previous year, a $46.4
million difference. The LHH’s loss before transfers for the year was $108.1 million versus a loss of
$26.3 million for the prior year. This change of $81.8 million was mostly due to a $3.7 million increase
in operating revenues, a $96.4 million increase in operating expenses, and a $10.9 million increase in
net nonoperating activities. Net transfers increased by approximately $35.4 million, due to a $24.6
million increase in transfers in and a $10.8 million decrease in transfers out.
SFGH, the City’s acute care hospital, ended fiscal year 2022-23 with a net position increase of
$114.8 million, compared to an increase of $46.8 million the prior year, a $68.0 million change.
Operating revenues increased $42.2 million from prior year, mainly due to a $37.3 million increase in
net patient service revenue. Operating expenses increased approximately $34.6 million, mainly due to
a $41.6 million increase in contractual services and $16.8 million increase in materials and supplies,
offset by a $27.0 million decrease in personal services. Net nonoperating activities increased $10.0
million, mainly due to a decrease in interest expense. Net transfers increased by approximately $50.4
million, due to a $61.7 million increase in transfers in and a $11.3 million decrease in transfers out.

CITY AND COUNTY OF SAN FRANCISCO
Management’s Discussion and Analysis (Unaudited) (Continued)
Year Ended June 30, 2023
18
FINANCIAL ANALYSIS OF THE CITY’S FUNDS
As noted earlier, the City uses fund accounting to ensure and demonstrate compliance with finance-related
legal requirements.
Governmental Funds
The focus of the City’s governmental funds statements is to provide information on near-term inflows,
outflows, and balances of resources available for future spending. Such information is useful in assessing
the City’s financing requirements. In particular, unrestricted fund balance may serve as a useful measure
of a government’s net resources available for spending at the end of the fiscal year. Types of governmental
funds reported by the City include the General Fund, Special Revenue Funds, Debt Service Funds, Capital
Project Funds, and the Permanent Fund.
At the end of fiscal year 2022-23, the City governmental funds reported combined fund balances of $6.50
billion, a decrease of $276.2 million or 4.1 percent over the prior year. Of the total fund balances, $2.02
billion is assigned and $475.6 million is unassigned. The assigned and unassigned balances of $2.49 billion
or 38.3 percent, represents the portion of the total fund balances that the City could potentially take
administrative or legislative action to change prior appropriation decisions to make them available to meet
the City’s needs. Within these fund balance classifications, the General Fund has an assigned fund balance
of $1.72 billion. The remainder of the governmental fund balances includes $1.5 million nonspendable for
items that are not expected to be converted to cash such as advances, $3.68 billion restricted for programs
at various levels and $330.0 million committed for other reserves.
The General Fund is the chief operating fund of the City. As a measure of liquidity, both the sum of assigned
and unassigned fund balances and total fund balance can be compared to total fund expenditures. As of
the end of the fiscal year, assigned and unassigned fund balances totaled $2.20 billion while total fund
balance was $2.65 billion. Combined assigned and unassigned fund balances represent 41.8 percent of
total expenditures, while total fund balance represents 50.2 percent of total expenditures. For the year, the
General Fund’s total revenues exceeded expenditures by $867.7 million, before transfers and other items
of $1.12 billion, resulting in total fund balance decreasing by $257.0 million. Overall, property tax collections
increased by $123.0 million, other local taxes grew by $205.8 million mainly driven by the new OET, and
hotel room taxes rose by $94.7 million as the economy and tourism continued to recover. Interest and
investment income rebounded from the historic low in prior year with a net increase of $161.8 million
primarily due to the significant reduction of the Pool’s unrealized loss evaluation of $158.9 million. The
Pool’s yield rate increased by 3.5 times to 2.12 percent at the end of the fiscal year as the Federal Reserve
aggressively raised interest rates to stem surging inflation. State grants revenues also increased by $34.7
million mostly for mental health programs and services. This growth was partly offset by the significant
drop in federal grants revenues of $489.2 million as prior year one time ARPA SLFRF revenues went away
and FEMA shifted focus to reimbursing other jurisdictions’ COVID response cost claims. Real property
transfer tax also fell by $334.1 million due to two once-in-a-generation high value property transfers in prior
year, coupled with reduced total number of property transfers in current year. In addition, the net transfers
out of General Fund were $71.4 million more, largely attributed to increased subsidy to the two hospitals
and baseline transfers to SFMTA.
Proprietary Funds
The City’s proprietary fund statements provide the same type of information found in the business-type
activities section of the government-wide financial statements but with some additional detail.
At the end of fiscal year 2022-23, the unrestricted net position for the proprietary funds was as follows:
Airport: $47.1 million, Water Enterprise: $115.9 million, Hetch Hetchy Water and Power: $349.1 million,
Wastewater Enterprise: $160.1 million, and Port: $204.8 million. In addition, the following funds had net
deficits in unrestricted net position: SFMTA: $354.8 million, San Francisco General Hospital: $473.2 million,
and Laguna Honda Hospital: $217.2 million.

CITY AND COUNTY OF SAN FRANCISCO
Management’s Discussion and Analysis (Unaudited) (Continued)
Year Ended June 30, 2023
19
The following table shows actual revenues, expenses and the results of operations for the current fiscal
year in the City’s proprietary funds (in thousands). This shows that the total net position for these funds
increased by approximately $489.1 million due to the current year financial activities. Reasons for this
change are discussed in the previous section on the City’s business-type activities.
General Fund Budgetary Highlights
The City’s final budget differs from the original budget in that it contains carry-forward appropriations for
various programs and projects, and supplemental appropriations approved during the fiscal year.
During the year, actual revenues and other resources were lower than the final budget by $50.3 million.
The City realized $152.3 million, $87.3 million, $66.3 million, $64.0 million, $61.3 million and $28.0 million
revenues above budget in other local taxes, property taxes, interest and investment income, hotel room
tax, state grants and subventions and utility users tax. The greater than expected local taxes were
predominately driven by the new OET with tax year 2022 as the first year of collection. The OET, generally,
imposes an additional gross receipts tax on taxable gross receipts from businesses in which the highest-
paid managerial employee, within or outside of San Francisco, earns more than 100 times the median
compensation of employees based in San Francisco. The City did not require any quarterly prepayments
in the first tax year, so the entire first year of the tax was due and paid in fiscal year 2022-23. Additionally,
two quarterly prepayments for tax year 2023 were collected in this same fiscal period. Property tax was
higher primarily due to $43.7 million larger collection on secured annual and escape property tax than
budgeted, $25.8 million excess residual property tax increment returned to the City due to obligations to
the Successor Agency of the Redevelopment Agency being less than expected, and $16.5 million more
Educational Revenue Augmentation Fund monies returned to General Fund than projected. Interest and
investment income was better than budgeted by $66.3 million as the City assumed more time lag between
interest rate increases and increases to earned income yields in the Pool because the City makes higher-
yield investment as lower-yield investment matures. The Pool’s interest rates rose 3.5 times to 2.12% at
the end of fiscal year 2022-23, as the Federal Reserve aggressively increased interest rates to stem the
surge in inflation. The $64.0 million above budget hotel tax was mainly derived from increased hotel stays
with strong growth in international tourism and continued domestic recovery. State grants and subventions
outperformed budget by $61.3 million, primarily attributed to increased statewide sales tax collection and
higher aid payments and caseload than assumed in the budget for the health and welfare realignment
segment. As the economy continued to recover, pandemic restrictions lifted and higher prices from inflation,
some taxes, including utility users, sales and use, franchise and parking, performed better than projected.
These favorable budget variances were offset by lower than budgeted revenues of $262.2 million, $204.2
million and $51.7 million in federal grants and subventions, real property transfer tax and business taxes.
The $262.2 million below budgeted federal grant revenues were predominantly due to FEMA disaster relief
reimbursements being reprioritized by FEMA to review claims of jurisdictions who have not yet received the
funding. The real property transfer tax, the most volatile revenue stream of the City, was expected to return
to the prior long-term rate-adjusted average by fiscal year 2024-25, taking prior year’s levels as a low after
Operating
Revenues
Operating
Expenses
Operating
Income
(Loss)
Non-
Operating
Revenues
(Expense)
Capital
Contributions
Interfund
Transfers,
Net
Change In
Net
Position
Airport.............................................. 1,064,104$ 902,750$ 161,354$ (197,389)$ 28,679$ (48,701)$ (56,057)$
Water............................................... 691,091 460,253 230,838 (154,882) 2,717 (20,027) 58,646
Hetch Hetchy................................... 583,477 536,343 47,134 13,161 2,535 19,968 82,798
Municipal Transportation Agency.... 350,188 1,423,618 (1,073,430) 386,506 199,145 645,927 158,148
General Hospital............................... 993,532 1,075,847 (82,315) 71,468 - 125,658 114,811
Wastewater Enterprise.................... 363,936 261,350 102,586 (69,202) 2,740 43 36,167
Port................................................... 128,667 123,152 5,515 34,755 136 39,201 79,607
Laguna Honda Hospital.................... 220,393 341,417 (121,024) 12,956 - 123,037 14,969
Total.............................................. 4,395,388$ 5,124,730$ (729,342)$ 97,373$ 235,952$ 885,106$ 489,089$
CITY AND COUNTY OF SAN FRANCISCO
Management’s Discussion and Analysis (Unaudited) (Continued)
Year Ended June 30, 2023
20
adjusting for the two once-in-a-generation transfers in fiscal year 2021-22, to reflect a multi-year recovery
in the commercial real estate sector. However, commercial transactions slowed substantially in response
to higher interest rates and uncertainty about the future value of office space. In addition, the actual impact
from the City’s tiered property transfer tax was also about $94.0 million less than anticipated. Business
taxes were $51.7 million lower than budget mostly driven by the significant increase of deferrals to pay
potential refunds related to eight new litigation matters. The rebound in charges for services, rents and
concessions and other resources was slightly slower than anticipated.
Differences between the final budget and the actual (budgetary basis) expenditures resulted in $181.8
million in expenditure savings. Highlights of the variances include:
• $40.1 million savings for community health primarily in professional services and salaries and fringe for
Health Network Services for managed care, Maternal, Child & Adolescent Health, Behavioral Health
and Public Health Administration Divisions.
• $26.1 million savings for human welfare and neighborhood development largely due to less than
budgeted expenditures for community-based organization services, salaries and fringe benefits and
services from other City departments in Human Services Agency, Homelessness and Supporting
Housing, Mayor’s Office and Children, Youth and Their Families.
• $23.2 million savings for general administration and finance, primarily in salaries and fringe and non-
personnel services. General Services Agency - Administrative Services has $5.6 million less spending
than the budgeted for general administration, 311 Customer Services Center, Labor Standards,
Procurement, Animal Care and Control, and other divisions. This is followed by Treasurer/Tax
Collector, Planning and Elections, each with a saving of about $3.0 million, respectively.
• $17.9 million savings for public protection departments for salaries and fringe benefits and non-
personnel services.
• Remaining savings for general city responsibilities, public works, transportation and commerce and
culture and recreation departments are largely due to lower than budgeted salaries, fringe and
overhead, capital outlay and services provided by other departments. The City also has a $46.5 million
budgetary reserve and designation for self-insurance funds.
These changes in operating revenues and expenditures, as well as appropriations of reserves, resulted in
a net available budgetary fund balance of $852.2 million at the end of fiscal year 2022-23. Within
unassigned fund balances, the City’s fiscal year 2023-24 and 2024-25 Adopted Original Budget assumed
$291.7 million as a source in fiscal year 2024-25 and $499.3 million designated for various purposes,
leaving $3.1 million available for future appropriations (see also Note to the Required Supplementary
Information for additional budgetary fund balance details). The Adopted 2023-24 and 2024-25 Budget spent
$193.5 million of reserves, including $41.3 million of Federal and State Emergency Grant Disallowance
Reserve, $21.2 million of Public Health revenue anticipated and spent in FY 2023-24 but received in FY
2022-23, and the remaining balances of a number of other reserves: $90.2 million Fiscal Cliff Reserve, and
$29.4 million Business Tax Stabilization Reserve, and $11.4 million in other reserves.

CITY AND COUNTY OF SAN FRANCISCO
Management’s Discussion and Analysis (Unaudited) (Continued)
Year Ended June 30, 2023
21
Capital Assets
The City’s capital assets for its governmental and business-type activities as of June 30, 2023, increased
by $1.10 billion, 3.5 percent, to $32.95 billion (net of accumulated depreciation). Capital assets include land,
buildings and improvements, machinery and equipment, park facilities, roads, streets, bridges, and
intangible assets. Governmental activities contributed $216.4 million or 19.6 percent to this total while
$888.0 million or 80.4 percent was from business-type activities. Details are shown in the table below.
* See Note 17 to the basic financial statements. Fiscal year 2021-22 balances were not restated for GASB Statement Nos. 94
and 96.
Major capital asset events during the current fiscal year included the following:
Under governmental activities, net capital assets increased by $216.4 million or 2.9 percent. About
$248.5 million worth of construction in progress work was substantially completed and capitalized as
facilities and improvements and infrastructure. The completed projects include about $88.2 million in
the 333 12
th
street building for homeless residents project, $41.3 million for Southeast Family Health
Center, $13.9 million in the Castro Mission Health Center renovation, $9.6 million for Van Ness Bus
Rapid Transit street paving project, $6.1 million in Geary Street facility for public health crisis
stabilization unit, $5.8 million in Mission Street permanent supportive housing development to house
families exiting homelessness, and $4.8 million for County Jail #2 kitchen complex renovation. The
remaining completed projects are mainly public works. Right-to-use assets increased by $9.9 million
which included $33.6 million additions from the GASB Statement No. 96 implementation. The increases
were offset by the $23.7 million decrease in lease assets primarily caused by lease termination.
Under business-type activities, net capital assets included right-to-use assets which arose from GASB
Statement Nos. 87 and 96 and declined by $5.7 million or 2.5 percent. The decreases were mainly
due to $8.7 million lease assets amortization, offset by $3.0 million GASB Statement 96 implementation
additions. Additional business-type activities are discussed below.
The Water Enterprise’s net capital assets increased by $30.7 million or 0.5 percent, reflecting an
increase in construction and capital improvement activities. Major additions to construction work in
progress included Mountain Tunnel Improvements, San Francisco Westside Recycled Water Project,
and New Water Utility Service Facilities. Facilities, improvements, machinery, and equipment
decreased by $51.1 million mainly due to depreciation and amortization. As of June 30, 2023, Water
Enterprise’s Water System Improvement Program was 99.0 percent completed with $4.8 billion of
project appropriations expended. The program consists of 35 local projects located within San
Francisco and 52 regional projects spread over seven different counties from the Sierra Foothills to
San Francisco. As of June 30, 2023, 35 local projects were completed. For regional projects, 48 projects
are completed and for the remaining 4 projects the expected completion date is February 2027.
SFMTA’s net capital assets increased by $204.6 million or 3.6 percent mainly from procurement of new
revenue vehicles and from the Central Subway Project construction in progress offset by decrease in
total leases and subscription IT assets. Equipment cost included light rail vehicles and motor buses
2023 2022* 2023 2022* 2023 2022*
Land...................................... 936,793$ 774,213$ 360,765$ 353,558$ 1,297,558$ 1,127,771$
Construction in progress......... 616,327 586,526 4,864,424 5,821,916 5,480,751 6,408,442
Facilities and improvements.... 4,401,005 4,400,210 14,474,718 14,582,595 18,875,723 18,982,805
Machinery and equipment....... 136,864 146,321 1,905,717 1,949,387 2,042,581 2,095,708
Infrastructure.......................... 1,101,023 1,079,859 3,273,550 1,275,202 4,374,573 2,355,061
Right-to-use assets*............... 512,708 502,781 222,777 228,503 735,485 731,284
Intangible assets.................... 98,909 97,352 44,291 47,127 143,200 144,479
Total……………………… 7,803,629$ 7,587,262$ 25,146,242$ 24,258,288$ 32,949,871$ 31,845,550$
Business-type
Governmental Activities Activities Total
CITY AND COUNTY OF SAN FRANCISCO
Management’s Discussion and Analysis (Unaudited) (Continued)
Year Ended June 30, 2023
22
procurement, Central Control System upgrades, and parking meters replacement. Infrastructure costs
incurred during the fiscal year were primarily for Central Subway Project, Muni Forward Program, traffic
signs installation and calming, street improvements, and traffic signal upgrade.
The Wastewater Enterprise net capital assets reported an increase of $638.2 million or 15.8 percent
reflecting an increase in construction and capital improvement activities. The Sewer System
Improvement Program (SSIP) includes three phases over 20 years to improve the existing wastewater
system. As of June 30, 2023, 43 projects were completed, 7 projects in pre-construction phase, 11
projects in construction phase, and 9 projects in close-out phase. The Westside Pump Station Reliability
Improvements is on-going construction.
Hetch Hetchy’s net capital assets increased by $80.1 million or 10.2 percent to $867.3 million primarily
from construction and capital improvement activities, and additions of facilities, improvements,
machinery, and equipment for the Moccasin Powerhouse Rewind Project and the Mountain Tunnel
Improvement Project.
The Airport’s net capital assets decreased by $42.6 million or 0.6 percent primarily due to the disposal
of assets. Due to the COVID-19 pandemic and the reduction in travel demand, the Airport has
reprioritized its Capital Improvement Plan to focus on projects that are essential to Airport operations
and resiliency priorities given the present-day recovery landscape. Construction activity continues on
major projects such as the Terminal 1 (T1) Redevelopment Program, the Courtyard 3 Connector
project, and the International Terminal Phase 2 project, which will make improvements to the building
and expand both departures level security checkpoints. The T1 Redevelopment Program completed
the Harvey Milk Boarding Area B, for a total of 22 operational gates, in May 2021. Construction activity
continues in the Terminal 1 North area, and this work is forecasted to complete in fiscal year 2023-24.
Notable projects that were completed in fiscal year 2022-23 included the completion of the Noise
Insulation Program 2019-2023 Phase and the 12KV Cable Replacement and System Upgrade.
At the end of the year, the City’s business-type activities had approximately $1.51 billion in commitments
for various capital projects. Of this, Water Enterprise had an estimated $187.9 million, SFMTA
had $353.0 million, Wastewater had $750.1 million, Airport had $40.6 million, Hetch Hetchy had $99.5
million, Port had $12.4 million, Laguna Honda Hospital had $52.5 million, and the General Hospital had
$13.4 million.
For government-wide financial statement presentation, all depreciable/amortizable capital assets were
depreciated/amortized from acquisition date or lease/subscription inception date to the end of the current
fiscal year. Governmental fund financial statements record capital asset purchases as expenditure.
Additional information about the City’s capital assets can be found in Note 7 to the Basic Financial
Statements.

CITY AND COUNTY OF SAN FRANCISCO
Management’s Discussion and Analysis (Unaudited) (Continued)
Year Ended June 30, 2023
23
Debt Administration
At June 30, 2023, the City had total long-term and commercial paper debt outstanding of $24.66 billion. Of
this amount, $2.84 billion which includes $253.5 million of bond premium represents general obligation
bonds secured by ad valorem property taxes without limitation as to rate or amount upon all property subject
to taxation by the City. The remaining $21.82 billion represents revenue bonds, commercial paper notes,
certificates of participation, leases and other debts of the City secured solely by specified revenue sources.
As noted previously, the City’s total debt including all bonds, loans, commercial paper notes, leases and
other debts increased by $880.0 million or 3.7 percent during the fiscal year.
For the year ended June 30, 2023, the net decrease in the long-term debt in the governmental activities
was $123.9 million and the net increase in business-type activities was $1.70 billion as discussed in the
highlights above.
The City’s Charter imposes a limit on the amount of general obligation bonds the City can have outstanding
at any given time. That limit is three percent of the assessed value of taxable property in the City - estimated
at $332.02 billion in value as of the close of the fiscal year. As of June 30, 2023, the City had $2.84 billion
in authorized, outstanding general obligation bonds, which is equal to approximately 0.80 percent of gross
(0.86 percent of net) taxable assessed value of property. As of June 30, 2023, there were an additional
$1.26 billion in bonds that were authorized but unissued. If all these general obligation bonds were issued
and outstanding in full, the total debt burden would be approximately 1.16 percent of gross (1.23 percent
of net) taxable assessed value of property.
The City’s underlying ratings on general obligation bonds as of June 30, 2023, were:
S&P Global Ratings AAA
Moody’s Investors Service, Inc. Aaa
Fitch Ratings AA+
During the fiscal year, S&P Global Ratings (S&P), Moody’s Investors Service (Moody’s) and Fitch Ratings
maintained the City’s general obligation bonds ratings of “AAA”, “Aaa”, and “AA+”, respectively, with a
stable rating outlook on all the City’s outstanding general obligation bonds.
The City’s business-type activities carried underlying debt ratings for the SFMTA of “A+” from S&P and
“Aa3” from Moody’s. Moody’s and Fitch Ratings affirmed their underlying credit ratings on the outstanding
debt of the Airport of “A1” and “A+”, respectively. S&P raised its underlying long-term credit ratings on the
outstanding debt of the Airport to “A+”. The Water Enterprise carried underlying ratings of “Aa2” and “AA-”
from Moody’s and S&P, respectively. The Wastewater Enterprise carried underlying ratings of “Aa2” and
“AA” from Moody’s and S&P, respectively. The Hetch Hetchy Power Enterprise’s power revenue bonds
have been rated “AA-” by Fitch Ratings and “AA” by S&P as of June 30, 2023. In March 2023, S&P affirmed
its “A” rating on Port’s outstanding revenue bonds and revised its outlook from negative to stable. In April
2023, Fitch affirmed its “A” rating and stable outlook. In May 2023, Moody’s affirmed its “Aa3” rating and
revised its outlook from negative to stable on Port’s outstanding revenue bonds.
Additional information in the City's long-term debt can be found in Note 8 to the basic financial statements.

CITY AND COUNTY OF SAN FRANCISCO
Management’s Discussion and Analysis (Unaudited) (Continued)
Year Ended June 30, 2023
24
Economic factors and future budgets and rates
Recent trends in economic indicators paint an overall picture of slowing growth. Local job losses reversed
between August and October, with a net growth of 3,300 jobs over the two months. Gains were led by the
education, health and government sectors, while the tech-heavy information and professional service
sectors continued to shed jobs.
Despite the uptick in employment, the unemployment rate stayed flat at 3.4 percent over the two months.
The Kastle return-to-office indicator was also flat from September through mid-November. Other indicators
of downtown recovery, including BART and MUNI metro ridership, showed slight declines, as did bridge
crossings.
Travel through San Francisco International Airport has nearly recovered to pre-pandemic levels, with both
domestic and international travel above 95 percent of normal. City hotel revenues, however, were still
pegged at 70 percent of normal in October.
While housing permits spiked in October, apartment asking rents are trending down, and local housing
prices are not yet participating in the statewide housing recovery.
The FY 2023-24 and FY 2024-25 budget was balanced with a heavy reliance on one-time solutions, leaving
the City with an ongoing structural deficit. To begin addressing the anticipated shortfall, the Mayor’s Office
issued General Fund mid-year target cuts of 3 percent to City departments in October 2023. Additional cut
targets of 10 percent, plus a 5 percent contingency, were issued in December 2023, for the FY 2024-25
and FY 2025-26 budget years.
CITY AND COUNTY OF SAN FRANCISCO
Management’s Discussion and Analysis (Unaudited) (Continued)
Year Ended June 30, 2023
25
REQUESTS FOR INFORMATION
This financial report is designed to provide our citizens, taxpayers, customers, and investors and creditors
with a general overview of the City’s finances and to demonstrate the City’s accountability for the money it
receives. Below are the contacts for questions about this report or requests for additional financial
information.
City and County of San Francisco
Office of the Controller
1 Dr. Carlton B. Goodlett Place, Room 316
San Francisco, CA 94102-4694
Department and Component Unit Financial Statements
San Francisco International Airport
Office of the Airport Deputy Director
Business and Finance Division
PO Box 8097
San Francisco, CA 94128
Port of San Francisco
Public Information Officer
Pier 1, The Embarcadero
San Francisco, CA 94111
San Francisco Water Enterprise
Hetch Hetchy Water and Power
San Francisco Wastewater Enterprise
Chief Financial Officer
525 Golden Gate Avenue, 13
th
Floor
San Francisco, CA 94102
Laguna Honda Hospital
Chief Financial Officer
375 Laguna Honda Blvd.
San Francisco, CA 94116
Municipal Transportation Agency
SFMTA Chief Financial Officer
1 South Van Ness Avenue, 7
th
Floor
San Francisco, CA 94103
Health Service System
Chief Financial Officer
1145 Market Street, Suite 300
San Francisco, CA 94103
Zuckerberg San Francisco
General Hospital and Trauma Center
Chief Financial Officer
1001 Potrero Avenue, Suite 2A5
San Francisco, CA 94110
Successor Agency to the
San Francisco Redevelopment Agency
1 South Van Ness Avenue, 5
th
Floor
San Francisco, CA 94103
San Francisco
Employees’ Retirement System
Executive Director
1145 Market Street, 5
th
Floor
San Francisco, CA 94103
Retiree Health Care Trust
c/o Employees’ Retirement System
1145 Market Street, 5
th
Floor
San Francisco, CA 94103
San Francisco County Transportation Authority
Deputy Director for Administration and Finance
1455 Market Street, 22
nd
Floor
San Francisco, CA 94103
San Francisco Finance Corporation
Office of Public Finance
City Hall, Room 338
1 Dr. Carlton B. Goodlett Place
San Francisco, CA 94102
WWW.SF.GOV

CITY AND COUNTY OF SAN FRANCISCO
Statement of Net Position
Year Ended June 30, 2023
(In Thousands)
The notes to the financial statements are an integral part of this statement.
26
Primary Government Component Unit
Governmental
Activities
Business-Type
Activities
Total
Treasure Island
Development
Authority
ASSETS
Current assets:
Deposits and investments with City Treasury.................... 7,927,961$ 3,456,847$ 11,384,808$ -$
Deposits and investments outside City Treasury............... 247,270 33,012 280,282 -
Receivables (net of allowance for uncollectible amounts
of $434,559 for the primary government):
Property taxes and penalties............................................. 190,786 - 190,786 -
Other local taxes............................................................... 387,442 - 387,442 -
Federal and state grants and subventions........................ 450,784 164,406 615,190 3,431
Charges for services......................................................... 152,089 361,557 513,646 3,657
Interest and other.............................................................. 86,220 217,822 304,042 17
Leases............................................................................... 4,678 168,141 172,819 2,365
Due from component units.................................................. 13,096 372 13,468 -
Inventories........................................................................... 14,604 117,096 131,700 -
Due from primary government............................................ - - - 38
Other assets........................................................................ 24,253 13,228 37,481 4,206
Restricted assets:
Deposits and investments with City Treasury.................. - 737,613 737,613 -
Deposits and investments outside City Treasury............. 6,449 181,969 188,418 -
Grants and other receivables............................................ - 113,587 113,587 -
Total current assets...................................................... 9,505,632 5,565,650 15,071,282 13,714
Noncurrent assets:
Loan receivables (net of allowance for uncollectible
amounts of $2,445,643).................................................... 216,166 - 216,166 -
Leases receivable............................................................... 83,909 1,426,181 1,510,090 16,588
Advance to component unit................................................. - 6,805 6,805 -
Other assets........................................................................ 101 43,914 44,015 -
Net pension asset................................................................ 17,362 - 17,362 -
Restricted assets:
Deposits and investments with City Treasury.................. - 929,063 929,063 -
Deposits and investments outside City Treasury............. - 706,595 706,595 -
Grants and other receivables............................................ - 17,275 17,275 -
Capital assets:
Land and other assets not being depreciated/amortized. 1,554,026 5,237,232 6,791,258 34,846
Facilities, infrastructure and equipment, net of
depreciation/amortization................................................ 6,249,603 19,909,010 26,158,613 23,180
Total capital assets....................................................... 7,803,629 25,146,242 32,949,871 58,026
Total noncurrent assets................................................ 8,121,167 28,276,075 36,397,242 74,614
Total assets........................................................................... 17,626,799 33,841,725 51,468,524 88,328
DEFERRED OUTFLOWS OF RESOURCES
Unamortized loss on refunding of debt............................... 5,965 156,111 162,076 -
Pensions.............................................................................. 1,114,295 703,972 1,818,267 16
OPEB.................................................................................. 351,395 334,069 685,464 -
Total deferred outflows of resources..................................... 1,471,655$ 1,194,152$ 2,665,807$ 16$

CITY AND COUNTY OF SAN FRANCISCO
Statement of Net Position (Continued)
Year Ended June 30, 2023
(In Thousands)
The notes to the financial statements are an integral part of this statement.
27
Primary Government Component Unit
Governmental
Activities
Business-Type
Activities
Total
Treasure Island
Development
Authority
LIABILITIES
Current liabilities:
Accounts payable................................................................ 680,111$ 308,135$ 988,246$ 2,085$
Accrued payroll.................................................................... 203,580 146,686 350,266 154
Accrued vacation and sick leave pay.................................. 128,356 89,830 218,186 -
Accrued workers' compensation......................................... 72,304 50,502 122,806 -
Estimated claims payable................................................... 155,464 46,288 201,752 -
Bonds, loans, leases, and other payables.......................... 369,811 285,803 655,614 -
Accrued interest payable..................................................... 23,352 72,037 95,389 -
Unearned grant and subvention revenues.......................... 208,649 - 208,649 -
Due to primary government................................................. - - - 9,846
Due to component unit........................................................ 38 - 38 -
Internal balances................................................................. 74,069 (74,069) - -
Unearned revenues and other liabilities.............................. 1,271,146 941,502 2,212,648 2,497
Liabilities payable from restricted assets:
Bonds, loans, leases, and other payables........................ - 20,075 20,075 -
Accrued interest payable................................................... - 64,062 64,062 -
Other................................................................................. - 336,597 336,597 -
Total current liabilities................................................... 3,186,880 2,287,448 5,474,328 14,582
Noncurrent liabilities:
Accrued vacation and sick leave pay.................................. 117,886 75,556 193,442 -
Accrued workers' compensation......................................... 305,486 225,544 531,030 -
Estimated claims payable................................................... 260,222 74,073 334,295 -
Bonds, loans, leases, and other payables.......................... 4,718,093 19,263,656 23,981,749 -
Advance from primary government..................................... - - - 6,805
Unearned revenues and other liabilities.............................. - 144,980 144,980 -
Net pension liability.............................................................. 1,954,150 1,113,763 3,067,913 11
Net other postemployment benefits (OPEB) liability........... 2,057,177 1,677,814 3,734,991 -
Total noncurrent liabilities............................................. 9,413,014 22,575,386 31,988,400 6,816
Total liabilities......................................................................... 12,599,894 24,862,834 37,462,728 21,398
DEFERRED INFLOWS OF RESOURCES
Unamortized gain on refunding of debt............................... 79,536 12,387 91,923 -
Pensions.............................................................................. 401,406 251,941 653,347 3
OPEB.................................................................................. 402,124 343,577 745,701 -
Leases................................................................................. 87,017 1,686,489 1,773,506 18,570
Public-private partnerships.................................................. 5,931 - 5,931 -
Total deferred inflows of resources....................................... 976,014 2,294,394 3,270,408 18,573
NET POSITION
Net investment in capital assets, Note 10(d)......................... 4,491,155 6,851,218 10,935,272 58,026
Restricted for:
Reserve for rainy day.......................................................... 114,539 - 114,539 -
Debt service........................................................................ 156,851 171,232 328,083 -
Capital projects, Note 10(d)................................................. 319,105 1,014,138 1,208,105 -
Community development.................................................... 998,679 - 998,679 -
Transportation Authority activities....................................... 72,024 - 72,024 -
Building inspection programs.............................................. 74,418 - 74,418 -
Children and families........................................................... 669,822 - 669,822 -
Culture and recreation......................................................... 297,396 - 297,396 -
Grants.................................................................................. 174,758 - 174,758 -
Other purposes................................................................... 184,465 10,174 194,639 -
Total restricted................................................................ 3,062,057 1,195,544 4,132,463 -
Unrestricted (deficit), Note 10(d)........................................... (2,030,666) (168,113) (1,666,540) (9,653)
Total net position.................................................................... 5,522,546$ 7,878,649$ 13,401,195$ 48,373$

CITY AND COUNTY OF SAN FRANCISCO
Statement of Activities
Year Ended June 30, 2023
(In Thousands)
The notes to the financial statements are an integral part of this statement.
28
Net (Expense) Revenue and Changes in Net Position
Program Revenues Primary Government Component Unit
Functions/Programs Expenses
Charges for
Services
Operating
Grants and
Contributions
Capital Grants
and
Contributions
Governmental
Activities
Business-Type
Activities
Total
Treasure Island
Development
Authority
Primary government:
Governmental activities:
Public protection................................ 1,671,702$ 103,361$ 228,498$ 142$ (1,339,701)$ -$ (1,339,701)$ -$
Public works, transportation
and commerce................................ 446,286 133,565 40,431 49,160 (223,130) - (223,130) -
Human welfare and
neighborhood development............. 2,883,425 170,535 1,038,243 70,845 (1,603,802) - (1,603,802) -
Community health............................. 1,206,314 91,056 439,738 4,737 (670,783) - (670,783) -
Culture and recreation....................... 537,393 135,998 600 25,607 (375,188) - (375,188) -
General administration and
finance............................................. 482,618 188,245 8,941 134 (285,298) - (285,298) -
Distributions to other
governments................................... 49,113 - - - (49,113) - (49,113) -
General city responsibilities............... 175,522 66,925 6,358 - (102,239) - (102,239) -
Unallocated interest on long-
term debt and cost of issuance...... 155,749 - - - (155,749) - (155,749) -
Total governmental
activities...................................... 7,608,122 889,685 1,762,809 150,625 (4,805,003) - (4,805,003) -
Business-type activities:
Airport................................................ 1,278,517 1,064,104 - 28,679 - (185,734) (185,734) -
Transportation................................... 1,439,742 350,188 350,111 199,145 - (540,298) (540,298) -
Port.................................................... 127,817 128,667 22,024 136 - 23,010 23,010 -
Water................................................. 666,970 691,091 - 2,717 - 26,838 26,838 -
Power................................................ 544,742 583,477 3,737 2,535 - 45,007 45,007 -
Hospitals............................................ 1,419,409 1,213,925 67,985 - - (137,499) (137,499) -
Sewer................................................ 343,018 363,936 152 2,740 - 23,810 23,810 -
Total business-type
activities...................................... 5,820,215 4,395,388 444,009 235,952 - (744,866) (744,866) -
Total primary government...................... 13,428,337$ 5,285,073$ 2,206,818$ 386,577$ (4,805,003) (744,866) (5,549,869) -
Component unit:
Treasure Island Development
Authority............................................. 21,532$ 12,430$ 896$ -$ (8,206)$
3,167,382 - 3,167,382 -
1,290,918 - 1,290,918 -
309,385 - 309,385 -
278,961 - 278,961 -
110,661 - 110,661 -
82,716 - 82,716 -
186,247 - 186,247 -
295,790 - 295,790 -
157,267 108,704 265,971 109
99,471 240,145 339,616 9,403
(885,106) 885,106 - -
5,093,692 1,233,955 6,327,647 9,512
288,689 489,089 777,778 1,306
5,331,019 7,496,160 12,827,179 47,067
(97,162) (106,600) (203,762) -
5,233,857 7,389,560 12,623,417 47,067
5,522,546$ 7,878,649$ 13,401,195$ 48,373$
Total general revenues and transfers...............................................................
Net position at end of year..........................................................................................
Hotel room tax........................................................................................................
Utility users tax.......................................................................................................
Other local taxes....................................................................................................
Interest and investment income...............................................................................
Change in net position.......................................................................................
Other........................................................................................................................
Transfers - internal activities of primary government................................................
Net position at beginning of year, as previously reported..........................................
Parking tax.............................................................................................................
Real property transfer tax......................................................................................
Cumulative effect of accounting change....................................................................
Net position at beginning of year, as restated............................................................
Business taxes......................................................................................................
Sales and use tax..................................................................................................
General Revenues
Taxes:
Property taxes........................................................................................................

CITY AND COUNTY OF SAN FRANCISCO
Balance Sheet
Governmental Funds
June 30, 2023
(In Thousands)
The notes to the financial statements are an integral part of this statement.
29
General Fund
Other
Governmental
Funds
Total
Governmental
Funds
Assets:
Deposits and investments with City Treasury........................ 3,709,353$ 4,153,137$ 7,862,490$
Deposits and investments outside City Treasury................... 263 247,007 247,270
Receivables (net of allowance for uncollectible
amounts of $366,442):
Property taxes and penalties................................................ 182,148 8,638 190,786
Other local taxes................................................................... 277,384 110,058 387,442
Federal and state grants and subventions........................... 244,642 206,142 450,784
Charges for services............................................................ 130,109 21,761 151,870
Interest and other.................................................................. 56,090 29,714 85,804
Leases.................................................................................. 81,413 - 81,413
Due from other funds.............................................................. 7,309 15,219 22,528
Due from component units..................................................... 3,603 9,493 13,096
Loans receivable (net of allowance for uncollectible
amounts of $2,445,643 in 2023) 10,705 205,461 216,166
Inventories............................................................................... 14,604 - 14,604
Other assets........................................................................... 7,805 16,448 24,253
Total assets.................................................................... 4,725,428$ 5,023,078$ 9,748,506$
Liabilities:
Accounts payable.................................................................... 417,250$ 252,267$ 669,517$
Accrued payroll........................................................................ 165,431 34,468 199,899
Unearned grant and subvention revenues.............................. 33,593 175,056 208,649
Due to other funds................................................................... 210 96,387 96,597
Due to component units.......................................................... - 38 38
Unearned revenues and other liabilities.................................. 1,028,387 239,644 1,268,031
Bonds, loans, leases, and other payables.............................. - 38,790 38,790
Total liabilities................................................................. 1,644,871 836,650 2,481,521
Deferred inflows of resources................................................... 432,420 331,103 763,523
Fund balances:
Nonspendable......................................................................... 1,174 356 1,530
Restricted................................................................................ 114,539 3,565,843 3,680,382
Committed............................................................................... 330,010 - 330,010
Assigned.................................................................................. 1,724,903 291,062 2,015,965
Unassigned............................................................................. 477,511 (1,936) 475,575
Total fund balances........................................................ 2,648,137 3,855,325 6,503,462
Total liabilities, deferred inflows of resources
and fund balances........................................................ 4,725,428$ 5,023,078$ 9,748,506$

CITY AND COUNTY OF SAN FRANCISCO
Reconciliation of the Governmental Funds Balance Sheet
to the Statement of Net Position
June 30, 2023
(In Thousands)
The notes to the financial statements are an integral part of this statement.
30
Fund balances – total governmental funds
6,503,462$
Amounts reported for governmental activities in the statement of net position are different because:
Capital assets used in governmental activities are not financial resources and, therefore, are not
reported in the funds.
7,770,546
Long-term liabilities, including bonds payable, are not due and payable in the current period and
therefore are not reported in the governmental funds.
(5,972,094)
Other long-term assets are not available to pay for current-period expenditures and, therefore, are
deferred inflows of resources and are recognized as revenues in the period the amounts become
available in the governmental funds.
677,676
Interest on long-term debt is not accrued in the funds, but rather is recognized as an expenditure when
due.
(22,446)
Deferred outflows and inflows of resources in governmental activities related to refunding of debt are
not financial resources and, therefore, are not reported in the governmental funds.
(73,971)
Net pension asset/liability and pension related deferred outflows and inflows of resources are not due in
the current period and therefore are not reported in the governmental funds.
(1,209,646)
Net OPEB asset/liability and OPEB related deferred outflows and inflows of resources are not due in
the current period and therefore are not reported in the governmental funds.
(2,064,500)
Internal service funds are used by management to charge the costs of lease financing, equipment
maintenance services, printing and mailing services, and telecommunications and information systems
to individual funds. The assets and liabilities of internal service funds are included in governmental
activities in the statement of net position.
(86,481)
Net position of governmental activities
5,522,546$

CITY AND COUNTY OF SAN FRANCISCO
Statement of Revenues, Expenditures, and Changes in Fund Balances
Governmental Funds
Year Ended June 30, 2023
(In Thousands)
The notes to the financial statements are an integral part of this statement.
31
General Fund
Other
Governmental
Funds
Total
Governmental
Funds
Revenues:
Property taxes.................................................................. 2,459,052$ 697,986$ 3,157,038$
Business taxes................................................................. 850,593 440,325 1,290,918
Sales and use tax............................................................. 197,911 111,474 309,385
Hotel room tax.................................................................. 252,898 26,063 278,961
Utility users tax................................................................. 110,661 - 110,661
Parking tax........................................................................ 82,716 - 82,716
Real property transfer tax................................................. 186,247 - 186,247
Other local taxes.............................................................. 278,112 17,678 295,790
Licenses, permits and franchises.................................... 28,953 14,203 43,156
Fines, forfeitures, and penalties....................................... 3,191 41,131 44,322
Interest and investment income....................................... 68,319 88,568 156,887
Rents and concessions................................................... 11,775 172,433 184,208
Intergovernmental:
Federal........................................................................... 306,673 329,007 635,680
State............................................................................... 1,031,456 262,448 1,293,904
Other.............................................................................. 1,582 7,356 8,938
Charges for services........................................................ 243,234 144,319 387,553
Other................................................................................ 29,677 177,669 207,346
Total revenues......................................................... 6,143,050 2,530,660 8,673,710
Expenditures:
Current:
Public protection............................................................ 1,654,953 94,234 1,749,187
Public works, transportation and commerce................. 265,019 240,402 505,421
Human welfare and neighborhood development........... 1,577,163 1,421,283 2,998,446
Community health.......................................................... 967,381 201,222 1,168,603
Culture and recreation................................................... 172,832 340,295 513,127
General administration and finance............................... 301,748 138,019 439,767
General City responsibilities.......................................... 189,570 - 189,570
Distributions to other governments................................ - 49,113 49,113
Debt service:
Principal retirement........................................................ 66,707 334,253 400,960
Interest and other fiscal charges................................... 7,970 173,493 181,463
Bond issuance costs..................................................... - 5,747 5,747
Capital outlay.................................................................... 72,033 148,884 220,917
Total expenditures................................................... 5,275,376 3,146,945 8,422,321
Excess (deficiency) of revenues over
(under) expenditures….......................................
867,674 (616,285) 251,389
Other financing sources (uses):
Transfers in...................................................................... 119,361 582,869 702,230
Transfers out.................................................................... (1,316,074) (271,483) (1,587,557)
Issuance of bonds:
Face value of bonds issued........................................... - 267,975 267,975
Premium on issuance of bonds..................................... - 6,364 6,364
Inception of leases and subscriptions.............................. 72,033 - 72,033
Total other financing sources (uses)...................... (1,124,680) 585,725 (538,955)
Net changes in fund balances................................. (257,006) (30,560) (287,566)
Fund balances at beginning of year,
as previously reported...................................................... 2,905,143 3,874,527 6,779,670
Cumulative effect of accounting change............................ - 11,358 11,358
Fund balances at beginning of year, as restated............... 2,905,143 3,885,885 6,791,028
Fund balances at end of year............................................. 2,648,137$ 3,855,325$ 6,503,462$

CITY AND COUNTY OF SAN FRANCISCO
Reconciliation of the Statement of Revenues, Expenditures, and Changes in
Fund Balances of Governmental Funds to the Statement of Activities
Year Ended June 30, 2023
(In Thousands)
The notes to the financial statements are an integral part of this statement.
32
Net changes in fund balances - total governmental funds
(287,566)$
Amounts reported for governmental activities in the statement of activities are different because:
Governmental funds report capital outlays as expenditures. However, in the statement of
activities the cost of those assets is allocated over their estimated useful lives and reported as
depreciation expense. This is the amount by which capital outlays exceeded depreciation, the
loss on disposal of capital assets, and contributed capital assets.
194,830
Some expenses reported in the statement of activities do not require the use of current
financial resources and therefore are not reported as expenditures in governmental funds.
Certain long-term liabilities reported in the prior year statement of net position were paid during
the current period resulting in expenditures in the governmental funds. This is the amount by
which the increase in long-term liabilities exceeded expenditures in funds that do not require
the use of current financial resources.
532,057
Property taxes are recognized as revenues in the period the amounts become available. This
is the current period amount by which the deferred inflows of resources increased in the
governmental funds.
10,344
Other revenues that were unavailable are reported as deferred inflows of resources in the
governmental funds. This is the current period amount by which deferred inflows of resources
increased in the governmental funds.
57,151
Governmental funds report revenues and expenditures primarily pertaining to long-term loan
activities, which are not reported in the statement of activities. These activities are reported at
the government-wide level in the statement of net position. This is the net revenues reported in
the governmental funds.
14
Changes to net pension asset/liability and pension related deferred outflows and inflows of
resources do not require the use of current financial resources and therefore are not reported
as expenditures in governmental funds.
(340,404)
Changes to net OPEB asset/liability and OPEB related deferred outflows and inflows of
resources do not require the use of current financial resources and therefore are not reported
as expenditures in governmental funds.
4,930
The issuance of long-term debt provides current financial resources to governmental funds,
while the repayment of the principal of long-term debt, leases and subscriptions consume the
current financial resources of governmental funds. These transactions, however, have no
effect on net position. This is the amount by which principal retirement exceeded bond, lease
and subscription proceeds in the current period.
60,952
Bond premiums are reported in the governmental funds when the bonds are issued, and are
capitalized and amortized in the statement of net position. This is the amount of bond
premiums capitalized during the current period.
(6,364)
Interest expense in the statement of activities differs from the amount reported in the
governmental funds because of additional accrued and accreted interest; amortization of bond
premiums and refunding losses and gains.
34,259
The activities of internal service funds are reported with governmental activities.
28,486
Change in net position of governmental activities
288,689$

CITY AND COUNTY OF SAN FRANCISCO
Statement of Net Position - Proprietary Funds
June 30, 2023
(In Thousands)
The notes to the financial statements are an integral part of this statement.
33
Business-Type Activities - Enterprise Funds
Major Funds
ASSETS
Current assets:
Deposits and investments with City Treasury............ 998,115$ 402,885$ 399,864$ 722,409$ 240,856$ 355,770$ 336,948$ -$ 3,456,847$ 65,471$
Deposits and investments outside City Treasury....... 23,773 192 154 8,708 7 173 5 - 33,012 -
Receivables (net of allowance for
uncollectible amounts of $68,117):
Federal and state grants and subventions............... - - 2,369 101,278 1,879 - 450 58,430 164,406 -
Charges for services................................................ 67,438 69,514 54,307 4,727 82,249 40,093 18,168 25,061 361,557 219
Interest and other...................................................... 11,204 9,441 2,357 9,039 171,502 2,178 11,415 686 217,822 416
Leases...................................................................... 114,523 3,521 - 7,437 375 212 41,963 110 168,141 15,120
Due from other funds.................................................. - 115 4,309 77,100 17 128 - - 81,669 -
Due from component unit........................................... - - 372 - - - - - 372 -
Inventories................................................................... 3,232 8,191 1,840 84,716 12,328 3,340 1,875 1,574 117,096 -
Other assets............................................................... 4,862 - 7,312 308 - 570 176 - 13,228 -
Restricted assets:
Deposits and investments with City Treasury.......... 575,751 - - 802 - - 58,686 102,374 737,613 -
Deposits and investments outside City Treasury..... 111,574 10,863 5,371 17 - 48,717 5,402 25 181,969 6,449
Grants and other receivables.................................... 54,646 39,657 4,151 - - 15,133 - - 113,587 -
Total current assets............................................. 1,965,118 544,379 482,406 1,016,541 509,213 466,314 475,088 188,260 5,647,319 87,675
Noncurrent assets:
Other assets............................................................... - 19,103 21,105 - - 1,457 2,249 - 43,914 -
Leases receivable....................................................... 831,198 40,109 - 82,081 7,426 1,245 463,121 1,001 1,426,181 75,347
Advance to component unit......................................... - - 6,805 - - - - - 6,805 -
Restricted assets:
Deposits and investments with City Treasury.......... 545,745 21,000 28,586 295,158 - 38,574 - - 929,063 -
Deposits and investments outside City Treasury..... 565,059 66,482 3,840 4,555 220 66,439 - - 706,595 -
Grants and other receivables.................................... 2,650 4 - 1,957 - 417 - 12,247 17,275 -
Capital assets:
Land and other assets
not being depreciated/amortized............................ 1,036,900 640,995 377,088 739,752 28,153 2,280,581 117,432 16,331 5,237,232 313
Facilities, infrastructure, and
equipment, net of depreciation/amortization.......... 5,897,598 5,011,957 490,216 5,217,077 68,692 2,405,765 375,542 442,163 19,909,010 32,770
Total capital assets................................................. 6,934,498 5,652,952 867,304 5,956,829 96,845 4,686,346 492,974 458,494 25,146,242 33,083
Total noncurrent assets....................................... 8,879,150 5,799,650 927,640 6,340,580 104,491 4,794,478 958,344 471,742 28,276,075 108,430
Total assets.......................................................... 10,844,268 6,344,029 1,410,046 7,357,121 613,704 5,260,792 1,433,432 660,002 33,923,394 196,105
DEFERRED OUTFLOWS OF RESOURCES
Unamortized loss on refunding of debt......................... 30,534 124,635 - 786 - 8 148 - 156,111 602
Pensions........................................................................ 105,957 70,101 20,976 238,265 157,362 32,592 14,987 63,732 703,972 18,551
OPEB............................................................................ 38,931 28,616 8,226 124,604 87,540 11,493 5,702 28,957 334,069 9,052
Total deferred outflows of resources................... 175,422 223,352 29,202 363,655 244,902 44,093 20,837 92,689 1,194,152 28,205
Total
Governmental
Activities -
Internal Service
Funds
Port of San
Francisco
Laguna Honda
Hospital
San Francisco
International
Airport
San Francisco
Water
Enterprise
Hetch Hetchy
Water and
Power
Municipal
Transportation
Agency
General
Hospital
Medical
Center
San Francisco
Wastewater
Enterprise

CITY AND COUNTY OF SAN FRANCISCO
Statement of Net Position - Proprietary Funds (Continued)
June 30, 2023
(In Thousands)
The notes to the financial statements are an integral part of this statement.
34
Business-Type Activities - Enterprise Funds
Major Funds
LIABILITIES
Current liabilities:
Accounts payable........................................................ 78,054$ 22,671$ 50,347$ 87,188$ 23,908$ 23,207$ 6,353$ 16,407$ 308,135$ 10,594$
Accrued payroll............................................................ 19,383 11,807 4,836 50,364 36,497 7,631 2,695 13,473 146,686 3,681
Accrued vacation and sick leave pay.......................... 12,326 7,057 3,393 31,093 21,479 6,040 1,818 6,624 89,830 2,652
Accrued workers' compensation................................ 2,710 1,914 617 32,236 7,035 1,509 611 3,870 50,502 256
Estimated claims payable........................................... 122 11,125 766 32,400 - 1,650 225 - 46,288 -
Due to other funds....................................................... - 2,440 1,946 594 - 2,620 - - 7,600 -
Unearned revenues and other liabilities...................... 461,730 13,977 12,136 62,664 312,340 6,457 19,371 52,827 941,502 2,581
Accrued interest payable............................................. - 35,104 1,599 5,447 38 27,918 1,304 627 72,037 906
Bonds, loans, leases, and other payables.................. 73,941 139,951 2,233 20,695 4,726 33,000 4,567 6,690 285,803 24,694
Liabilities payable from restricted assets: -
Bonds, loans, leases, and other payables................ 20,075 - - - - - - - 20,075 -
Accrued interest payable.......................................... 64,062 - - - - - - - 64,062 -
Other......................................................................... 118,746 40,863 28,866 23,799 - 122,825 - 1,498 336,597 -
Total current liabilities........................................... 851,149 286,909 106,739 346,480 406,023 232,857 36,944 102,016 2,369,117 45,364
Noncurrent liabilities:
Accrued vacation and sick leave pay.......................... 11,861 6,528 3,332 24,991 16,555 5,622 1,684 4,983 75,556 2,953
Accrued workers' compensation................................ 9,857 7,821 2,840 140,795 35,432 6,489 2,272 20,038 225,544 1,084
Estimated claims payable........................................... 4,150 8,500 6,118 52,200 - 2,700 405 - 74,073 -
Unearned revenues and other liabilities...................... 24 1,271 580 - - 7,988 135,117 - 144,980 -
Bonds, loans, leases, and other payables.................. 9,414,592 5,203,198 318,237 599,343 7,297 3,520,696 136,244 64,049 19,263,656 88,173
Net pension liability...................................................... 162,200 115,343 33,468 372,813 258,127 49,549 21,192 101,071 1,113,763 27,142
Net other postemployment benefits (OPEB) liability... 257,767 148,601 37,180 642,513 355,774 49,035 30,862 156,082 1,677,814 44,150
Total noncurrent liabilities..................................... 9,860,451 5,491,262 401,755 1,832,655 673,185 3,642,079 327,776 346,223 22,575,386 163,502
Total liabilities....................................................... 10,711,600 5,778,171 508,494 2,179,135 1,079,208 3,874,936 364,720 448,239 24,944,503 208,866
DEFERRED INFLOWS OF RESOURCES
Unamortized gain on refunding of debt......................... - - - - - 11,353 - 1,034 12,387 202
Pensions........................................................................ 37,692 28,504 10,500 80,301 57,206 10,023 4,830 22,885 251,941 5,662
OPEB............................................................................ 50,948 27,075 9,775 125,493 89,337 8,286 6,573 26,090 343,577 8,207
Leases........................................................................... 1,042,367 41,558 - 79,850 7,699 1,453 512,492 1,070 1,686,489 7,101
Total deferred inflows of resources...................... 1,131,007 97,137 20,275 285,644 154,242 31,115 523,895 51,079 2,294,394 21,172
NET POSITION
Net investment in capital assets................................... (1,603,694) 545,542 556,035 5,332,130 85,126 1,235,215 313,084 387,780 6,851,218 6,896
Restricted:
Debt service................................................................ 75,798 14,625 56 - - 3,510 - 77,243 171,232 -
Capital projects........................................................... 653,258 15,959 5,233 275,406 13,188 - 47,811 3,283 1,014,138 -
Other purposes........................................................... 4,660 - - 3,284 - - - 2,230 10,174 -
Unrestricted (deficit)...................................................... 47,061 115,947 349,155 (354,823) (473,158) 160,109 204,759 (217,163) (168,113) (12,624)
Total net position.................................................. (822,917)$ 692,073$ 910,479$ 5,255,997$ (374,844)$ 1,398,834$ 565,654$ 253,373$ 7,878,649$ (5,728)$
Total
Governmental
Activities -
Internal Service
Funds
Port of San
Francisco
Laguna Honda
Hospital
San Francisco
International
Airport
San Francisco
Water
Enterprise
Hetch Hetchy
Water and
Power
Municipal
Transportation
Agency
General
Hospital
Medical
Center
San Francisco
Wastewater
Enterprise

CITY AND COUNTY OF SAN FRANCISCO
Statement of Revenues, Expenses, and Changes in Fund Net Position – Proprietary Funds
Year Ended June 30, 2023
(In Thousands)
The notes to the financial statements are an integral part of this statement.
35
Business-Type Activities - Enterprise Funds
Major Funds
Operating revenues:
Aviation.............................................................................. 630,250$ -$ -$ -$ -$ -$ -$ -$ 630,250$ -$
Water and power service.................................................. - 661,241 583,194 - - - - - 1,244,435 -
Passenger fees................................................................. - - - 87,803 - - - - 87,803 -
Net patient service revenue............................................... - - - - 975,675 - - 219,592 1,195,267 -
Sewer service.................................................................... - - - - - 354,491 - - 354,491 -
Rents and concessions.................................................... 165,396 13,282 283 12,606 3,183 822 99,792 - 295,364 492
Parking and transportation................................................ 183,520 - - 191,911 - - 21,271 - 396,702 -
Other charges for services............................................... - - - 30,642 - - - - 30,642 186,082
Other revenues.................................................................. 84,938 16,568 - 27,226 14,674 8,623 7,604 801 160,434 -
Total operating revenues................................................. 1,064,104 691,091 583,477 350,188 993,532 363,936 128,667 220,393 4,395,388 186,574
Operating expenses:
Personal services.............................................................. 283,669 135,709 68,459 892,654 535,413 89,726 36,988 231,100 2,273,718 59,920
Contractual services......................................................... 97,718 16,919 20,334 155,725 317,047 20,777 21,283 54,892 704,695 62,003
Light, heat and power........................................................ 28,771 - 344,036 - - - 5,110 - 377,917 -
Materials and supplies....................................................... 13,384 20,046 4,274 77,100 144,956 14,306 1,189 24,978 300,233 18,147
Depreciation and amortization.......................................... 355,475 155,714 24,671 229,262 15,575 78,039 25,272 12,576 896,584 14,762
General and administrative................................................ 3,883 51,955 58,201 (2,249) 1,154 17,503 2,120 - 132,567 442
Services provided by other
departments.................................................................... 27,247 79,910 16,368 93,497 59,693 40,999 27,798 17,871 363,383 16,337
Other.................................................................................. 92,603 - - (22,371) 2,009 - 3,392 - 75,633 831
Total operating expenses................................................ 902,750 460,253 536,343 1,423,618 1,075,847 261,350 123,152 341,417 5,124,730 172,442
Operating income (loss)................................................. 161,354 230,838 47,134 (1,073,430) (82,315) 102,586 5,515 (121,024) (729,342) 14,132
Nonoperating revenues (expenses):
Operating grants:
Federal............................................................................ - - 1,776 147,596 - 152 - - 149,524 -
State / other..................................................................... - - 1,961 202,515 66,767 - 22,024 1,218 294,485 225
Interest and investment income........................................ 42,540 11,156 4,603 27,561 5,163 2,556 13,950 1,175 108,704 2,321
Interest expense................................................................ (350,349) (204,942) (7,907) (16,124) (462) (81,133) (4,530) (1,683) (667,130) (3,146)
Other nonoperating revenues............................................ 135,838 40,679 13,220 24,958 - 9,758 3,446 12,246 240,145 682
Other nonoperating expenses........................................... (25,418) (1,775) (492) - - (535) (135) - (28,355) -
Total nonoperating revenues (expenses)....................... (197,389) (154,882) 13,161 386,506 71,468 (69,202) 34,755 12,956 97,373 82
Income (loss) before capital
contributions and transfers........................................... (36,035) 75,956 60,295 (686,924) (10,847) 33,384 40,270 (108,068) (631,969) 14,214
Capital contributions.......................................................... 28,679 2,717 2,535 199,145 - 2,740 136 - 235,952 -
Transfers in....................................................................... - 5 20,000 645,927 137,399 75 39,233 123,165 965,804 362
Transfers out..................................................................... (48,701) (20,032) (32) - (11,741) (32) (32) (128) (80,698) (141)
Change in net position.................................................. (56,057) 58,646 82,798 158,148 114,811 36,167 79,607 14,969 489,089 14,435
Net position (deficit) at beginning of year
as previously reported....................................................... (660,243) 633,418 827,678 5,097,849 (489,655) 1,362,662 486,047 238,404 7,496,160 (20,163)
Cumulative effect of accounting change............................. (106,617) 9 3 - - 5 - - (106,600) -
Net position (deficit) at beginning of year, as restated........ (766,860) 633,427 827,681 5,097,849 (489,655) 1,362,667 486,047 238,404 7,389,560 (20,163)
Net position (deficit) at end of year...................................... (822,917)$ 692,073$ 910,479$ 5,255,997$ (374,844)$ 1,398,834$ 565,654$ 253,373$ 7,878,649$ (5,728)$
Total
Governmental
Activities -
Internal Service
Funds
Port of San
Francisco
Laguna Honda
Hospital
San Francisco
International
Airport
San Francisco
Water
Enterprise
Hetch Hetchy
Water and
Power
Municipal
Transportation
Agency
General
Hospital
Medical
Center
San Francisco
Wastewater
Enterprise

CITY AND COUNTY OF SAN FRANCISCO
Statement of Cash Flows – Proprietary Funds
Year Ended June 30, 2023
(In Thousands)
The notes to the financial statements are an integral part of this statement.
36
Business-Type Activities - Enterprise Funds
Major Funds
Cash flows from operating activities:
Cash received from customers, including cash deposits................. 1,136,744$ 587,435$ 587,802$ 395,054$ 923,464$ 364,866$ 34,572$ 237,473$ 4,267,410$ 203,491$
Cash received from tenants for rent.................................................. - 13,098 287 3,190 842 3,126 89,808 - 110,351 -
Cash paid for employees' services................................................... (328,397) (142,866) (72,404) (911,461) (665,007) (95,895) (47,090) (245,672) (2,508,792) (65,455)
Cash paid to suppliers for goods and services................................. (280,170) (174,938) (420,868) (362,781) (519,904) (95,599) (61,056) (84,953) (2,000,269) (94,281)
Cash paid for judgments and claims................................................. - (6,927) (7,604) (17,608) - (5,500) - - (37,639) -
Net cash provided by (used in) operating activities...................... 528,177 275,802 87,213 (893,606) (260,605) 170,998 16,234 (93,152) (168,939) 43,755
Cash flows from noncapital financing activities:
Operating grants................................................................................ - - 2,108 361,529 66,304 177 116,429 1,218 547,765 225
Transfers in........................................................................................ - 5 20,000 584,145 137,399 75 - 122,784 864,408 362
Transfers out..................................................................................... (48,701) (20,032) (32) - (11,741) (32) (32) (128) (80,698) (141)
Other noncapital financing sources................................................... 31,692 6,750 6,551 26,986 - 5,000 3,531 - 80,510 -
Other noncapital financing uses........................................................ (25,348) (1,775) (499) - - (535) - - (28,157) -
Net cash provided by (used in)
noncapital financing activities..................................................... (42,357) (15,052) 28,128 972,660 191,962 4,685 119,928 123,874 1,383,828 446
Cash flows from capital and related financing activities:
Capital grants and other proceeds restricted for capital purposes... 8,713 - - 140,109 - - 4,196 14,003 167,021 -
Transfers in........................................................................................ - - - 61,782 - - 39,233 381 101,396 -
Bond sale proceeds and loans received........................................... 1,064 12,371 - - - 1,617,314 - - 1,630,749 -
Proceeds from sale/transfer of capital assets.................................. - 1,370 7 499 - 127 1 - 2,004 -
Proceeds from commercial paper borrowings................................. 417,250 165,162 76,333 - - 177,564 - - 836,309 -
Proceeds from passenger facility charges....................................... 95,856 - - - - - - - 95,856 -
Acquisition of capital assets.............................................................. (259,793) (172,835) (98,397) (457,867) (12,413) (681,615) (8,637) (7,785) (1,699,342) (1,263)
Retirement of leases, subscriptions, bonds and loans..................... (29,308) (130,320) (3,020) (8,837) (1,957) (1,016,772) (5,143) (6,508) (1,201,865) (21,080)
Bond issue costs paid....................................................................... - - - - - (3,124) - - (3,124) -
Interest paid on debt.......................................................................... (387,197) (214,364) (9,213) (17,207) (467) (89,055) (4,800) (2,792) (725,095) (2,957)
Federal interest income subsidy from Build America Bonds............ - 23,260 502 - - 3,991 - - 27,753 -
Other capital financing sources......................................................... - - - 1,978 - - 154 - 2,132 -
Net cash provided by (used in)
capital and related financing activities........................................ (153,415) (315,356) (33,788) (279,543) (14,837) 8,430 25,004 (2,701) (766,206) (25,300)
Cash flows from investing activities:
Purchases of investments with trustees........................................... (659,908) (348,315) (10,224) - - (514,288) - - (1,532,735) -
Proceeds from sale of investments with trustees............................. 628,083 348,315 10,224 - - 514,288 - - 1,500,910 -
Interest and investment income........................................................ 36,369 9,141 5,784 19,839 5,163 4,948 11,053 705 93,002 220
Other investing activities.................................................................... - - - - - - - - - 79
Net cash provided by investing activities...................................... 4,544 9,141 5,784 19,839 5,163 4,948 11,053 705 61,177 299
Net increase (decrease) in cash and cash equivalents...................... 336,949 (45,465) 87,337 (180,650) (78,317) 189,061 172,219 28,726 509,860 19,200
Cash and cash equivalents-beginning of year..................................... 1,810,483 560,366 364,127 1,212,299 319,400 333,163 228,557 73,673 4,902,068 52,720
Cash and cash equivalents-end of year.............................................. 2,147,432$ 514,901$ 451,464$ 1,031,649$ 241,083$ 522,224$ 400,776$ 102,399$ 5,411,928$ 71,920$
Total
Governmental
Activities -
Internal
Service Funds
Port of San
Francisco
Laguna
Honda
Hospital
San
Francisco
International
Airport
San
Francisco
Water
Enterprise
Hetch Hetchy
Water and
Power
Municipal
Transportation
Agency
General
Hospital
Medical
Center
San
Francisco
Wastewater
Enterprise

CITY AND COUNTY OF SAN FRANCISCO
Statement of Cash Flows – Proprietary Funds (Continued)
Year Ended June 30, 2023
(In Thousands)
The notes to the financial statements are an integral part of this statement.
37
Business-Type Activities - Enterprise Funds
Major Funds
Reconciliation of operating income (loss) to
net cash provided by (used in) operating activities:
Operating income (loss).................................................................... 161,354$ 230,838$ 47,134$ (1,073,430)$ (82,315)$ 102,586$ 5,515$ (121,024)$ (729,342)$ 14,132$
Adjustments for non-cash and other activities:
Depreciation and amortization........................................................ 355,475 155,714 24,671 229,262 15,575 78,039 25,272 12,576 896,584 14,762
Provision for uncollectibles.............................................................. - 4,584 4,219 (54) - 5,500 (114) - 14,135 -
Write-off of capital assets............................................................... - 4,628 403 - - 911 - - 5,942 -
Other................................................................................................ 532 4,832 8,725 - - 686 - - 14,775 52
Changes in assets and deferred outflows of resources/liabilities
and deferred inflows of resources:
Receivables, net............................................................................ 8,026 (6,946) 841 3,879 (16,105) (5,557) (508) 26,250 9,880 13,899
Due from other funds.................................................................... - 63 345 - (17) 1,208 369 (31,066) (29,098) -
Inventories..................................................................................... 92 (1,389) 37 188 (714) (382) (301) 1,007 (1,462) -
Other assets................................................................................. (1,053) - 6,152 336 - - 44 - 5,479 -
Accounts payable.......................................................................... 8,127 (181) 1,699 5,222 5,632 830 1,400 10,404 33,133 3,851
Accrued payroll.............................................................................. 2,245 1,312 681 6,109 4,353 1,229 522 1,233 17,684 507
Accrued vacation and sick leave pay............................................ 3 (144) 413 171 331 761 96 (1,280) 351 272
Accrued workers' compensation.................................................. 474 762 (21) 18,407 1,816 452 336 526 22,752 (85)
Estimated claims payable............................................................. - (16,444) 5,202 (30,063) - (7,695) 130 - (48,870) -
Due to other funds......................................................................... - 2,440 1,566 151 - 2,102 - - 6,259 (31)
Unearned revenues and other liabilities........................................ 44,677 (94,080) (9,516) (10,038) (50,763) 60 (305) 23,298 (96,667) 2,683
Related to leases.......................................................................... (4,325) 1,470 - - (2,304) 2,856 (6,860) (24) (9,187) (58)
Net pension liability/asset and pension related
deferred outflows and inflows of resources................................ (50,910) (21,699) (10,557) (89,497) (105,011) (13,551) (7,109) (18,358) (316,692) (5,805)
Net OPEB liability and OPEB related
deferred outflows and inflows of resources................................ 3,460 10,042 5,219 45,751 (31,083) 963 (2,253) 3,306 35,405 (424)
Total adjustments............................................................................ 366,823 44,964 40,079 179,824 (178,290) 68,412 10,719 27,872 560,403 29,623
Net cash provided by (used in) operating
activities............................................................................................. 528,177$ 275,802$ 87,213$ (893,606)$ (260,605)$ 170,998$ 16,234$ (93,152)$ (168,939)$ 43,755$
Reconciliation of cash and cash equivalents
to the statement of net position:
Deposits and investments with City Treasury:
Unrestricted..................................................................................... 998,115$ 402,885$ 399,864$ 722,409$ 240,856$ 355,770$ 336,948$ -$ 3,456,847$ 65,471$
Restricted........................................................................................ 1,121,496 21,000 28,586 295,960 - 38,574 58,686 102,374 1,666,676 -
Deposits and investments outside City Treasury:
Unrestricted..................................................................................... 23,773 192 154 8,708 7 173 5 - 33,012 -
Restricted........................................................................................ 676,633 77,345 9,211 4,572 220 115,156 5,402 25 888,564 6,449
Total deposits and investments...................................................... 2,820,017 501,422 437,815 1,031,649 241,083 509,673 401,041 102,399 6,045,099 71,920
Adjustments: Investments outside City Treasury not meeting
the definition of cash equivalents and fair value adjustments....... (672,585) 13,479 13,649 - - 12,551 (265) - (633,171) -
Cash and cash equivalents at end of year
on statement of cash flows............................................................... 2,147,432$ 514,901$ 451,464$ 1,031,649$ 241,083$ 522,224$ 400,776$ 102,399$ 5,411,928$ 71,920$
Non-cash capital and related financing activities:
Acquisition of capital assets on accounts payable
and via leases and subscriptions.................................................... 110,362$ 40,863$ 28,866$ -$ -$ 122,825$ 1,038$ -$ 303,954$ 3,370$
Donated inventory.............................................................................. - - - - 2,760 - - - 2,760 -
Capital contributions and other non-cash capital items.................... - 2,717 2,535 - - 2,740 941 - 8,933 -
Bond refunding through fiscal agent.................................................. 263,976 - - - - - - - 263,976 -
Interfund loan..................................................................................... - 2,440 - - - 2,620 - - 5,060 -
Sale of land promissory note............................................................. - 11,007 - - - - - - 11,007 -
Total
Governmental
Activities -
Internal
Service Funds
Port of San
Francisco
Laguna
Honda
Hospital
San
Francisco
International
Airport
San
Francisco
Water
Enterprise
Hetch Hetchy
Water and
Power
Municipal
Transportation
Agency
General
Hospital
Medical
Center
San
Francisco
Wastewater
Enterprise

CITY AND COUNTY OF SAN FRANCISCO
Statement of Fiduciary Net Position
Fiduciary Funds
June 30, 2023
(In Thousands)
The notes to the financial statements are an integral part of this statement.
38
Pension,
Other
Employee and
Other Post-
Employment
Benefit Trust
Funds
Private-
Purpose Trust
Fund
External
Investment
Pool
Other Custodial
Funds
Assets:
Deposits and investments with City Treasury.................................... 122,525$ 185,710$ 1,433,817$ 1,232,871$
Deposits and investments outside City Treasury:
Cash and deposits............................................................................ 17,929 - - 163,776
Short-term investments.................................................................... 384,206 - - -
Debt securities.................................................................................. 2,041,070 - - -
Equity securities................................................................................ 11,018,114 - - -
Real assets....................................................................................... 5,243,926 - - -
Private equity and other alternative investments.............................. 15,891,557 - - -
Foreign currency contracts, net........................................................ (1,029) - - -
Invested securities lending collateral.................................................. 562,491 - - -
Receivables:
Employer and employee contributions............................................. 57,545 - - -
Brokers, general partners and others............................................... 135,854 - - -
Federal and state grants and subventions....................................... - 1,553 - 8,537
Charges for services........................................................................ - - - 4
Taxes................................................................................................ - - - 155,105
Interest and other.............................................................................. 18,879 2,642 9,175 7,449
Loans (net of allowance for uncollectible amounts)......................... - 1,471 - -
Net OPEB asset.................................................................................. - 2,118 - -
Other assets....................................................................................... 5,201 2,131 - -
Restricted assets:
Deposits and investments outside City Treasury............................. - 319,563 - 28,885
Capital assets:
Land and other assets not being depreciated.................................. - 4,152 - -
Total assets.................................................................................. 35,498,268 519,340 1,442,992 1,596,627
Deferred outflows of resources:
Unamortized loss on refunding of debt............................................... - 33,862 - -
Pensions............................................................................................. - 14,513 - -
OPEB.................................................................................................. 2,366 3,619 - -
Total deferred outflows of resources........................................... 2,366 51,994 - -
Liabilities:
Accounts payable................................................................................ 66,283 52,768 - 12,160
Estimated claims payable................................................................... 38,152 - - -
Due to the primary government.......................................................... - 3,622 - -
Custodial obligations to State of California......................................... - - - 690
Taxes payable to other governments.................................................. - - - 252,451
Accrued interest payable..................................................................... - 12,773 - -
Payable to brokers.............................................................................. 55,038 - - -
Payable to borrowers of securities..................................................... 562,408 - - -
Other liabilities..................................................................................... 3,999 1,067 - 117,083
Long-term obligations.......................................................................... - 876,559 - -
Net pension liability.............................................................................. - 37,328 - -
Net OPEB liability................................................................................ 11,279 - - -
Total liabilities............................................................................... 737,159 984,117 - 382,384
Deferred inflows of resources:
Pensions............................................................................................. - 5,095 - -
OPEB.................................................................................................. 1,878 580 - -
Total deferred inflows of resources.............................................. 1,878 5,675 - -
Net position restricted for:
Pensions............................................................................................. 33,688,428 - - -
Postemployment healthcare benefits................................................. 968,425 - - -
External pool participants.................................................................... - - 1,442,992 -
Individuals, organizations, and other governments............................. 104,744 (418,458) - 1,214,243
Total net position........................................................................ 34,761,597$ (418,458)$ 1,442,992$ 1,214,243$
Custodial Funds

CITY AND COUNTY OF SAN FRANCISCO
Statement of Changes in Fiduciary Net Position
Fiduciary Funds
Year Ended June 30, 2023
(In Thousands)
The notes to the financial statements are an integral part of this statement.
39
Pension,
Other
Employee and
Other Post-
Employment
Benefit Trust
Funds
Private-
Purpose Trust
Fund
External
Investment
Pool
Other
Custodial
Funds
Additions:
Property taxes............................................................................. -$ 122,603$ -$ 5,596,107$
Charges for services................................................................... - 18,391 - -
Contributions:
Employee contributions............................................................ 688,270 - - -
Employer contributions............................................................. 1,820,021 - - -
Contributions to pooled investments........................................ - - 3,178,531 -
Total contributions................................................................ 2,508,291 140,994 3,178,531 5,596,107
Investment income (expenses):
Interest...................................................................................... 83,464 11,280 27,129 15,424
Dividends.................................................................................. 94,883 - - -
Net appreciation in fair value of investments............................ 1,630,129 - - -
Securities lending income......................................................... 29,305 - - -
Total investment income...................................................... 1,837,781 11,280 27,129 15,424
Less investment expenses:
Other investment expenses................................................... (80,465) - - -
Net investment income...................................................... 1,757,316 11,280 27,129 15,424
Custodial additions...................................................................... - - - 1,022,757
Other additions............................................................................ - 13,040 - 51,829
Total additions, net............................................................. 4,265,607 165,314 3,205,660 6,686,117
Deductions:
Neighborhood development........................................................ - 86,207 - -
Interest on debt............................................................................ - 40,581 - 29,393
Benefit payments........................................................................ 3,123,304 - - -
Refunds of contributions............................................................. 24,096 - - -
Distribution from pooled investments......................................... - - 3,016,296 -
Property taxes distributed to other governments........................ - - - 5,551,457
Custodial distributions to State................................................... - - - 12,822
Other custodial deductions......................................................... - - - 169,761
Administrative expenses............................................................. 23,135 7,082 - -
Total deductions................................................................... 3,170,535 133,870 3,016,296 5,763,433
Change in net position.......................................................... 1,095,072 31,444 189,364 922,684
Net position (deficit) at beginning of year, as previously reported. 33,666,525 (449,902) 1,253,628 302,917
Cumulative effect of accounting change....................................... - - - (11,358)
Net position (deficit) at beginning of year, as restated.................. 33,666,525 (449,902) 1,253,628 291,559
Net position (deficit) at end of year................................................ 34,761,597$ (418,458)$ 1,442,992$ 1,214,243$
Custodial Funds
CITY AND COUNTY OF SAN FRANCISCO
Notes to Basic Financial Statements
June 30, 2023
(Dollars in Thousands)
40
(1) THE FINANCIAL REPORTING ENTITY
San Francisco is a city and county chartered by the State of California and as such can exercise the
powers as both a city and a county under state law. As required by generally accepted accounting
principles, the accompanying financial statements present the City and County of San Francisco (the
City or primary government) and its component units. The component units discussed below are
included in the City’s reporting entity because of the significance of their operations or financial
relationships with the City.
As a government agency, the City is exempt from both federal income taxes and California State
franchise taxes.
Blended Component Units
Following is a description of those legally separate component units for which the City is financially
accountable that are blended with the primary government because of their individual governance or
financial relationships to the City.
San Francisco County Transportation Authority (Transportation Authority) – The voters of the City
created the Transportation Authority in 1989 to impose voter-approved sales and use tax of one-half of
one percent, for a period not to exceed 20 years, to fund essential traffic and transportation projects. In
2003, the voters approved Proposition K, extending the city-wide one-half of one percent sales tax with
a new 30-year plan. A board consisting of the eleven members of the City’s Board of Supervisors
serving ex officio governs the Transportation Authority. The Transportation Authority is reported in a
special revenue fund in the City’s basic financial statements. Financial statements for the
Transportation Authority can be obtained from their finance and administrative offices at 1455 Market
Street, 22
nd
Floor, San Francisco, CA 94103.
Infrastructure Financing Districts and Infrastructure and Revitalization Financing Districts (Tax
Increment Financing Districts or “TIFD”) – An infrastructure financing district (IFD) and an infrastructure
and revitalization financing district (IRFD) are legally constituted government entities formed under
California law, and with the approval of the Board of Supervisors. Several TIFDs have been established
for the purpose of financing public infrastructure and affordable housing. The Board of Supervisors acts
as the legislative body as it does for the City and is able to impose its will to allocate tax increments to
the TIFDs, issue debt, as well as to appoint, hire, reassign, or dismiss City employees who administrate
the TIFDs. There is also a financial burden relationship between the City and these TIFDs due to the
allocation of tax increment revenues by the City to the TIFDs. As such, TIFDs are a blended component
unit of the City. The TIFDs are reported in a special revenue fund in the City’s financial statements.
Separate financial statements are not prepared for TIFDs. Further information can be obtained from
their administrative offices at City Hall, Room 338, 1 Dr. Carlton B. Goodlett Place, San Francisco, CA
94102.
Mission Rock Special Tax District (STD) – Mission Rock STD is a legally constituted governmental
entity established pursuant to the San Francisco Special Tax Financing Law, which incorporates the
State’s Mello-Roos law. The Board of Supervisors acts as the legislative body as it does for the City
and is able to impose its will to authorize the levy of special taxes and issuance of special tax debts, as
well as to appoint, hire, reassign, or dismiss City employees who administrate the STD. Pursuant to the
Pledge Agreement between the City and Mission Rock STD, certain increment taxes allocated to the
City’s Infrastructure Financing District (IFD) No. 2, Project Area I are pledged toward the debt service
of Mission Rock STD Special Tax Bonds once a minimum of one hundred thousand dollars in increment
taxes have been collected within a Sub-Project Area. In prior years, the increment taxes allocated to
the IFD were below the one hundred thousand dollars threshold for each Sub-Project Area. Therefore,
Mission Rock STD has historically been reported as a fiduciary component unit in custodial fund. In
fiscal year 2023, the increment taxes allocated surpassed the one hundred thousand dollars threshold.
Accordingly, the increment taxes collected are pledged towards the debt service of the Mission Rock
STD Special Tax Bonds. The allocation of tax increment revenues to the Mission Rock STD created a
CITY AND COUNTY OF SAN FRANCISCO
Notes to Basic Financial Statements (Continued)
June 30, 2023
(Dollars in Thousands)
41
financial burden relationship between the City and Mission Rock STD. This change in circumstances
triggered Mission Rock STD to become a blended component unit reported in a special revenue fund
in the City’s financial statements. Separate financial statements are not prepared for Mission Rock
STD. Further information can be obtained from their administrative offices at City Hall, Room 338, 1 Dr.
Carlton B. Goodlett Place, San Francisco, CA 94102.
San Francisco City and County Finance Corporation (Finance Corporation) – The Finance Corporation
was created in 1990 by a vote of the electorate to allow the City to lease-purchase $20.0 million (plus
5.0 percent per year growth) of equipment using tax-exempt obligations. Although legally separate from
the City, the Finance Corporation is reported as if it were part of the primary government because its
sole purpose is to provide lease financing to the City. The Finance Corporation is governed by a three-
member board of directors approved by the Mayor and the Board of Supervisors. The Finance
Corporation is reported as an internal service fund. Financial statements for the Finance Corporation
can be obtained from their administrative offices at City Hall, Room 338, 1 Dr. Carlton B. Goodlett
Place, San Francisco, CA 94102.
San Francisco Parking Authority (Parking Authority) – The Parking Authority was created in October
1949 to provide services exclusively to the City. In accordance with Proposition D authorized by the
City’s electorate in November 1988, a City Charter amendment created the Parking and Traffic
Commission (PTC). The PTC consists of five commissioners appointed by the Mayor. Upon creation
of the PTC, the responsibility to oversee the City’s off-street parking operations was transferred from
the Parking Authority to the PTC. The staff and fiscal operations of the Parking Authority were also
incorporated into the PTC. Beginning on July 1, 2002, the responsibility for overseeing the operations
of the PTC became the responsibility of the Municipal Transportation Agency (SFMTA) pursuant to
Proposition E, which was passed by the voters in November 1999. Separate financial statements are
not prepared for the Parking Authority. Further information about the Parking Authority can be obtained
from the SFMTA Chief Financial Officer at 1 South Van Ness Avenue, 3
rd
Floor, San Francisco, CA
94103.
Discretely Presented Component Unit
Treasure Island Development Authority (TIDA) – The TIDA is a nonprofit public benefit corporation. The
TIDA was authorized in accordance with the Treasure Island Conversion Act of 1997. Seven
commissioners who are appointed by the Mayor, subject to confirmation by the City’s Board of
Supervisors, govern the TIDA. The specific purpose of the TIDA is to promote the planning,
redevelopment, reconstruction, rehabilitation, reuse, and conversion of the property known as Naval
Station Treasure Island for the public interest, convenience, welfare, and common benefit of the
inhabitants of the City. The TIDA has adopted as its mission the creation of affordable housing and
economic development opportunities on Treasure Island.
The TIDA’s governing body is not substantively the same as that of the City and does not provide
services entirely or almost entirely to the City. The TIDA is reported in a separate column to emphasize
that it is legally separate from the City. The City is financially accountable for the TIDA through the
appointment of the TIDA’s Board and the ability of the City to approve the TIDA’s budget. Disclosures
related to the TIDA, where significant, are separately identified throughout these notes. Separate
financial statements are not prepared for TIDA. Further information about TIDA can be obtained from
their administrative offices at 1 Avenue of the Palms, Suite 241, Treasure Island, San Francisco, CA
94130.
CITY AND COUNTY OF SAN FRANCISCO
Notes to Basic Financial Statements (Continued)
June 30, 2023
(Dollars in Thousands)
42
Fiduciary Component Units
Successor Agency to the Redevelopment Agency of the City and County of San Francisco (Successor
Agency) – The Successor Agency was created on February 1, 2012, to serve as a custodian for the
assets and to wind down the affairs of the former San Francisco Redevelopment Agency (Agency)
pursuant to California Redevelopment Dissolution Law. The Successor Agency is governed by the
Successor Agency Commission, commonly known as the Commission on Community Investment and
Infrastructure, and is a separate public entity from the City. The Commission has five members, which
serve at the pleasure of the City’s Mayor and are subject to confirmation by the Board of Supervisors.
The City is financially accountable for the Successor Agency through the appointment of the
Commission and a requirement that the Board of Supervisors approve the Successor Agency’s annual
budget.
The financial statements present the Successor Agency and its component units, entities for which the
Successor Agency is considered to be financially accountable. The City and County of San Francisco
Redevelopment Financing Authority (Financing Authority) is a joint powers authority formed between
the former Agency and the City to facilitate the long-term financing of the former Agency activities. The
Financing Authority is included as a blended component unit in the Successor Agency’s financial
statements because the Financing Authority provides services entirely to the Successor Agency.
In order to facilitate construction and rehabilitation in the City, seven Community Facilities Districts
(CFDs) were formed by the former Agency and Successor Agency. The Successor Agency can impose
its will on the CFDs but does not have a financial benefit or burden from the CFDs. The CFDs are
fiduciary component units of the Successor Agency and financial activities of the CFDs are included as
custodial funds of the City.
Per the Redevelopment Dissolution Law, certain actions of the Successor Agency are also subject to
the direction of an Oversight Board. The Oversight Board is comprised of seven-member
representatives from local government bodies: four City representatives appointed by the Mayor of the
City subject to confirmation by the Board of Supervisors of the City (such members represent a voting
majority of the Oversight Board); the Vice Chancellor of the San Francisco Community College District;
a Board member of the Bay Area Rapid Transit District; and the Executive Director of Policy and
Operations of the San Francisco Unified School District.
In general, the Successor Agency’s assets can only be used to pay enforceable obligations in existence
at the date of dissolution (including the completion of any unfinished projects that were subject to legally
enforceable contractual commitments). In future fiscal years, the Successor Agency will only be
allocated revenues in the amount that is necessary to pay the estimated annual installment payments
on enforceable obligations of the former Agency until all enforceable obligations of the former Agency
have been paid in full and all assets have been liquidated. Based upon the nature of the Successor
Agency’s custodial role, the Successor Agency is reported in a fiduciary fund (private-purpose trust
fund). Complete financial statements can be obtained from the Successor Agency’s finance department
at 1 South Van Ness Avenue, 5
th
Floor, San Francisco, CA 94103.
Community Facilities Districts and Special Tax Districts – A community facilities district (CFD) is a
legally constituted governmental entity formed under the State’s Mello-Roos law and with approval of
the Board of Supervisors. A special tax district (STD) is established pursuant to the San Francisco
Special Tax Financing Law, which incorporates the Mello-Roos law. Several CFDs and STDs were
established for the sole purpose of financing facilities and services. Although there is no financial benefit
or burden relation between the City and a CFD or STD, the Board of Supervisors acts as the legislative
body as it does for the City and is able to impose its will to authorize the levy of special taxes and
issuance of special tax debts, as well as to appoint, hire, reassign, or dismiss City employees who
administrate the CFD or STD. CFDs and STDs are fiduciary component units of the City because assets
are held by the City for the benefit of the CFD or STD. The combined activities of all CFDs and STDs
are presented as a custodial fund. Separate financial statements are not prepared for CFDs and STDs.
CITY AND COUNTY OF SAN FRANCISCO
Notes to Basic Financial Statements (Continued)
June 30, 2023
(Dollars in Thousands)
43
Further information can be obtained from their administrative offices at City Hall, Room 338, 1 Dr.
Carlton B. Goodlett Place, San Francisco, CA 94102.
Non-Disclosed Organizations
There are other governmental agencies that provide services within the City. These entities have
independent governing boards and the City is not financially accountable for them. The City’s basic
financial statements, except for certain cash held by the City as an agent, do not reflect operations of
the San Francisco Airport Improvement Corporation, San Francisco Health Authority, San Francisco
Housing Authority, San Francisco Unified School District and San Francisco Community College
District. The City is represented in two regional agencies, the Bay Area Rapid Transit District and the
Bay Area Air Quality Management District, both of which are also excluded from the City’s reporting
entity.
CITY AND COUNTY OF SAN FRANCISCO
Notes to Basic Financial Statements (Continued)
June 30, 2023
(Dollars in Thousands)
44
(2) SUMMARY OF SIGNIFICANT ACCOUNTING POLICIES
(a) Government-wide and fund financial statements
The government-wide financial statements (i.e., the statement of net position and the statement of
activities) report information on the non-fiduciary activities of the primary government and its component
units. Governmental activities, which normally are supported by taxes and intergovernmental revenues,
are reported separately from business-type activities, which rely, to a significant extent, on fees and
charges for support. Likewise, the primary government is reported separately from its legally separate
component unit for which the primary government is financially accountable.
The statement of activities demonstrates the degree to which the direct expenses of a given function
or segment is offset by program revenues. Direct expenses are those that are clearly identifiable with
a specific function or segment. Program revenues include (1) charges to customers or applicants who
purchase, use, or directly benefit from goods, services, or privileges provided by a given function or
segment, and (2) grants and contributions that are restricted to meeting the operational or capital
requirements of a particular function or segment. Taxes and other items not properly included among
program revenues are reported instead as general revenues.
Separate financial statements are provided for governmental funds, proprietary funds, and fiduciary
funds, even though the latter are excluded from the government-wide financial statements. Major
individual governmental funds and major individual enterprise funds are reported as separate columns
in the fund financial statements.
(b) Measurement focus, basis of accounting, and financial statement presentation
The government-wide financial statements are reported using the economic resources measurement
focus and the accrual basis of accounting, as are the proprietary fund and fiduciary fund financial
statements. Revenues are recorded when earned and expenses are recorded when a liability is
incurred, regardless of the timing of related cash flows. Property taxes are recognized as revenues in
the year for which they are levied. Grants and similar items are recognized as revenue as soon as all
eligibility requirements have been met.
Governmental fund financial statements are reported using the current financial resources
measurement focus and the modified accrual basis of accounting. Revenues are recognized as soon
as they are both measurable and available. Revenues are considered to be available when they are
collectible within the current period or soon enough thereafter to pay liabilities of the current period. The
City considers property tax revenues to be available if they are collected within 60 days of the end of
the current fiscal period. All other revenues are considered to be available if they are generally collected
within 60 days of the end of the current fiscal period. It is the City’s policy to submit reimbursement and
claim requests for federal and state grant revenues within 30 days of the end of the program cycle and
payment is generally received within the first or second quarter of the following fiscal year. Expenditures
generally are recorded when a liability is incurred, as under accrual accounting. However, debt service
expenditures, as well as expenditures related to vacation, sick leave, claims and judgments, are
recorded only when payment is due.
Property taxes, other local taxes, grants and subventions, licenses, charges for services, rents and
concessions, and interest and investment income associated with the current fiscal period are all
considered susceptible to accrual and so have been recognized as revenues of the current fiscal period.
All other revenue items are considered to be measurable and available only when the City receives
cash.
The City reports the following major governmental fund:
▪ The General Fund is the City’s primary operating fund. It accounts for all financial resources of the
City except those required to be accounted for in another fund.
CITY AND COUNTY OF SAN FRANCISCO
Notes to Basic Financial Statements (Continued)
June 30, 2023
(Dollars in Thousands)
45
The City reports the following major proprietary (enterprise) funds:
▪ The San Francisco International Airport Fund accounts for the activities of the City-owned
commercial service airport in the San Francisco Bay Area.
▪ The San Francisco Water Enterprise Fund accounts for the activities of the San Francisco Water
Enterprise (Water Enterprise). The Water Enterprise is engaged in the distribution of water to the
City and certain suburban areas.
▪ The Hetch Hetchy Water and Power Enterprise Fund accounts for the activities of Hetch Hetchy
Water and Power (Hetch Hetchy) and CleanPowerSF. Hetch Hetchy is engaged in the collection
and conveyance of approximately 85.0% of the City’s water supply and in the generation and
transmission of electricity. CleanPowerSF aggregates the buying power of customers in San
Francisco to purchase renewable energy.
▪ The Municipal Transportation Agency Fund accounts for the activities of the Municipal
Transportation Agency (SFMTA). The SFMTA was established by Proposition E, passed by the
City’s voters in November 1999. The SFMTA includes the San Francisco Municipal Railway (Muni)
and the operations of Sustainable Streets, which includes the Parking Authority. Muni was
established in 1912 and is responsible for the operations of the City’s public transportation system.
Sustainable Streets is responsible for proposing and implementing street and traffic changes and
oversees the City’s off-street parking operations. Sustainable Streets is a separate department of
the SFMTA. The parking garages fund accounts for the activities of various nonprofit corporations
formed by the Parking Authority to provide financial and other assistance to the City to acquire land,
construct facilities, and manage various parking facilities.
▪ The General Hospital Medical Center Fund accounts for the activities of the San Francisco
General Hospital (SFGH), a City-owned acute care hospital.
▪ The San Francisco Wastewater Enterprise Fund was created after the San Francisco voters
approved a proposition in 1976, authorizing the City to issue $240.0 million in bonds for the purpose
of acquiring, constructing, improving, and financing improvements to the City’s municipal sewage
treatment and disposal system.
▪ The Port of San Francisco Fund accounts for the operation, development, and maintenance of
seven and one-half miles of waterfront property of the Port of San Francisco (Port). This was
established in 1969 after the San Francisco voters approved a proposition to accept the transfer of
the Harbor of San Francisco from the State of California.
▪ The Laguna Honda Hospital Fund accounts for the activities of Laguna Honda Hospital (LHH),
the City-owned skilled nursing facility, which specializes in serving elderly and disabled residents.
Additionally, the City reports the following fund types:
▪ The Special Revenue Funds are used to account for the proceeds of specific revenue sources
that are restricted or committed to expenditures for specified purposes other than debt service or
capital projects.
▪ The Debt Service Funds account for the accumulation of property taxes and other revenues for
periodic payment of interest and principal on general obligation and certain lease revenue bonds
and related authorized costs.
▪ The Capital Projects Funds are used to account for financial resources that are restricted,
committed or assigned to expenditures for the acquisition of land or acquisition and construction of
major facilities other than those financed in the proprietary fund types.
CITY AND COUNTY OF SAN FRANCISCO
Notes to Basic Financial Statements (Continued)
June 30, 2023
(Dollars in Thousands)
46
▪ The Permanent Fund accounts for resources that are legally restricted to the extent that only
earnings, not principal, may be used for purposes that support specific programs.
▪ The Internal Service Funds account for the financing of goods or services provided by one City
department to another City department on a cost-reimbursement basis. Internal service funds
account for the activities of the equipment maintenance services, centralized printing and mailing
services, centralized telecommunications and information services, and lease financing through
the Finance Corporation.
▪ The Pension, Other Employee and Other Postemployment Benefit Trust Funds reflect the
activities of the Employees’ Retirement System (Retirement System), the Health Service System
and the Retiree Health Care Trust Fund. The Retirement System accounts for employee
contributions, City contributions, and the earnings and profits from investments. It also accounts for
the disbursements made for employee retirement benefits, withdrawals, disability and death
benefits as well as administrative expenses. The Health Service System accounts for contributions
from active and retired employees and surviving spouses, City contributions, and the earnings and
profits from investments. It also accounts for the disbursements to various health plans and health
care providers for the medical expenses of beneficiaries. The Retiree Health Care Trust Fund
currently accounts for other postemployment benefit contributions from the City and the San
Francisco Community College District, together with the earnings and profits from investments.
▪ The Private-Purpose Trust Fund accounts for the custodial responsibilities that are assigned to
the Successor Agency with the passage of the Redevelopment Dissolution Law.
▪ The Custodial Funds account for the external portion of the Treasurer’s Office investment pool
and resources held by the City in a custodial capacity on behalf of the State of California and other
governmental agencies; individuals; and human welfare, community health, and transportation
programs. The external portion of the Treasurer’s Office investment pool represents funds held for
the San Francisco Community College District, San Francisco Unified School District, and the Trial
Courts of the State of California.
The City applies all applicable Governmental Accounting Standards Board (GASB) pronouncements.
In general, the effect of interfund activity has been eliminated from the government-wide financial
statements. Exceptions to this rule are charges to other City departments from the General Fund, Water
Enterprise and Hetch Hetchy. These charges have not been eliminated because elimination would
distort the direct costs and program revenues reported in the statement of activities.
Proprietary funds distinguish operating revenues and expenses from nonoperating items. Operating
revenues and expenses generally result from providing services in connection with the fund’s principal
ongoing operations. The principal operating revenues of the City’s enterprise and internal service funds
are charges for customer services including: water, sewer and power charges, public transportation
fees, airline fees and charges, parking fees, hospital patient service fees, commercial and industrial
rents, printing services, vehicle maintenance fees, and telecommunication and information system
support charges. Operating expenses for enterprise funds and internal service funds include the cost
of services, administrative expenses, and depreciation/amortization on capital assets. All revenues and
expenses not meeting this definition are reported as nonoperating revenues and expenses.
When both restricted and unrestricted resources are available for use, it is the City’s policy to use
restricted resources first, then unrestricted resources as they are needed.
(c) Deposits and Investments
Investment in the Treasurer’s Pool
The Treasurer invests on behalf of most funds of the City and external participants in accordance with
the City’s investment policy and the California State Government Code. The City Treasurer, who reports
CITY AND COUNTY OF SAN FRANCISCO
Notes to Basic Financial Statements (Continued)
June 30, 2023
(Dollars in Thousands)
47
on a monthly basis to the Board of Supervisors, manages the Treasurer’s pool. In addition, the function
of the County Treasury Oversight Committee is to review and monitor the City’s investment policy and
to monitor compliance with the investment policy and reporting provisions of the law through an annual
audit.
The Treasurer’s investment pool consists of two components: 1) pooled deposits and investments and
2) dedicated investment funds. The dedicated investment funds represent restricted funds and relate
to bond issues of the Enterprise Funds, and the General Fund’s cash reserve requirement. In addition
to the Treasurer’s investment pool, the City has other funds that are held by trustees. These funds are
related to the issuance of bonds and certain loan programs of the City. The investments of the
Retirement System and of the Retiree Health Care Trust Fund are held by trustees.
The San Francisco Unified School District (School District), San Francisco Community College District
(Community College District), and the City are involuntary participants in the City’s investment pool. As
of June 30, 2023, involuntary participants accounted for approximately 92.6 percent of the pool.
Voluntary participants accounted for 7.4 percent of the pool. Further, the School District, Community
College District, the Trial Courts of the State of California, and medical reimbursement recipients are
external participants of the City’s pool. At June 30, 2023, $2.31 billion was held on behalf of these
external participants. The total percentage share of the City’s pool that relates to these four external
participants is 14.4 percent. Internal participants accounted for 85.6 percent of the pool.
Investment Valuation
Investments are carried at fair value, except for certain non-negotiable investments that are reported
at cost because they are not transferable and have terms that are not affected by changes in market
interest rates, such as collateralized certificates of deposit and public time deposits. The fair value of
investments is determined monthly and is based on current market prices. The fair value of participants’
position in the pool approximates the value of the pool shares. The method used to determine the value
of participants’ equity is based on the book value of the participants’ percentage participation. In the
event that a certain fund overdraws its share of pooled cash, the overdraft is covered by the General
Fund and a payable to the General Fund is established in the City’s basic financial statements.
Retirement System – Investments are reported at fair value. Securities traded on national or
international exchanges are valued at the last reported sales price at current exchange rates. Securities
that do not have an established market are reported at estimated fair value derived from third-party
pricing services. Purchases and sales of investments are recorded on a trade date basis.
The fair values of the partnership interests, which include private equity, real assets, private credit, and
some public equity investments are based on net asset values (NAV) provided by the general partners
and investment managers.
The Absolute Return Program invests in limited partnerships and other alternative investment vehicles.
The most common investment strategies include, but are not limited to equity, credit, macro, emerging
markets, quantitative, multi-strategy, special situations/other, co-investments and commodities. These
investments are valued using their respective NAV and are audited annually. The most significant input
into the NAV of such an entity is the fair value of its investment holdings. These holdings are typically
valued on a monthly basis by each fund’s independent administrator and for certain illiquid investments,
where no market exists, the General Partner may provide pricing input. The management assumptions
are based upon the nature of the investment and the underlying business. Investments have the
potential to become illiquid under stressed market conditions and, in certain circumstances, investors
may be subject to redemption restrictions which can impede the timely return of capital. The valuation
techniques vary based upon underlying investment type but are predominantly derived from observed
market prices.
CITY AND COUNTY OF SAN FRANCISCO
Notes to Basic Financial Statements (Continued)
June 30, 2023
(Dollars in Thousands)
48
San Francisco International Airport – The Airport has entered into certain derivative instruments, which
it values at fair value, in accordance with GASB Statement No. 53, Accounting and Financial Reporting
for Derivative Instruments, and GASB Statement No. 72, Fair Value Measurement and Application. The
Airport applies hedge accounting for changes in the fair value of hedging derivative instruments, in
accordance with GASB Statement No. 64, Derivative Instruments: Application of Hedge Accounting
Termination Provisions, an amendment of GASB Statement No. 53. Under hedge accounting, if the
derivatives are determined to be effective hedges, the changes in the fair value of hedging derivative
instruments are reported as either deferred inflows or deferred outflows in the statement of net position,
otherwise changes in fair value are recorded within the investment revenue classification. The Airport
had an interest rate swap outstanding as of July 1, 2022, which was terminated during the year. As of
June 30, 2023, the Airport did not have any outstanding derivative instruments. The Airport will
implement the provisions of Statement No. 99 in the future when it is applicable.
Other funds – Non-pooled investments are also generally carried at fair value. However, money market
investments (such as short-term, highly liquid debt instruments including commercial paper and
bankers’ acceptances) that have a remaining maturity at the time of purchase of one year or less and
nonparticipating interest-earning investment contracts (such as repurchase agreements and
guaranteed or bank investment contracts) are carried at amortized cost. The fair value of non-pooled
investments is determined annually and is based on current market prices. The fair value of investments
in open-end mutual funds is determined based on the fund’s current share price.
Investment Income
Income from pooled investments is allocated at month end to the individual funds or external
participants based on the fund or participant’s average daily cash balance in relation to total pooled
investments. City management has determined that the investment income related to certain funds
should be allocated to the General Fund. On a budget basis, the interest income is recorded in the
General Fund. On a generally accepted accounting principles (GAAP) basis, the income is reported in
the fund where the related investments reside. A transfer is then recorded to transfer an amount equal
to the interest earnings to the General Fund. This is the case for certain other governmental and internal
service funds.
It is the City’s policy to charge interest at month end to those funds that have a negative average daily
cash balance. In certain instances, City management has determined that the interest expense related
to the fund should be allocated to the General Fund. On a budget basis, the interest expense is
recorded in the General Fund. On a GAAP basis, the interest expense is recorded in the fund and then
a transfer from the General Fund for an amount equal to the interest expense is made to the fund. This
is the case for certain other funds, LHH, SFGH, and the internal service funds.
Interest income related to certain funds in fiduciary activities that are recorded in the General Fund on
a budget basis is recorded as other income instead of as a transfer on the GAAP basis.
(d) Loans Receivable
The Mayor’s Office of Housing (MOH) and the Mayor’s Office of Community Development (MOCD)
administer several housing and small business subsidy programs and issue loans to qualified
applicants. In addition, the Department of Building Inspection manages other receivables from
organizations. Management has determined through policy that many of these loans may be forgiven
or renegotiated and extended long into the future if certain terms and conditions of the loans are met.
At June 30, 2023, it was determined that $2,445.6 million of the $2,661.8 million loan portfolio is not
expected to be ultimately collected.
For the purposes of the fund financial statements, the governmental funds expenditures relating to long-
term loans arising from loan subsidy programs are charged to operations upon funding and the loans
are recorded, net of an estimated allowance for potentially uncollectible loans, with an offset to a

CITY AND COUNTY OF SAN FRANCISCO
Notes to Basic Financial Statements (Continued)
June 30, 2023
(Dollars in Thousands)
49
deferred inflow of resources. For purposes of the government-wide financial statements, long-term
loans are not offset by deferred inflows of resources.
(e) Inventories
Inventories recorded in the governmental funds consist of personal protective equipment and supplies
related to the COVID-19 pandemic. Inventories recorded in the proprietary funds primarily consist of
construction materials and maintenance supplies, as well as pharmaceutical supplies maintained by
the hospitals. Generally, proprietary funds value inventory at cost or average cost and expense supply
inventory as it is consumed. This is referred to as the consumption method of inventory accounting.
(f) Property Held for Resale
Property held for resale includes both residential and commercial property and is recorded as other
assets at the lower of estimated cost or estimated conveyance value. Estimated conveyance value is
management’s estimate of net realizable value of each property parcel based on its current intended
use. Property held for resale may, during the period it is held by the City, generate rental income, which
is recognized as it becomes due and is considered collectible.
(g) Capital Assets
Capital assets, which include land, facilities and improvements, machinery and equipment,
infrastructure assets, and intangible assets, are reported in the applicable governmental or business-
type activities columns in the government-wide financial statements and in the proprietary and private-
purpose trust funds. Capital assets, except for intangible assets, are defined as assets with an initial
individual cost of more than $5 and have an estimated life that extends beyond a single reporting period
or more than a year. Intangible assets have a capitalization threshold of $100. Such assets are recorded
at historical cost or estimated historical cost if purchased or constructed. Donated capital assets are
recorded at estimated acquisition value at the date of donation. Capital outlay is recorded as
expenditures of the General Fund and other governmental funds and as assets in the government-wide
financial statements to the extent the City’s capitalization threshold is met. Interest incurred during the
construction phase of the capital assets of business-type activities prior to July 1, 2021 is reflected in
the capitalized value of the asset constructed, net of interest earned on the invested proceeds of tax-
exempt debt over the same period. Amortization of right-to-use assets under leases and subscriptions
is included in depreciation and amortization.
Facilities and improvements, infrastructure, machinery and equipment, easements, and intangible
assets of the primary government, as well as the component units, are depreciated using the straight-
line method over the following estimated useful lives:
Assets
Years
Facilities and improvements
15 to 175
Infrastructure
15 to 70
Machinery and equipment
2 to 75
Intangible assets
Varies with type
Works of art, historical treasures and zoological animals held for public exhibition, education, or
research in furtherance of public service, rather than financial gain, are not capitalized. These items
are protected, kept unencumbered, cared for, and preserved by the City. It is the City’s policy to utilize
proceeds from the sale of these items for the acquisition of other items for collection and display.
(h) Accrued Vacation and Sick Leave Pay
Vacation pay, which may be accumulated up to ten weeks depending on an employee’s length of
service, is payable upon termination. Sick leave may be accumulated up to six months. Unused
CITY AND COUNTY OF SAN FRANCISCO
Notes to Basic Financial Statements (Continued)
June 30, 2023
(Dollars in Thousands)
50
amounts accumulated prior to December 6, 1978, are vested and payable upon termination of
employment by retirement or disability caused by industrial accident or death.
The City accrues for all salary-related items in the government-wide and proprietary fund financial
statements for which they are liable to make a payment directly and incrementally associated with
payments made for compensated absences on termination. The City includes its share of social security
and Medicare payments made on behalf of the employees in the accrual for vacation and sick leave
pay.
(i) Bond Issuance Costs, Premiums, Discounts, and Interest Accretion
In the government-wide financial statements, the proprietary fund type and fiduciary fund type financial
statements, long-term debt and other long-term obligations are reported as liabilities in the applicable
governmental activities, business-type activities, proprietary fund or fiduciary fund statement of net
position. Bond issuance costs related to prepaid insurance costs, bond premiums and discounts for
San Francisco International Airport, San Francisco Water Enterprise, Hetch Hetchy Water and Power,
SFMTA, and San Francisco Wastewater Enterprise are amortized over the life of the bonds using the
effective interest method. The remaining bond prepaid insurance costs, bond premiums and discounts
are calculated using the straight-line method. Bonds payable are reported net of the applicable bond
premium or discount.
In the fund financial statements, governmental funds recognize bond premiums and discounts as other
financing sources and uses, respectively. Issuance costs including bond insurance costs, whether or
not withheld from the actual debt proceeds received, are reported as debt service expenditures.
Interest accreted on capital appreciation bonds is reported as accrued interest payable in the
government-wide, proprietary fund and fiduciary fund financial statements.
(j) Fund Equity
Governmental Fund Balance
As prescribed by GASB Statement No. 54, Fund Balance Reporting and Governmental Fund Type
Definitions, governmental funds report fund balance in one of five classifications that comprise a
hierarchy based primarily on the extent to which the City is bound to honor constraints on the specific
purposes for which amounts in the funds can be spent. The five fund balance classifications are as
follows:
▪ Nonspendable – includes amounts that cannot be spent because they are either not in spendable
form or legally or contractually required to be maintained intact. The not in spendable form criterion
includes items that are not expected to be converted to cash, such as prepaid amounts, as well as
certain long-term receivables that would otherwise be classified as unassigned.
▪ Restricted – includes amounts that can only be used for specific purposes due to constraints
imposed by external resource providers, by the City’s Charter, or by enabling legislation.
Restrictions may effectively be changed or lifted only with the consent of resource providers.
▪ Committed – includes amounts that can only be used for specific purposes pursuant to an
ordinance passed by the Board of Supervisors and signed by the Mayor. Commitments may be
changed or lifted only by the City taking the same formal action that imposed the constraint
originally.
▪ Assigned – includes amounts that are not classified as nonspendable, restricted, or committed, but
are intended to be used by the City for specific purposes. Intent is expressed by legislation or by
action of the Board of Supervisors or the City Controller to which legislation has delegated the
authority to assign amounts to be used for specific purposes.
CITY AND COUNTY OF SAN FRANCISCO
Notes to Basic Financial Statements (Continued)
June 30, 2023
(Dollars in Thousands)
51
▪ Unassigned – is the residual classification for the General Fund and includes all amounts not
contained in the other classifications. Unassigned amounts are technically available for any
purpose. Other governmental funds may only report a negative unassigned balance that was
created after classification in one of the other four fund balance categories.
In circumstances when an expenditure is made for a purpose for which amounts are available in
multiple fund balance classifications, fund balance is generally depleted in the order of restricted,
committed, assigned, and unassigned.
Encumbrances
The City establishes encumbrances to record the amount of purchase orders, contracts, and other
obligations, which have not yet been fulfilled, cancelled, or discharged. Encumbrances outstanding at
year end are recorded as part of restricted or assigned fund balance.
Net Position
The government-wide and proprietary fund financial statements utilize a net position presentation. Net
position is categorized as net investment in capital assets, restricted, and unrestricted.
▪ Net Investment In Capital Assets – This category groups all capital assets, including infrastructure,
into one component of net position. Accumulated depreciation/amortization and the outstanding
balances of debt, including debt related deferred outflows and inflows of resources, that are
attributable to the acquisition, construction, or improvement of these assets reduce the balance in
this category.
▪ Restricted Net Position – This category represents net position that has external restrictions
imposed by creditors, grantors, contributors or laws or regulations of other governments and
restrictions imposed by law through constitutional provisions or enabling legislation.
▪ Unrestricted Net Position – This category represents net position of the City, not restricted for any
project or other purpose.
(k) Interfund Transfers
Interfund transfers are generally recorded as transfers in (out) except for certain types of transactions
that are described below.
▪ Charges for services are recorded as revenues of the performing fund and expenditures/expenses
of the requesting fund. Unbilled costs are recognized as an asset of the performing fund and a
liability of the requesting fund at the end of the fiscal year.
▪ Reimbursements for expenditures, initially made by one fund, which are properly applicable to
another fund, are recorded as expenditures in the reimbursing fund and as a reduction of
expenditures in the fund that is reimbursed.
(l) Refunding of Debt
In governmental and business-type activities and proprietary and fiduciary funds, losses or gains from
advance refundings are recorded as deferred outflows of resources and deferred inflows of resources,
respectively, and amortized into expense.
CITY AND COUNTY OF SAN FRANCISCO
Notes to Basic Financial Statements (Continued)
June 30, 2023
(Dollars in Thousands)
52
(m) Pollution Remediation Obligations
Pollution remediation obligations are measured at their current value using a cost-accumulation
approach, based on the pollution remediation outlays expected to be incurred to settle those
obligations. Each obligation or obligating event is measured as the sum of probability-weighted
amounts in a range of possible estimated amounts. Some estimates of ranges of possible cash flows
may be limited to a few discrete scenarios or a single scenario, such as the amount specified in a
contract for pollution remediation services.
(n) Cash Flows
Statements of cash flows are presented for proprietary fund types. Cash and cash equivalents include
all unrestricted and restricted highly liquid investments with original purchase maturities of three months
or less. Pooled cash and investments in the City’s Treasury represent monies in a cash management
pool and such accounts are similar in nature to demand deposits.
(o) Pensions
For purposes of measuring the net pension liability (asset) and deferred outflows/inflows of resources
related to pensions, and pension expense, information about the fiduciary net position of the SFERS
and the California Public Employees’ Retirement System (CalPERS) plans and additions to/deductions
from the plans’ fiduciary net position have been determined on the same basis as they are reported by
the plans. For this purpose, benefit payments (including refunds of employee contributions) are
recognized when due and payable in accordance with the benefit terms. Plan member contributions
are recognized in the period in which the contributions are due. Investments are reported at fair value.
(p) Other Postemployment Benefits (OPEB)
For purposes of measuring the net OPEB liability (asset) and deferred outflows/inflows of resources
related to OPEB, and OPEB expense, information about the fiduciary net position of the Retiree Health
Care Trust Fund (RHCTF) and California Employers’ Retiree Benefit Trust Fund Program (CERBT) and
additions to/deductions from the plans’ fiduciary net position have been determined on the same basis
as they are reported by the plans. For this purpose, benefit payments are recognized when due and
payable in accordance with the benefit terms. Plan member contributions are recognized in the period
in which the contributions are due. Investments are reported at fair value.
(q) Restricted Assets
Certain proceeds of the City’s governmental activities, enterprise and internal service funds bonds, as
well as certain resources set aside for their repayment, are classified as restricted assets on the
statement of net position because the use of the proceeds is limited by applicable bond covenants and
resolutions. Restricted assets account for the principal and interest amounts accumulated to pay debt
service, unspent bond proceeds, and amounts restricted for future capital projects.
(r) Deferred Outflows and Inflows of Resources
The City records deferred outflows or inflows of resources in its governmental, proprietary, fiduciary,
and government-wide financial statements. Deferred outflows of resources represent a consumption of
net assets that applies to future periods and deferred inflows of resources represent an acquisition of
net assets that applies to future periods.
In governmental fund statements, deferred inflows of resources consist of revenues not collected within
the availability period after fiscal year end. In government-wide financial statements, deferred outflows
and inflows of resources are recorded for unamortized losses and gains on refunding of debt, amounts
related to pensions and OPEB, lease-related items, and items related to public-private partnerships.
CITY AND COUNTY OF SAN FRANCISCO
Notes to Basic Financial Statements (Continued)
June 30, 2023
(Dollars in Thousands)
53
(s) Leases and Subscription-Based Information Technology Arrangements
Leases are defined as the right-to-use an underlying asset for a specified period. The City is a lessee
and lessor for various noncancellable leases. Subscription-based information technology arrangements
(SBITAs) are defined as a contract that conveys control of the right to use another entity’s IT software,
alone or in combination with tangible capital assets for a specified period. The City has noncancellable
subscription arrangements (similar to a lease) for the right to use various information technology
hardware and software (SBITAs).
Measurement of Lease Amounts as Lessee or Subscriber
As lessee or subscriber, the City recognizes a lease liability or subscription liability and an intangible
right-to-use asset at the beginning of a lease or subscription. The lease assets or subscription assets
are valued based on the net present value of the future lease payments or subscription payments at
inception, using the City’s incremental borrowing rate. For SBITAs, subscription assets also include
qualified software implementation costs. Subsequently, the lease asset or subscription asset is
amortized on a straight-line basis over the shorter of the lease or subscription term or the useful life of
the underlying asset. If the City is reasonably certain of exercising a purchase option contained in a
lease or SBITA, the lease asset or subscription asset will be amortized over the useful life of the
underlying asset.
Measurement of Lease Amounts as Lessor
As lessor, at the beginning of the lease term, the City recognizes a lease receivable based on the net
present value of future lease payments to be received for the lease term and a deferred inflow of
resources based on the net present value plus any payments received at or before the commencement
of the lease term that relate to future periods with certain exceptions for leases of assets held as
investments, certain regulated leases, short-term leases, and leases that transfer ownership of the
underlying asset. Amortization of the receivable is reported as lease and interest revenues. Deferred
inflows of resources are recognized as inflows on a straight-line basis over the term of the lease.
Remeasurement
The City monitors changes in circumstances that may require remeasurement of a lease or SBITA.
When certain changes occur that are expected to significantly affect the amount of the lease receivable,
lease liability or subscription liability, the receivable or liability is remeasured and a corresponding
adjustment is made to the deferred inflow of resources, lease asset or subscription asset, respectively.
Short-term Leases or SBITAs
For short-term lease contracts or SBITAs, generally those with a maximum possible term of 12 months
or less, the City recognizes revenue or expense based on the payment provisions of the lease contract
or SBITA. Liabilities are only recognized if payments are received in advance, and receivables are only
recognized if payments are received subsequent to the reporting period.
(t) Estimates
The preparation of financial statements in conformity with generally accepted accounting principles
requires management to make estimates and assumptions that affect certain reported amounts and
disclosures. Accordingly, actual results could differ from those estimates.
(u) Change in the Reporting Entity
In fiscal year 2023, the City re-evaluated the reporting of Mission Rock Special Tax District (STD) and
changed its reporting entity from a fiduciary component unit to a blended component unit (see Note 1).

CITY AND COUNTY OF SAN FRANCISCO
Notes to Basic Financial Statements (Continued)
June 30, 2023
(Dollars in Thousands)
54
The impact of the change in reporting entity resulted in restatement of assets, liabilities, net position,
and fund balance as of July 1, 2022, as follow:
Governmental
Activities
Total Primary
Government
Assets:
Deposits and investments outside City Treasury:
Cash and deposits.............................................. 11,529$ 11,529$
Receivables:
Interest and other................................................ 10 10
Liabilities:
Accounts payable.................................................... (181) (181)
Accrued interest payable......................................... (1,592) (1,592)
Bonds, loans, leases, and other payables.............. (112,107) (112,107)
Change in beginning net position (102,341)$ (102,341)$
Other
Governmental
Funds
Total
Governmental
Funds
Custodial
Funds
Total
Fiduciary
Funds
Assets:
Deposits and investments outside City Treasury:
Cash and deposits.............................................. 11,529$ 11,529$ (11,529)$ (11,529)$
Receivables:
Interest and other................................................ 10 10 (10) (10)
Liabilities:
Accounts payable.................................................... (181) (181) 181 181
Change in beginning fund balance 11,358$ 11,358$ (11,358)$ (11,358)$
Governmental Funds
Fiduciary Funds

CITY AND COUNTY OF SAN FRANCISCO
Notes to Basic Financial Statements (Continued)
June 30, 2023
(Dollars in Thousands)
55
(3) RECONCILIATION OF GOVERNMENT-WIDE AND FUND FINANCIAL STATEMENTS
(a) Explanation of certain differences between the governmental funds balance sheet and the
government-wide statement of net position
Total fund balances of the City's governmental funds, $6,503,462, differs from net position of governmental
activities, $5,522,546, reported in the statement of net position. The difference primarily results from the
long-term economic focus in the statement of net position versus the current financial resources focus in
the governmental funds balance sheet.
Total
Governmental
Funds
Long-term
Assets,
Liabilities
(1)
Internal
Service
Funds
(2)
Reclassi-
fications and
Eliminations
Statement of
Net Position
Totals
Assets
Deposits and investments with City Treasury........................... 7,862,490$ -$ 65,471$ -$ 7,927,961$
Deposits and investments outside City Treasury...................... 247,270 - 6,449 - 253,719
Receivables, net
Property taxes and penalties............................................... 190,786 - - - 190,786
Other local taxes................................................................ 387,442 - - - 387,442
Federal and state grants and subventions............................. 450,784 - - - 450,784
Charges for services............................................................ 151,870 - 219 - 152,089
Interest and other................................................................ 85,804 - 416 - 86,220
Leases.............................................................................. 81,413 - 7,174 - 88,587
Due from other funds............................................................. 22,528 - - (22,528) -
Due from component units..................................................... 13,096 - - - 13,096
Loans receivable, net............................................................. 216,166 - - - 216,166
Inventories............................................................................ 14,604 - - - 14,604
Capital assets, net................................................................ - 7,770,546 33,083 - 7,803,629
Net pension asset................................................................. - 17,362 - - 17,362
Other assets........................................................................ 24,253 101 - - 24,354
Total assets.............................................................. 9,748,506 7,788,009 112,812 (22,528) 17,626,799
Deferred outflows of resources
Unamortized loss on refunding of debt.................................. - 5,363 602 - 5,965
Pensions........................................................................... - 1,095,744 18,551 - 1,114,295
OPEB................................................................................ - 342,343 9,052 - 351,395
Total deferred outflows of resources……………………... - 1,443,450 28,205 - 1,471,655
Liabilities
Accounts payable............................................................... 669,517 - 10,594 - 680,111
Accrued payroll.................................................................. 199,899 - 3,681 - 203,580
Accrued vacation and sick leave pay.................................... - 240,637 5,605 - 246,242
Accrued workers' compensation........................................... - 376,450 1,340 - 377,790
Estimated claims payable................................................... - 415,686 - - 415,686
Accrued interest payable..................................................... - 22,446 906 - 23,352
Unearned grant and subvention revenues............................... 208,649 - - - 208,649
Due to other funds.............................................................. 96,597 - - (22,528) 74,069
Due to component unit........................................................ 38 - - - 38
Unearned revenues and other liabilities................................. 1,268,031 3,074 41 - 1,271,146
Bonds, loans, leases, and other payables............................. 38,790 4,936,247 112,867 - 5,087,904
Net pension liability............................................................. - 1,927,008 27,142 - 1,954,150
Net OPEB liability............................................................... - 2,013,027 44,150 - 2,057,177
Total liabilities........................................................... 2,481,521 9,934,575 206,326 (22,528) 12,599,894
Deferred inflows of resources
Unavailable revenue............................................................. 683,607 (683,607) - - -
Unamortized gain on refunding of debt.................................. - 79,334 202 - 79,536
Pensions........................................................................... - 395,744 5,662 - 401,406
OPEB................................................................................ - 393,917 8,207 - 402,124
Leases.............................................................................. 79,916 - 7,101 - 87,017
PPP.................................................................................. - 5,931 - - 5,931
Total deferred inflows of resources............................... 763,523 191,319 21,172 - 976,014
Fund balances/ net position
Total fund balances/ net position................................. 6,503,462$ (894,435)$ (86,481)$ -$ 5,522,546$

CITY AND COUNTY OF SAN FRANCISCO
Notes to Basic Financial Statements (Continued)
June 30, 2023
(Dollars in Thousands)
56
(1) When capital assets (land, infrastructure, buildings, equipment, and intangible
assets) that are to be used in governmental activities are purchased or constructed,
the costs of those assets are reported as expenditures in governmental funds.
However, the statement of net position includes those capital assets, net of
accumulated depreciation/amortization, among the assets of the City as a whole.
Cost of capital assets.…………………………………………………………………...$10,821,006
Accumulated depreciation/amortization ................................................................... (3,050,460)
$ 7,770,546
Long-term liabilities applicable to the City’s governmental activities are not due and
payable in the current period, and accordingly, are not reported as fund liabilities.
All liabilities, both current and long-term, are reported in the statement of net
position.
Accrued vacation and sick leave pay ....................................................................... $ (240,637)
Accrued workers’ compensation............................................................................... (376,450)
Estimated claims payable ......................................................................................... (415,686)
Arbitrage rebate liability ............................................................................................ (3,074)
Bonds, loans, leases, and other payables ................................................................ (4,936,247)
$(5,972,094)
Interest on long-term debt is not accrued in governmental funds, but rather is
recognized as an expenditure when due. $ (22,446)
Deferred outflows (inflows) of resources related to debt refundings in governmental
activities are not financial resources, and therefore, are not reported in the
governmental funds.
Unamortized loss on refunding of debt ..................................................................... $ 5,363
Unamortized gain on refunding of debt .................................................................... (79,334)
$ (73,971)
Net pension asset is not received in the current period and, therefore, is not
reported in the governmental funds. Net pension liability is not due and payable in
the current period, and accordingly is not reported as a fund liability. Deferred
outflows (inflows) of resources related to pensions are not financial resources, and
therefore, are not reported in the governmental funds.
Net pension asset ..................................................................................................... $ 17,362
Net pension liability ................................................................................................... (1,927,008)
Deferred outflows of resources related to pensions ................................................. 1,095,744
Deferred inflows of resources related to pensions ................................................... (395,744)
$(1,209,646)
Net OPEB asset is not received in the current period and, therefore, is not reported
in the governmental funds. Net OPEB liability is not due and payable in the current
period, and accordingly is not reported as a fund liability. Deferred outflows (inflows)
of resources related to OPEB are not financial resources, and therefore, are not
reported in the governmental funds.
Net OPEB asset ....................................................................................................... $ 101
Net OPEB liability ..................................................................................................... (2,013,027)
Deferred outflows of resources related to OPEB ..................................................... 342,343
Deferred inflows of resources related to OPEB ........................................................ (393,917)
$(2,064,500)

CITY AND COUNTY OF SAN FRANCISCO
Notes to Basic Financial Statements (Continued)
June 30, 2023
(Dollars in Thousands)
57
Because the focus of governmental funds is on the availability of resources, some
assets will not be available to pay for current period expenditures and thus are not
included in fund balance.
Revenue not collected within 60 days of the end of the current fiscal period .......... $ 683,607
PPP ........................................................................................................................... (5,931)
$ 677,676
(2) Internal service funds are used by management to charge the costs of certain
activities, such as lease financing, equipment maintenance services, printing and
mailing services, and telecommunications and information systems, to individual
funds. The assets and liabilities of the internal service funds are included in
governmental activities in the statement of net position.
Net position before adjustments ..................................................................................... $ (5,728)
Adjustments for internal balances with the San Francisco Finance Corporation:
Receivables from other governmental and enterprise funds .................................... (83,293)
Unearned revenues and other liabilities ................................................................... 2,540
$ (86,481)

CITY AND COUNTY OF SAN FRANCISCO
Notes to Basic Financial Statements (Continued)
June 30, 2023
(Dollars in Thousands)
58
(b) Explanation of certain differences between the governmental funds statement of revenues,
expenditures, and changes in fund balances and the government-wide statement of
activities
The net change in fund balances for governmental funds, $(287,566), differs from the change in net
position for governmental activities, $288,689, reported in the statement of activities. The differences
arise primarily from the long-term economic focus in the statement of activities versus the current
financial resources focus in the governmental funds. The effect of the differences is illustrated below.
Total
Governmental
Funds
Long-term
Revenues/
Expenses (3)
Capital-
related
Items (4)
Internal
Service
Funds (5)
Long-term
Debt
Transactions (6)
Statement of
Activities
Totals
Revenues
Property taxes............................................................ 3,157,038$ 10,344$ -$ -$ -$ 3,167,382$
Business taxes............................................................ 1,290,918 - - - - 1,290,918
Sales and use tax....................................................... 309,385 - - - - 309,385
Hotel room tax............................................................ 278,961 - - - - 278,961
Utility users tax........................................................... 110,661 - - - - 110,661
Parking tax................................................................. 82,716 - - - - 82,716
Real property transfer tax............................................ 186,247 - - - - 186,247
Other local taxes......................................................... 295,790 - - - - 295,790
Licenses, permits and franchises.................................. 43,156 1 - - - 43,157
Fines, forfeitures, and penalties................................... 44,322 102 - - - 44,424
Interest and investment income ................................... 156,887 - - 380 - 157,267
Rents and concessions................................................ 184,208 149 - - - 184,357
Intergovernmental:
Federal.................................................................... 635,680 605 - - - 636,285
State....................................................................... 1,293,904 13,792 - 58 - 1,307,754
Other....................................................................... 8,938 497 - 167 - 9,602
Charges for services................................................... 387,553 179 - - - 387,732
Other......................................................................... 207,346 41,826 40,055 52 - 289,279
Total revenues.................................................. 8,673,710 67,495 40,055 657 - 8,781,917
Expenditures/ Expenses
Current:
Public protection....................................................... 1,749,187 (96,425) 20,486 (1,546) - 1,671,702
Public works, transportation and commerce................ 505,421 (30,426) (28,709) - - 446,286
Human welfare and neighborhood development........... 2,998,446 (33,182) (81,839) - - 2,883,425
Community health..................................................... 1,168,603 (13,038) 50,749 - - 1,206,314
Culture and recreation............................................... 513,127 (9,998) 48,992 (14,728) - 537,393
General administration and finance............................ 439,767 (13,612) 56,463 - - 482,618
Distributions to other governments............................. 49,113 - - - - 49,113
General City responsibilities...................................... 189,570 84 - (14,132) - 175,522
Debt service:
Principal retirement………………………………........... 400,960 - - - (400,960) -
Interest and other fiscal charges……………………… 181,463 - - 2,798 (34,259) 150,002
Bond issuance costs…………………………………….. 5,747 - - - - 5,747
Capital outlay.............................................................. 220,917 - (220,917) - - -
Total expenditures............................................. 8,422,321 (196,597) (154,775) (27,608) (435,219) 7,608,122
Excess (deficiency) of revenues over (under)
expenditures…………………………………......
251,389 264,092 194,830 28,265 435,219 1,173,795
Other financing sources (uses) /
changes in net position
Net transfers in (out)................................................... (885,327) - - 221 - (885,106)
Issuance of bonds:
Face value of bonds issued....................................... 267,975 - - - (267,975) -
Premium on issuance of bonds.................................. 6,364 - - - (6,364) -
Inception of lease and subscriptions............................. 72,033 - - - (72,033) -
Total other financing sources (uses)................... (538,955) - - 221 (346,372) (885,106)
Net change for the year.................................. (287,566)$ 264,092$ 194,830$ 28,486$ 88,847$ 288,689$

CITY AND COUNTY OF SAN FRANCISCO
Notes to Basic Financial Statements (Continued)
June 30, 2023
(Dollars in Thousands)
59
(3) Property taxes are recognized as revenues in the period the amount becomes
available. This is the current period amount by which the deferred inflows of
resources increased in the governmental funds. $ 10,344
Other revenues that were unavailable are reported as deferred inflows of
resources in the governmental funds. This is the current period amount by which
deferred inflows of resources increased in the governmental funds. 57,151
$ 67,495
Some expenses reported in the statement of activities do not require the use of
current financial resources and therefore are not reported as expenditures in
governmental funds. Certain long-term liabilities reported in the prior year
statement of net position were paid during the current period resulting in
expenditures in the governmental funds. This is the amount by which the increase
in long-term liabilities exceeded expenditures in funds that do not require the use
of current financial resources. $ 532,057
Changes to net pension asset/liability and pension related deferred outflows and
inflows of resources do not provide financial resources and, therefore, are not
reported as expenditures in governmental funds. (340,404)
Changes to net OPEB asset/liability and OPEB related deferred outflows and
inflows of resources do not provide financial resources and, therefore, are not
reported as expenditures in governmental funds. 4,930
Governmental funds report revenues and expenditures primarily pertaining to long-
term loan activities, which are not reported in the statement of activities. These
activities are reported at the government-wide level in the statement of net position.
This is the net revenues reported in the governmental funds. 14
$ 196,597
(4) When capital assets that are to be used in governmental activities are purchased
or constructed, the resources expended for those assets are reported as
expenditures in governmental funds. However, in the statement of activities, the
cost of those assets is allocated over their estimated useful lives and reported as
depreciation/amortization expense. As a result, fund balance decreases by the
amount of financial resources expended, whereas net position decreases by the
amount of depreciation expense charged for the year and the loss on disposal of
capital assets.
Capital expenditures ................................................................................................. $ 538,086
Depreciation expense ............................................................................................... (337,807)
Loss on disposal of capital assets ............................................................................ (396)
Gain on lease termination ......................................................................................... 161
Write-off of construction in progress ......................................................................... (5,214)
Difference ........................................................................................................... $ 194,830
(5) Internal service funds are used by management to charge the costs of certain
activities, such as lease financing, equipment maintenance services, printing and
mailing services, and telecommunications and information systems to individual
funds. The adjustments for internal service funds “close” those funds by charging
additional amounts to participating governmental activities to completely cover the
internal service funds’ costs for the year. $ 28,486

CITY AND COUNTY OF SAN FRANCISCO
Notes to Basic Financial Statements (Continued)
June 30, 2023
(Dollars in Thousands)
60
(6) Bond premiums are a source of funds in the governmental funds when the bonds
are issued, but are capitalized in the statement of net position. This is the amount
of premiums capitalized during the current period. $ (6,364)
Repayment of bond, loans and other debt, lease and subscription principal are
reported as expenditures in governmental funds and, thus, have the effect of
reducing fund balance because current financial resources have been used. For
the City as a whole, however, the principal payments reduce the liabilities in the
statement of net position and do not result in expenses in the statement of activities.
The City's bonded debt was reduced because principal payments were made to
bond holders.
Bond and other debt principal payments made ........................................................ $ 334,253
Lease principal payments made ............................................................................... 61,744
Subscription principal payments made ..................................................................... 4,963
400,960
Bond, lease, and subscription proceeds are reported as other financing sources in
governmental funds and thus contribute to the change in fund balance. In the
government-wide statements, however, issuing debt increases long-term liabilities
in the statement of net position and does not affect the statement of activities.
Proceeds were received from:
General obligation bonds .......................................................................................... $ (238,585)
Increment tax bonds.................................................................................................. (29,390)
Leases ....................................................................................................................... (70,997)
Subscriptions ............................................................................................................. (1,036)
(340,008)
$ 60,952
Interest expense in the statement of activities differs from the amount reported in
governmental funds because (1) additional accrued and accreted interest was
calculated for bonds, loans, leases and other payables, and (2) amortization of
bond premiums and refunding losses and gains are not expended within the fund
statements.
Increase in accrued interest ..................................................................................... $ (434)
Amortization of bond premiums ................................................................................ 28,692
Amortization of bond refunding losses and gains..................................................... 9,075
Increase in arbitrage rebate liability .......................................................................... (3,074)
$ 34,259

CITY AND COUNTY OF SAN FRANCISCO
Notes to Basic Financial Statements (Continued)
June 30, 2023
(Dollars in Thousands)
61
(4) EFFECTS OF NEW ACCOUNTING PRONOUNCEMENTS
During fiscal year 2023, the City implemented the following accounting standards:
In May 2019, the GASB issued Statement No. 91, Conduit Debt Obligations. GASB Statement No. 91
clarifies the definition of conduit debt and establishes new recognition, measurement, and disclosure
requirements. The new standard is effective for periods beginning after December 15, 2021. As a result,
the City restated the deferred inflows and beginning net position of the San Franciso International
Airport in the City’s Business-Type Activities and major enterprise fund as of July 1, 2022 to increase
deferred inflows and decrease net position by $106.6 million.
In March 2020, the GASB issued Statement No. 94, Public-Private and Public-Public Partnerships and
Availability Payment Arrangements. GASB Statement No. 94 establishes standards for public-private
and public-public partnerships (PPPs) and availability payment arrangements. A PPP is an
arrangement in which a government contracts with an operator to provide public services by conveying
control of the right to operate or use a nonfinancial asset, such as infrastructure or other capital asset
(the underlying PPP asset), for a period of time in an exchange or exchange-like transaction. An
availability payment arrangement is an arrangement in which a government compensates an operator
for services that may include designing, constructing, financing, maintaining, or operating an underlying
nonfinancial asset for a period of time in an exchange or exchange-like transaction. The new standard
requires reporting of related assets and deferred inflows that currently are not reported and is effective
for periods beginning after June 15, 2022. As a result, the City restated its beginning balances as of
July 1, 2022 as follows:
In May 2020, the GASB issued Statement No. 96, Subscription-Based Information Technology
Arrangements. GASB Statement No. 96 defines such arrangements as contracts that convey control
of the right to use another party’s information technology software, alone or in combination with tangible
capital assets, as specified in the contract for a period of time in an exchange or exchange-like
transaction. The standard clarifies measurement and recognition of capitalizable costs, intangible
assets, and subscription liabilities for such arrangements and also requires additional disclosures
related to such arrangements. As a result, the City restated its beginning balances as of July 1, 2022
as follows:
Governmental
Activities
Total Primary
Government
Building/Facility........................................................ 3,378$ 3,378$
Equipment................................................................ 277 277
Infrastructure............................................................ 1,046 1,046
Deferred inflows related to PPP.............................. (4,701) (4,701)
Governmental
Activities
Business-Type
Activities
Total Primary
Government
Right-to-use assets, net............................................. 49,277$ 3,696$ 52,973$
Subscription liabilities................................................ (44,098) (3,653) (47,751)
Accrued interest........................................................ - (26) (26)
Change in beginning net position................................ 5,179$ 17$ 5,196$
CITY AND COUNTY OF SAN FRANCISCO
Notes to Basic Financial Statements (Continued)
June 30, 2023
(Dollars in Thousands)
62
In April 2022, the GASB issued Statement No. 99, Omnibus 2022. GASB Statement No. 99 addresses
a variety of topics. The requirements related to extension of the use of the London Interbank Offered
Rate, accounting for Supplemental Nutrition Assistance Program distributions, disclosures of
nonmonetary transactions, pledges of future revenues by pledging governments, clarification of certain
provisions in Statement No. 34, and terminology updates related to Statement No. 53 and Statement
No. 63 were adopted by the City for the year ended June 30, 2022. The requirements related to leases,
public-public and public-private partnerships, and subscription-based information technology
arrangements are effective for fiscal years beginning after June 15, 2022 and did not have a significant
impact on the City’s for the year ended June 30, 2023. The City is currently analyzing its accounting
practices to determine the potential impact of the requirements related to financial guarantees and the
classification and reporting of derivative instruments within the scope of Statement No. 53 which are
effective for fiscal years beginning after June 15, 2023 and effective for the City’s year ending June 30,
2024.
In addition, the City is currently analyzing its accounting practices to determine the potential impact of
the following pronouncements:
In June 2022, the GASB issued Statement No. 100, Accounting Changes and Error Corrections. GASB
Statement No. 100 defines various types of accounting changes and prescribes accounting, reporting,
and disclosure requirements for accounting changes and error corrections. The new standard is
effective for periods beginning after June 15, 2023. Application of this statement is effective for the
City’s year ending June 30, 2024.
In June 2022, the GASB issued Statement No. 101, Compensated Absences. GASB Statement No.
101 requires that liabilities for compensated absences be recognized if the leave is attributable to
services already rendered and the leave is more likely than not to be used for time off or otherwise paid
in cash or settled through noncash means and establishes definitions, guidance, and disclosure
requirements related to compensated absences. The new standard is effective for periods beginning
after December 15, 2023. Application of this statement is effective for the City’s year ending June 30,
2025.

CITY AND COUNTY OF SAN FRANCISCO
Notes to Basic Financial Statements (Continued)
June 30, 2023
(Dollars in Thousands)
63
(5) DEPOSITS AND INVESTMENTS
(a) Cash, Deposits and Investments Presentation
Total City cash, deposits and investments, at fair value, are as follows:
(b) Investment Policies
Treasurer’s Pool
The City’s investment policy addresses the Treasurer’s safekeeping and custody practices with
financial institutions in which the City deposits funds, types of permitted investment instruments, and
the percentage of the portfolio which may be invested in certain instruments with longer terms to
maturity. The objectives of the policy, in order of priority, are safety, liquidity, and earning a market rate
of return on public funds. The City has established a Treasury Oversight Committee (Oversight
Committee) as defined in the City Administrative Code section 10.80-3, comprised of various City
officials, representatives of agencies with large cash balances, and members of the public, to monitor
and review the management of public funds maintained in the investment pool in accordance with
Sections 27130 to 27137 of the California Government Code. The Treasurer prepares and submits an
investment report to the Mayor, the Board of Supervisors, members of the Oversight Committee and
the investment pool participants every month. The report covers the type of investments in the pool,
maturity dates, par value, actual cost, and fair value.
The investment policy places maturity limits based on the type of security. Investments held by the
Treasurer during the year did not include repurchase agreements or reverse repurchase agreements.
The table below identifies the investment types that are authorized by the City’s investment policy dated
May 2021.
The table also identifies certain provisions of the City’s investment policy that address interest rate risk
and concentration of credit risk.

CITY AND COUNTY OF SAN FRANCISCO
Notes to Basic Financial Statements (Continued)
June 30, 2023
(Dollars in Thousands)
64
The Treasurer also holds for safekeeping bequests, trust funds, and lease deposits for other City
departments. The bequests and trust funds consist of stocks and debentures. Those instruments are
valued at par, cost, or fair value at the time of donation.
Other Funds
Other funds consist primarily of deposits and investments with trustees related to the issuance of bonds
and to certain loan programs operated by the City. These funds are invested either in accordance with
bond covenants and are pledged for payment of principal, interest, and specified capital improvements
or in accordance with grant agreements and may be restricted for the issuance of loans.
Employees’ Retirement System
The Retirement System’s investments are invested pursuant to investment policy guidelines as
established by the Retirement Board. The objective of the policy is to maximize the expected return of
the fund at an acceptable level of risk. The Retirement Board has established percentage guidelines
for types of investments to ensure the portfolio is diversified.
Investment managers retained by the Retirement System follow specific investment guidelines and are
evaluated against specific market benchmarks that represent their investment style. Any exemption
from general guidelines requires approval from the Retirement Board. The Retirement System invests
in securities with contractual cash flows, such as asset-backed securities, commercial mortgage-
backed securities, and collateralized mortgage obligations. The value, liquidity, and related income of
these securities are sensitive to changes in economic conditions, including real estate values,
delinquencies or defaults, or both, and may be affected by shifts in the market’s perception of the
issuers and changes in interest rates.
The investment policy permits investments in domestic and international debt and equity securities,
securities lending, foreign currency contracts, derivative instruments, private equity, real assets, private
credit, and absolute return investments, which include investments in a variety of commingled
partnership vehicles.
Authorized Investment Type
Maximum
Maturity
Maximum
Percentage
of Portfolio
Maximum
Investment
in One
Issuer
U.S. Treasuries
5 years
100%
100%
Federal Agencies
5 years
100%
100%
State and Local Government Agency Obligations
5 years
20% *
5% *
Public Time Deposits
13 months *
None
None
Negotiable Certificates of Deposit/Yankee Certificates
of Deposit
5 years
30%
None
Bankers Acceptances
180 days
40%
30%
Commercial Paper
270 days
25% *
10%
Medium Term Notes
4-5 years*
5%*
10%*
3-4 years*
5%*
10%*
2-3 years*
5%*
10%*
Up to 2
years*
Up to 30%
10%*
Repurchase Agreements (Government Securities)
1 year
None
None
Repurchase Agreements (Securities permitted by CA
Government Code, Sections 53601 and 53635)
1 year
10%
None
Reverse Repurchase Agreements / Securities Lending
45 days *
None
$75 million *
Money Market (Institutional Government Funds)
N/A
20%
N/A
Supranationals
5 years
30%
None
State of California Local Agency Investment Fund
(LAIF)
N/A
Statutory
None
* Represents restriction on which the City’s investment policy is more restrictive than the California
Government Code.

CITY AND COUNTY OF SAN FRANCISCO
Notes to Basic Financial Statements (Continued)
June 30, 2023
(Dollars in Thousands)
65
The Retirement Board’s asset allocation policies for the year ended June 30, 2023, are as follow:
The Retirement System is not directly involved in repurchase or reverse repurchase agreements.
However, external investment managers retained by the Retirement System may employ repurchase
arrangements if the securities purchased or sold comply with the manager’s investment guidelines. The
Retirement System monitors the investment activity of its investment managers to ensure compliance
with guidelines. In addition, the Retirement System’s securities lending cash collateral separately
managed account is authorized to use repurchase arrangements. As of June 30, 2023, $166,626 (or
29.6% of reinvested cash collateral) consisted of such agreements.
Retiree Health Care Trust Fund (RHCTF)
The RHCTF maintains cash in the Treasurer’s Pool. The RHCTF’s investments outside of the City
Treasury are invested pursuant to investment policy guidelines as established by the RHCTF Board.
The investment strategy of the RHCTF is designed to ensure the prudent investment of assets in such
a manner as to provide real growth of assets over time while protecting the value of the assets from
undue volatility or risk of loss. The RHCTF allocates its investments among numerous investment
managers and in accordance with the investment policy approved by the RHCTF Board.
At its February 13, 2023 Board Meeting, the RHCTF Board approved a revised asset allocation policy
for the City and County’s Sub-Trust.
The asset allocation policy remains the same for the Community College District’s Sub-Trust since May
2021. For the Community College District’s Sub-Trust, the RHCTF Board anticipated that illiquid
investments will not be appropriate given the portfolio liquidity needs. The current allocation offers a
higher liquidity, lower risk levels profile for the Community College.

CITY AND COUNTY OF SAN FRANCISCO
Notes to Basic Financial Statements (Continued)
June 30, 2023
(Dollars in Thousands)
66
The RHCTF Board has established percentage guidelines for types of investments to ensure the
portfolio is diversified, as follows:
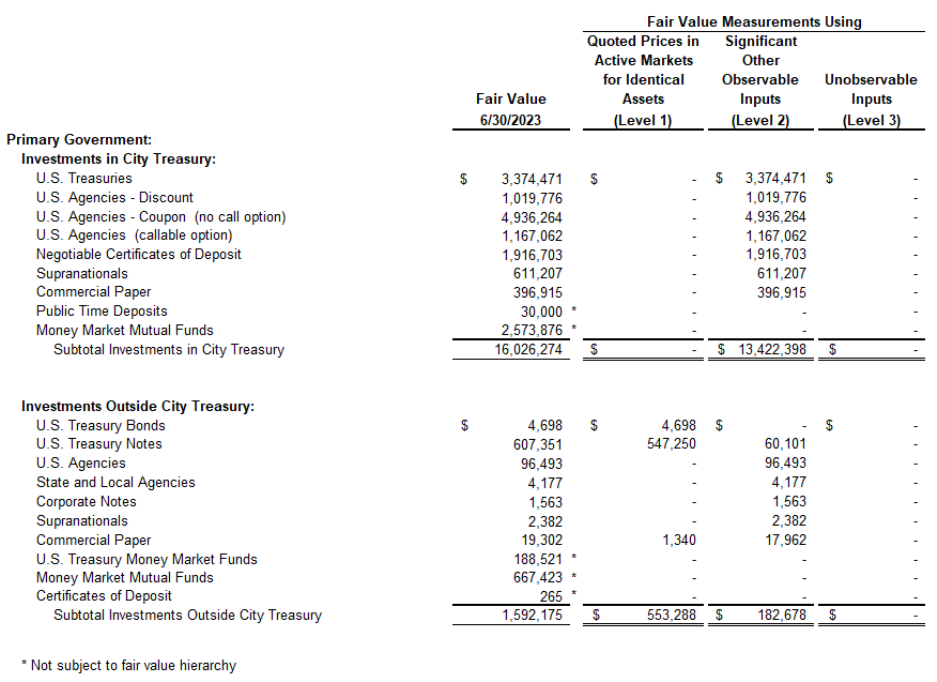
CITY AND COUNTY OF SAN FRANCISCO
Notes to Basic Financial Statements (Continued)
June 30, 2023
(Dollars in Thousands)
67
(c) Fair Value Hierarchy
The City categorizes its fair value measurements within the fair value hierarchy established by generally
accepted accounting principles. The hierarchy is based on the valuation inputs used to measure fair
value of the assets. Level 1 inputs are quoted prices in an active market for identical assets; Level 2
inputs are significant other observable inputs; and Level 3 inputs are significant unobservable inputs
(the City's Treasury pool and investments held by fiscal agents do not value any of its investments
using Level 3 inputs). The inputs or methodology used for valuing securities are not an indication of
risk associated with investing in those securities.
The following is a summary of inputs used in valuing the City’s investments as of June 30, 2023:

CITY AND COUNTY OF SAN FRANCISCO
Notes to Basic Financial Statements (Continued)
June 30, 2023
(Dollars in Thousands)
68
Investments Held in City Treasury
U.S. Treasury Bills and Notes totaling $3.37 billion, U.S. Government Agencies totaling $7.12 billion,
Negotiable Certificates of Deposit totaling $1.92 billion, Supranationals totaling $611.2 million and
Commercial Paper totaling $396.9 million, in fiscal year 2023, are valued using a variety of techniques
such as matrix pricing, market corroborated pricing inputs such as yield curve, indices, and other market
related data and are classified in Level 2 of the fair value hierarchy.
Public Time Deposits totaling $30.0 million and Money Market Funds totaling $2.57 billion, in fiscal year
2023, have maturities of one year or less from fiscal year end and are exempt from Statement No. 72.
CITY AND COUNTY OF SAN FRANCISCO
Notes to Basic Financial Statements (Continued)
June 30, 2023
(Dollars in Thousands)
69
Investments Held Outside City Treasury
Debt securities classified in Level 1 are valued using quoted prices in active markets and classified in
Level 1 of the fair value hierarchy. Debt securities classified in Level 2 are valued using a variety of
techniques such as matrix pricing, market corroborated pricing inputs such as yield curve, indices, and
other market related data and classified in Level 2. Certain investments such as Money Market Mutual
Funds and Certificates of Deposit are not subject to the fair value hierarchy.
Employees’ Retirement System Investments
Investments at Fair Value
Fair value is defined as the price that would be received to sell an asset or paid to transfer a liability in
an orderly transaction between market participants at the measurement date. In some cases, a
valuation technique may have multiple inputs used to measure fair value, and each input might fall into
a different level of the fair value hierarchy. The level in the fair value hierarchy within which a fair value
measurement falls in its entirety is determined based on the lowest level input that is significant to the
measurement. The prices used in determining the fair value hierarchy are obtained from various pricing
sources by the Retirement System’s custodian bank.
Debt and equity securities classified in Level 1 of the fair value hierarchy are valued using prices quoted
in active markets. Debt and equity securities classified in Level 2 of the fair value hierarchy are valued
using prices determined by the use of matrix pricing techniques maintained by the various pricing
vendors for these securities. Debt securities including short-term instruments are priced based on
evaluated prices. Such evaluated prices may be determined by factors which include, but are not limited
to, market quotations, yields, maturities, call features, ratings, institutional size trading in similar groups
of securities and developments related to specific securities. For equity securities not traded on an
active exchange, or if the closing price is not available, corroborated indicative quotes obtained from
pricing vendors are generally used. Debt and equity securities classified in Level 3 of the fair value
hierarchy are securities whose stated market prices are unobservable by the market place. Many of
these securities are priced using uncorroborated indicative quotes, adjusted prices based on inputs
from different sources, or evaluated prices using unobservable inputs, such as extrapolated data,
proprietary models, and indicative quotes from pricing vendors.
Investments at Net Asset Value (NAV)
The equity and debt funds are commingled funds that are priced at net asset value by industry vendors
and fund families. NAV is the fair value of all securities owned by a fund, minus its total liabilities, divided
by the number of shares issued and outstanding. The NAV of an open-end fund is its price.
The fair value of the Retirement System’s investments in private equity, real assets, private credit,
absolute return, and some public equity investments are based on NAV provided by the investment
managers and general partners (hereinafter collectively referred to as the “General Partners”). Such
value generally represents the Retirement System’s proportionate share of the net assets of the limited
partnerships. The partnership financial statements are audited annually as of December 31 and the
NAV is adjusted by additional contributions to and distributions from the partnership, the Retirement
System’s share of net earnings and losses, and unrealized gains and losses resulting from changes in
fair value, as determined by the General Partners.
CITY AND COUNTY OF SAN FRANCISCO
Notes to Basic Financial Statements (Continued)
June 30, 2023
(Dollars in Thousands)
70
The General Partners may use one or more valuation methodologies outlined in FASB ASC 820, Fair
Value Measurement. For some investments, little market activity may exist. The General Partners’
determination of fair value is then based on the best information available in the circumstances and
may involve subjective assumptions and estimates, including the General Partners’ assessment of the
information that market participants would use in valuing the investments. The General Partners may
take into consideration a combination of internal and external factors, including but not limit to,
appropriate risk adjustments for nonperformance and liquidity. Such fair value estimates involve
subjective judgments of unrealized gains and losses.
The values provided by the General Partners may differ significantly from the values that would have
been used had a ready market existed for these investments.
Private credit investment strategies include capital preservation, return maximization and opportunistic.
Investments in the asset class are achieved through commingled funds and separate account
partnerships. Private credit investments are mostly illiquid and distributions are received over the life of
the investments. These investments are not typically redeemed, nor do they have set redemption
schedules. There are seventeen public equity investments held in commingled funds valued at NAV.
Two investments, value at $175.5 million, are currently put in full redemption with proceeds expected
in the next fiscal year. The remaining investments may be subject to varying lock-up provisions and
redemption schedules. The real asset holdings are illiquid. Distributions are received over the life of the
investments, which could equal or exceed ten years. They are not redeemed, nor do they have set
redemption schedules. Private equity investment strategies include buyout, venture capital, growth
capital, and special situations. Investments in the asset class are achieved primarily through
commingled funds and separate account partnerships, but may also include direct and co-investment
opportunities. Private equity investments are illiquid and distributions are received over the life of the
investments, which could equal or exceed ten years. These investments are not typically redeemed,
nor do they have set redemption schedules.
Absolute return investment strategies include equity, credit, macro, emerging markets, quantitative,
multi-strategy, special situations/other, co-investments and commodities. Investments are achieved
through limited partnerships. Investments have the potential to become illiquid under stressed market
conditions and, in certain circumstances, investors may be subject to redemption restrictions that differ
from the standard terms and conditions summarized here, which can impede the return of capital
according to those terms and conditions.

CITY AND COUNTY OF SAN FRANCISCO
Notes to Basic Financial Statements (Continued)
June 30, 2023
(Dollars in Thousands)
71
The table below provides a summary of the terms and conditions upon which the Retirement System
may redeem its debt and equity funds, private equity, real assets, private credit, and absolute return
investments.
CITY AND COUNTY OF SAN FRANCISCO
Notes to Basic Financial Statements (Continued)
June 30, 2023
(Dollars in Thousands)
72
Retiree Health Care Trust Fund
Investments at Net Asset Value (NAV)
At June 30, 2023, the RHCTF had cash and investments in the City Treasury pool, commingled funds,
mutual funds, feeder funds, and money market funds. The funds are priced at net asset value (NAV)
by industry vendors and fund families. NAV is the fair value of all securities owned by a fund, minus its
total liabilities, divided by the number of shares issued and outstanding. As of June 30, 2023, one debt
security investment, valued at $64.3 million, has quarter-end redemptions with a 90 day advance written
notice requirement. In addition, one international equity investment, valued at $111.9 million, has
weekly redemptions with a three-day advance notification requirement. Both investments have 5%
holdbacks for a full liquidation. In addition, $96.8 million of RHCTF’s risk mitigating strategies allows
redemptions on a weekly basis with four-day notice. There are no redemption restrictions for the
remaining commingled funds.
The fair value of the RHCTF’s investments in private equity and real estate are based on NAV provided
by the investment managers and general partners (hereinafter collectively referred to as the “General
Partners”). Such value generally represents the RHCTF’s proportionate share of the net assets of the
limited partnerships. The partnership financial statements are audited annually as of December 31 and
the NAV is adjusted by additional contributions to and distributions from the partnership, the RHCTF’s
share of net earnings and losses, and unrealized gains and losses resulting from changes in fair value,
as determined by the General Partners. The General Partners may use one or more valuation
methodologies outlined in FASB ASC 820, Fair Value Measurement. For some investments, little
market activity may exist. The General Partners’ determination of fair value is then based on the best
information available in the circumstances and may involve subjective assumptions and estimates,
including the General Partners’ assessment of the information that market participants would use in
valuing the investments. The General Partners may take into consideration a combination of internal
and external factors, including but not limit to, appropriate risk adjustments for nonperformance and
liquidity. Such fair value estimates involve subjective judgments of unrealized gains and losses.
The values provided by the General Partners may differ significantly from the values that would have
been used had a ready market existed for these investments.
(d) Investment Risks
Custodial Credit Risk - Deposits
Custodial credit risk for deposits is the risk that, in the event of the failure of a depository financial
institution, the City will not be able to recover its deposits or will not be able to recover collateral
securities that are in the possession of an outside party. The California Government Code and the
City’s investment policy do not contain legal or policy requirements that would limit the exposure to
custodial credit risk for deposits.
The California Government Code requires California banks and savings and loan associations to
secure the City’s deposits not covered by FDIC insurance by pledging government and/or local agency
securities as collateral. The fair value of such pledged securities must equal at least 110% and be of
the type authorized in California Government Code, Section 53651 (a) through (i). The collateral must
be held at the pledging bank’s trust department or another bank, acting as the pledging bank’s agent,
in the City’s name. At June 30, 2023, all banks with funds deposited by the Treasurer secured deposits
with sufficient collateral or FDIC insurance.

CITY AND COUNTY OF SAN FRANCISCO
Notes to Basic Financial Statements (Continued)
June 30, 2023
(Dollars in Thousands)
73
Interest Rate Risk
Interest rate risk is the risk that changes in market interest rates will adversely affect the fair value of
an investment. Generally, the longer the maturity of an investment, the greater the sensitivity of its fair
value to changes in interest rates. Information about the sensitivity to the fair values of the City’s
investments to interest rate fluctuations is provided by the following tables, which shows the distribution
of the City’s investments by maturity. The Retirement System’s and Retiree Health Care Trust Fund’s
interest rate risk information is discussed in sections (f) and (g), respectively, of this note.
As of June 30, 2023, the investments in the City Treasury had a weighted average maturity of 442 days.
CITY AND COUNTY OF SAN FRANCISCO
Notes to Basic Financial Statements (Continued)
June 30, 2023
(Dollars in Thousands)
74
Credit Risk
Credit risk is the risk that an issuer of an investment will not fulfill its obligation to pay the holder of the
investment. This is measured by the assignment of a rating by a nationally recognized statistical rating
organization. The S&P Global Ratings (S&P) rating for each of the investment types are shown in the
table above.
Custodial Credit Risk - Investments
Custodial credit risk for investments is the risk that, in the event of the failure of the counterparty to a
transaction, the City will not be able to recover the value of its investment or collateral securities that
are in the possession of another party. The California Government Code and the City’s investment
policy do not contain legal or policy requirements that would limit the exposure to custodial credit risk
for investments; however, it is the practice of the City Treasurer that all investments are insured,
registered or held by the Treasurer’s custodial agent in the City’s name. The governmental and
business-type activities also have investments with trustees related to the issuance of bonds that are
uninsured, unregistered and held by the counterparty’s trust departments but not in the City’s name.
These amounts are included in the investments outside City Treasury shown in the table above.
Concentration of Credit Risk
The City’s investment policy contains no limitations on the amount that can be invested in any one
issuer beyond that stipulated by the California Government Code and/or its investment policy. U.S.
Treasury and agency securities explicitly guaranteed by the U.S. government are not subject to single
issuer limitation.
As of June 30, 2023, the City Treasurer has investments that represent 5.0% or more of the total Pool
in the following:
Federal Farm Credit Bank ................................................................. 20.5%
Federal Home Loan Bank ................................................................. 18.4%
In addition, the following major fund holds investments with trustees that represent 5.0% or more of the
funds’ investments outside City Treasury as of June 30, 2023:
Airport:
Federal National Mortgage Association ....................................... 6.6%

CITY AND COUNTY OF SAN FRANCISCO
Notes to Basic Financial Statements (Continued)
June 30, 2023
(Dollars in Thousands)
75
(e) Treasurer’s Pool
The following represents a condensed statement of net position and changes in net position for the
Treasurer’s Pool as of and for the year ended June 30, 2023:
The following provides a summary of key investment information for the Treasurer’s Pool as of
June 30, 2023:

CITY AND COUNTY OF SAN FRANCISCO
Notes to Basic Financial Statements (Continued)
June 30, 2023
(Dollars in Thousands)
76
(f) Retirement System’s Investments
The Retirement System’s investments as of June 30, 2023, are summarized as follows:
Interest Rate Risk
The Retirement System does not have a specific policy to manage interest rate risk. Below is a table
depicting the segmented time distribution for fixed income investments based upon the expected
maturity (in years) as of June 30, 2023:

CITY AND COUNTY OF SAN FRANCISCO
Notes to Basic Financial Statements (Continued)
June 30, 2023
(Dollars in Thousands)
77
Credit Risk
Fixed income investment managers retained by the Retirement System follow specific investment
guidelines and are evaluated against specific market benchmarks that represent their investment style.
Fixed income managers typically are limited within their portfolios to no more than 5% exposure in any
single security, with the exception of United States Treasury and government agency securities. The
Retirement System’s credit risk policy is embedded in the individual investment manager agreements
as prescribed and approved by the Retirement Board.
Investments are classified and rated using the lower of (1) S&P Global Ratings (S&P) rating or (2)
Moody’s Investors Service (Moody’s) rating corresponding to the equivalent S&P rating. If only a
Moody’s rating is available, the rating equivalent to S&P is used for the purpose of this disclosure.
The following table illustrates the Retirement System’s exposure to credit risk as of June 30, 2023.
Investments issued or explicitly guaranteed by the U.S. government of $807,737 as of June 30, 2023,
are exempt from the credit rating disclosures and are excluded from the table below.
The securities listed as “Not Rated” include short-term investment funds, government mortgage-
backed securities, and investments that invest primarily in rated securities, such as commingled funds
and money market funds, but do not themselves have a specific credit rating. Excluding these
investments, the “not rated” component of credit would be approximately 11.0% for 2023.
Concentration of Credit Risk
Concentration of credit risk is the risk of loss attributed to the magnitude of the Retirement System’s
investment in a single issuer. Securities issued or guaranteed by the U.S. government or its agencies
are exempt from this limit. As of June 30, 2023, the Retirement System had no investments of a single
issuer that equaled or exceeded 5% of total Retirement System’s investments or net position.
Custodial Credit Risk
Custodial credit risk for investments is the risk that, in the event of the failure of the counterparty to a
transaction, a government may not be able to recover the value of investment or collateral securities
that are in the possession of an outside party. The Retirement System does not have a specific policy
addressing custodial credit risk for investments, but investments are generally insured, registered, or
held by the Retirement System or its agent in the Retirement System’s name. As of June 30, 2023,
$146,106 of the Retirement System’s investments were exposed to custodial credit risk because they
were not insured or registered in the name of the Retirement System, and were held by the
counterparty’s trust department or agent but not in the Retirement System’s name.

CITY AND COUNTY OF SAN FRANCISCO
Notes to Basic Financial Statements (Continued)
June 30, 2023
(Dollars in Thousands)
78
Foreign Currency Risk
The Retirement System’s exposure to foreign currency risk derives from its positions in foreign currency
denominated cash, equity, fixed income, private equity, real assets, and private credit. The Retirement
System’s investment policy allows international managers to enter into foreign exchange contracts,
which are limited to hedging currency exposure existing in the portfolio.
The Retirement System’s net exposures to foreign currency risk as of June 30, 2023, are as follows:

CITY AND COUNTY OF SAN FRANCISCO
Notes to Basic Financial Statements (Continued)
June 30, 2023
(Dollars in Thousands)
79
Money-Weighted Rate of Return
For the year ended June 30, 2023, the annual money-weighted rate of return on pension plan
investments, net of investment expenses, adjusted for the changing amounts actually invested, was
5.26%.
Derivative Instruments
As of June 30, 2023, the derivative instruments held by the Retirement System are considered
investments and not hedges for accounting purposes. The gains and losses arising from this activity
are recognized as incurred in the statement of changes in fiduciary net position. All investment
derivatives discussed below are included within the investment risk schedules, which precede this
subsection. Investment derivative instruments are disclosed separately to provide a comprehensive
and distinct view of this activity and its impact on the overall investment portfolio.
The fair value of the exchange traded derivative instruments, such as futures, options, rights, and
warrants are based on quoted market prices. The fair values of forward foreign currency contracts are
determined using a pricing service, which uses published foreign exchange rates as the primary source.
The fair values of swaps are determined by the Retirement System’s investment managers based on
quoted market prices of the underlying investment instruments or by an external pricing service using
various proprietary methods.
The table below presents the notional amounts, the fair values, and the related net appreciation
(depreciation) in the fair value of derivative instruments that were outstanding at June 30, 2023.
All investment derivatives are reported as investments at fair value in the statement of fiduciary net
position. Rights, warrants, and equity index futures are reported in equity securities. Foreign exchange
contracts are reported in foreign currency contracts, which also include spot contracts that are not
derivatives. All other derivative contracts are reported in other debt securities. All changes in fair value
are reported as net appreciation (depreciation) in fair value of investments in the statement of changes
in fiduciary net position.

CITY AND COUNTY OF SAN FRANCISCO
Notes to Basic Financial Statements (Continued)
June 30, 2023
(Dollars in Thousands)
80
Counterparty Credit Risk
The Retirement System is exposed to credit risk on non-exchange traded derivative instruments that
are in asset positions. The table below presents those investments being classified and rated using the
lower of (1) S&P Global Ratings (S&P) rating or (2) Moody’s Investors Service (Moody’s) rating
corresponding to the equivalent S&P rating. If only a Moody’s rating is available, the rating equivalent
to S&P is used for the purpose of this disclosure.
Custodial Credit Risk
The custodial credit risk disclosure for exchange traded derivative instruments is made in accordance
with the custodial credit risk disclosure requirements of GASB Statement No. 40. At June 30, 2023, all
of the Retirement System’s investments in derivative instruments are held in the Retirement System’s
name and are not exposed to custodial credit risk.
Interest Rate Risk
The table below describes the maturity periods of the derivative instruments exposed to interest rate
risk at June 30, 2023.

CITY AND COUNTY OF SAN FRANCISCO
Notes to Basic Financial Statements (Continued)
June 30, 2023
(Dollars in Thousands)
81
The following table details the reference rate, notional amount, and fair value of interest rate swaps that
are highly sensitive to changes in interest rates as of June 30, 2023:

CITY AND COUNTY OF SAN FRANCISCO
Notes to Basic Financial Statements (Continued)
June 30, 2023
(Dollars in Thousands)
82
Foreign Currency Risk
At June 30, 2023, the Retirement System is exposed to foreign currency risk on its derivative
investments denominated in foreign currencies. Below is the derivative instruments foreign currency
risk analysis as of June 30, 2023:
Contingent Features
At June 30, 2023, the Retirement System held no positions in derivatives containing contingent
features.
Securities Lending
The Retirement System lends U.S. government obligations, domestic and international bonds, and
equities to various brokers with a simultaneous agreement to return collateral for the same securities
plus a fee in the future. The securities lending agent manages the securities lending program and
receives securities and cash as collateral. Cash and non-cash collateral is pledged at 102% to 110%
depending on security type. There are no restrictions on the number of securities that can be lent at
one time. The term to maturity of the loaned securities is generally not matched with the term to maturity
of the investment of the corresponding collateral.

CITY AND COUNTY OF SAN FRANCISCO
Notes to Basic Financial Statements (Continued)
June 30, 2023
(Dollars in Thousands)
83
The Retirement System does not have the ability to pledge or sell collateral securities unless a borrower
defaults. The securities collateral is not reported on the statement of fiduciary net position. As of
June 30, 2023, the Retirement System has no credit risk exposure to borrowers because the amounts
the Retirement System owes them exceed the amounts they owe the Retirement System. As with other
extensions of credit, the Retirement System may bear the risk of delay in recovery or of rights in the
collateral should the borrower of securities fail financially. However, the lending agent indemnifies the
Retirement System against all borrower defaults.
As of June 30, 2023, the Retirement System has lent $1,243,298 in securities and received collateral
of $562,409 and $760,562 in cash and securities, respectively, from borrowers. The cash collateral is
invested in a separate account managed by the lending agent using investment guidelines approved
by the Retirement Board. Due to the increase in the fair value of assets held in the separately managed
account, the Retirement System’s invested cash collateral was valued at $562,491. The net unrealized
gain of $82 is presented as part of the net appreciation (depreciation) in fair value of investments in the
statement of changes in fiduciary net position in the year in which the unrealized gains and losses
occur. The Retirement System is exposed to investment risk including the possible loss of principal
value in the separately managed cash collateral reinvestment account due to the fluctuation in the fair
value of the assets held in the account.
The Retirement System’s securities lending transactions as of June 30, 2023 are summarized in the
following table.
The following table presents the segmented time distribution for the reinvested cash collateral account
based upon the expected maturity (in years) as of June 30, 2023.

CITY AND COUNTY OF SAN FRANCISCO
Notes to Basic Financial Statements (Continued)
June 30, 2023
(Dollars in Thousands)
84
The Retirement System’s exposure to credit risk in its reinvested cash collateral account as of
June 30, 2023 is as follows:
* This figure includes $166,626 in repurchase agreements and $9 in payable.
Investments in Real Assets
Real assets investments represent the Retirement System’s interests in real assets limited partnerships
and separate accounts. The changes in these investments during the year ended June 30, 2023, are
summarized as follows:
(g) Retiree Health Care Trust Fund
Interest Rate Risk
Interest rate risk is the risk that changes in interest rates may adversely affect the fair value of an
investment. Generally, the longer the maturity of an investment, the greater the sensitivity of its fair
value to changes in market interest rates. The RHCTF does not have a specific policy to manage
interest rate risk but invests in a diversified portfolio of stocks and bonds with a goal of reducing
sensitivity to any one interest rate regime.
As of June 30, 2023, the weighted average maturities in years for the RHCTF’s fixed income
investments were as follows:
CITY AND COUNTY OF SAN FRANCISCO
Notes to Basic Financial Statements (Continued)
June 30, 2023
(Dollars in Thousands)
85
Credit Risk
Credit risk is the risk that an issuer or other counterparty to an investment may not fulfill its obligations.
This is measured by the assignment of a rating by a nationally recognized statistical rating organization.
The RHCTF’s investments in the US Debt Index Fund, Government Bond Index Fund, Inflation
Protected Debt Index Fund, Emerging Markets Debt Fund, Multi-Sector Debt Fund, City investment
pool and Treasury Money Market Fund are not rated. Although those funds may invest in rated
securities, and securities issued or explicitly guaranteed by the U.S. Government that are exempt from
the credit rating disclosures, the funds do not themselves have a specific credit rating.
Concentration of Credit Risk
Concentration of credit risk is the risk of loss attributed to the magnitude of investment in a single issuer.
Securities issued or explicitly guaranteed by the U.S. Government are excluded from this disclosure.
As of June 30, 2023, the RHCTF had only commingled funds and a partnership investment that equaled
or exceeded 5% of the plan’s fiduciary net position. However, there is no position within the funds or
partnership investment that has equal to or greater than 5% at the issuer level and likely very little, if
any, overlap.
Custodial Credit Risk
Custodial credit risk for investments is the risk that, in the event of the failure of the counterparty to a
transaction, the RHCTF would not be able to recover the value of the investment or collateral securities
that are in the possession of an outside party. The RHCTF does not have a specific policy addressing
custodial credit risk for investments, but investments are generally insured, registered, or held by the
RHCTF’s custodial agent in the RHCTF’s name. As of June 30, 2023, none of the RHCTF’s investments
were exposed to custodial credit risk because they were either insured or registered in the name of the
RHCTF and were held by the custodian bank’s trust department or agent. Investments in the City pool
are held by the City's custodial agent and are not subject to custodial credit risk.
Foreign Currency Risk
The RHCTF allows investments in international equity. The RHCTF’s investments in the commingled
funds are denominated in U.S. dollars, but may consist of underlying securities that are denominated
in foreign currencies. The RHCTF’s investment managers value investments denominated in foreign
currencies by converting them into U.S. dollars using the most appropriate exchange rates as identified
by each manager. Also, the cost of purchases and proceeds from sales of investments, interest and
dividend income are translated into U.S. dollars using the spot market rate of exchange prevailing on
the respective dates of such transactions.
Rate of Return
For the year ended June 30, 2023, the annual money-weighted rate of return on investments, net of
investment expense, was 10.4%. The money-weighted rate of return expresses investment
performance, net of investment expense, adjusted for the changing amounts actually invested.
CITY AND COUNTY OF SAN FRANCISCO
Notes to Basic Financial Statements (Continued)
June 30, 2023
(Dollars in Thousands)
86
(6) PROPERTY TAXES
The City is responsible for assessing, collecting, and distributing property taxes in accordance with
enabling state law. Property taxes are levied on both real and personal property. Liens for secured
property taxes attach on January 1st preceding the fiscal year for which taxes are levied. Secured
property taxes are levied on the first business day of September and are payable in two equal
installments: the first is due on November 1st and delinquent with penalties after December 10th; the
second is due February 1st and delinquent with penalties after April 10th. Secured property taxes that
are delinquent and unpaid as of June 30th are subject to redemption penalties, costs, and interest when
paid. If not paid at the end of five years, the secured property may be sold at public auction and the
proceeds used to pay delinquent amounts due. Any excess is remitted, if claimed, to the taxpayer.
Unsecured personal property taxes do not represent a lien on real property. Those taxes are levied on
January 1st and become delinquent with penalties after August 31st. Supplemental property tax
assessments associated with changes in the assessed valuation due to transfer of ownership in
property or upon completion of new construction are levied in two equal installments and have variable
due dates based on the date the bill is mailed.
Since the passage of California’s Proposition 13, beginning with fiscal year 1978-1979, general property
taxes are based either on a flat 1.0% rate applied to the adjusted 1975-1976 value of the property and
new construction value added after the 1975-1976 valuation or on a flat 1.0% rate of the sales price of
the property for changes in ownership. Taxable values on properties (exclusive of increases related to
sales and construction) can rise or be adjusted at the lesser of 2.0% per year or the inflation rate as
determined by the Board of Equalization’s California Consumer Price Index.
The Proposition 13 limitations on general property taxes do not limit taxes levied to pay the interest and
redemption charges on any indebtedness approved by the voters prior to June 6, 1978 (the date of
passage of Proposition 13). Proposition 13 was amended in 1986 to allow property taxes in excess of
the 1.0% tax rate limit to fund general obligation bond debt service when such bonds are approved by
two-thirds of the local voters. In 2000, California voters approved Proposition 39, which set the approval
threshold at 55.0% for school facilities-related bonds. These “override” taxes for the City’s debt service
amounted to approximately $354.0 million for the year ended June 30, 2023.
Taxable valuation for the year ended June 30, 2023, (net of non-reimbursable exemptions,
reimbursable exemptions, and tax increment allocations to the Successor Agency) was approximately
$309.84 billion, an increase of 8.61% compared to the prior fiscal year. The secured tax rate was
$1.1797 per $100 of assessed valuation. After adjusting for a State mandated property tax shift to
schools, the tax rate is comprised of about $0.65 for general government, about $0.35 for other taxing
entities including the San Francisco Unified School District, San Francisco County Office of Education,
San Francisco Community College District, the Bay Area Air Quality Management District, and the San
Francisco Bay Area Rapid Transit District, and $0.1797 for voter-approved bond debt service for four
of the taxing entities. Delinquencies in the current year on secured taxes and unsecured taxes
amounted to 0.79% and 1.93%, respectively, of the current year tax levy, for an average delinquency
rate of 0.85% of the current year tax levy.
As established by the Teeter Plan, the Controller allocates to the City and other agencies 100.0% of
the secured annual and escape property taxes billed but not yet collected by the City; in return, as the
delinquent property taxes and associated penalties and interest are collected, the City retains such tax
amounts in the custodial fund. To the extent the custodial fund balances are higher than required;
transfers may be made to benefit the City’s General Fund on a budgetary basis. The balance of the tax
loss reserve as of June 30, 2023, was $38.0 million, which is included in the custodial fund for reporting
purposes. The City has funded payment of accrued and current delinquencies, together with the
required reserve, from interfund borrowing.

CITY AND COUNTY OF SAN FRANCISCO
Notes to Basic Financial Statements (Continued)
June 30, 2023
(Dollars in Thousands)
87
(7) CAPITAL ASSETS
Primary Government
Capital asset activity of the primary government for the year ended June 30, 2023, was as follows:
(1)
Balance of July 1, 2022, as restated due to implementation of GASB 96 SBITAs and GASB 94 Public-Private Partnership. See Note 17 for
additional information.
(2)
The increases and decreases include transfers of categories of capital assets from construction in progress to depreciable categories.
(3)
See Note 17 for additional information.
Balance Balance
July 1, June 30,
Governmental Activities:
2022
(1)
Increases
(2)
Decreases
(2)
2023
Capital assets, not being depreciated/amortized:
Land……………………...........................................................……
774,213$ 162,830$ (250)$ 936,793$
Intangible assets…………………………………………….
906 - - 906
Construction in progress......................................................................
586,526 283,466 (253,665) 616,327
Total capital assets, not being depreciated/amortized…………………
1,361,645 446,296 (253,915) 1,554,026
Capital assets, being depreciated/amortized:
Facilities and improvements
(3)
.............................................
6,120,159 147,357 (431) 6,267,085
Machinery and equipment
(3)
.................................................
646,323 22,694 (2,710) 666,307
Infrastructure
(3)
..................................................……….......…
1,539,804 90,121 - 1,629,925
Right-to-use assets
(3)
..................................................……….......…
626,100 75,093 (31,603) 669,590
Intangible assets………………………………………………
142,224 10,839 - 153,063
Total capital assets, being depreciated/amortized…………………
9,074,610 346,104 (34,744) 9,385,970
Less accumulated depreciation/amortization for:
Facilities and improvements
(3)
.............................................
1,716,571 149,940 (431) 1,866,080
Machinery and equipment
(3)
.................................................
499,725 32,282 (2,564) 529,443
Infrastructure
(3)
..................................................……….......…
458,899 70,003 - 528,902
Right-to-use assets
(3)
..................................................……….......…
74,042 91,062 (8,222) 156,882
Intangible assets………………………………………………
45,778 9,282 - 55,060
Total accumulated depreciation/amortization………………………………
2,795,015 352,569 (11,217) 3,136,367
Total capital assets, being depreciated/amortized, net…………………………..
6,279,595 (6,465) (23,527) 6,249,603
Governmental activities capital assets, net…………………….
7,641,240$ 439,831$ (277,442)$ 7,803,629$

CITY AND COUNTY OF SAN FRANCISCO
Notes to Basic Financial Statements (Continued)
June 30, 2023
(Dollars in Thousands)
88
(1)
Balance of July 1, 2022, as restated due to implementation of GASB 96 SBITAs. See Note 17 for additional information.
(2)
The increases and decreases include transfers of categories of capital assets from construction in progress to depreciable categories.
(3)
See Note 17 for additional information.
(4)
For fiscal year 2023, decreases in construction in progress were higher than increases to the total capital assets primarily due to $41.1
million in capital project write-offs.
(5)
The decreases include equipment transfers between departments.
Balance Balance
July 1, June 30,
Total Business-type Activities:
2022
(1)
Increases
(2)
Decreases
(2)
2023
Capital assets, not being depreciated/amortized:
Land……………………...........................................................……
353,558$ 7,326$ (119)$ 360,765$
Intangible assets…………………………………………….
12,043 - - 12,043
Construction in progress......................................................................
5,821,916 1,781,861 (2,739,353)
(4)
4,864,424
Total capital assets, not being depreciated/amortized…………………
6,187,517 1,789,187 (2,739,472) 5,237,232
Capital assets, being depreciated/amortized:
Facilities and improvements.............................................
22,878,575 444,913 (16,511) 23,306,977
Machinery and equipment.................................................
4,107,985 217,254 (155,821)
(5)
4,169,418
Infrastructure..................................................……….......…
2,123,636 2,054,518 (907) 4,177,247
Right-to-use assets
(3)
..................................................……….......…
264,230 15,290 (10,459) 269,061
Intangible assets………………………………………………
120,709 3,070 (478) 123,301
Total capital assets, being depreciated/amortized…………………
29,495,135 2,735,045 (184,176) 32,046,004
Less accumulated depreciation/amortization for:
Facilities and improvements........................................................
8,295,980 552,791 (16,512) 8,832,259
Machinery and equipment........................................................
2,158,598 257,912 (152,809)
(5)
2,263,701
Infrastructure......................................................................…
848,434 55,263 - 903,697
Right-to-use assets
(3)
..................................................……….......…
32,031 24,712 (10,459) 46,284
Intangible assets………………………………………………
85,625 5,906 (478) 91,053
Total accumulated depreciation/amortization………………………………
11,420,668 896,584 (180,258) 12,136,994
Total capital assets, being depreciated/amortized, net…………………………..
18,074,467 1,838,461 (3,918) 19,909,010
Business-type activities capital assets, net…………………………………………………………….
24,261,984$ 3,627,648$ (2,743,390)$ 25,146,242$

CITY AND COUNTY OF SAN FRANCISCO
Notes to Basic Financial Statements (Continued)
June 30, 2023
(Dollars in Thousands)
89
Depreciation/amortization expense was charged to functions/programs of the primary government as
follows:
Governmental Activities:
Public protection.........................................................................
31,293$
Public works, transportation and commerce.........................................................................
95,621
Human welfare and neighborhood development........................................................................
26,898
Community health.......................................................................
55,034
Culture and recreation.....................................................................
60,930
General administration and finance....................................................................
68,031
Capital assets held by the City's internal service funds
charged to the various functions on a prorated basis............................................................
14,762
Total depreciation/amortization expense - governmental activities................................................
352,569$
Business-type Activities:
Airport………………………………………………………………………………………………
355,475$
Water………………………………………………………………………………………………………..
155,714
Power…………………………………………………………………………………………………………….
24,671
Transportation………………………………………………………………………………..
229,262
Hospitals……………………………………………………………………………………
28,151
Wastewater……………………………………………………………………………….
78,039
Port…………………………………………………………………………………
25,272
Total depreciation/amortization expense - business-type activities…………………………
896,584$
Equipment is generally estimated to have useful lives of 2 to 40 years, except for certain equipment of
the Water Enterprise that has an estimated useful life of up to 75 years. Facilities and improvements
are generally estimated to have useful lives from 15 to 50 years, except for utility type assets of the
Water Enterprise, Hetch Hetchy, the Wastewater Enterprise, the SFMTA, and the Port that have
estimated useful lives from 51 to 175 years. These long-lived assets include reservoirs, aqueducts,
pumping stations of Hetch Hetchy, Cable Car Barn facilities and structures of SFMTA, and pier
substructures of the Port, which totaled $5.37 billion as of June 30, 2023. Hetch Hetchy Water had
intangible assets of water rights having estimated useful lives from 51 to 100 years, which totaled $45.6
million as of June 30, 2023. The Airport had $6.9 million in intangible assets of permanent easements.
In addition, the Water Enterprise had utility type assets with useful lives over 100 years, which totaled
$6.8 million as of June 30, 2023.

CITY AND COUNTY OF SAN FRANCISCO
Notes to Basic Financial Statements (Continued)
June 30, 2023
(Dollars in Thousands)
90
Component Unit
Capital asset activity of the component unit for the year ended June 30, 2023, was as follows:
Balance Balance
July 1, June 30,
Treasure Island Development Authority:
2022 Increases Decreases 2023
Capital assets, not being depreciated:
Land.............................................................................. 34,344$ -$ -$ 34,344$
Construction in progress............................................... 13,093 1,995 (14,586) 502
Total capital assets, not being depreciated................. 47,437 1,995 (14,586) 34,846
Capital assets, being depreciated:
Facilities and improvements.......................................... 4,844 - - 4,844
Machinery and equipment............................................. 36 - - 36
Infrastructure................................................................ 6,854 14,586 - 21,440
Total capital assets, being depreciated....................... 11,734 14,586 - 26,320
Less accumulated depreciation for:
Facilities and improvements.......................................... 514 109 - 623
Machinery and equipment............................................. 35 1 - 36
Infrastructure................................................................ - 2,481 - 2,481
Total accumulated depreciation.................................. 549 2,591 - 3,140
Total capital assets, being depreciated, net.................. 11,185 11,995 - 23,180
Component unit capital asssets, net........................ 58,622$ 13,990$ (14,586)$ 58,026$
During the year ended June 30, 2023, TIDA recorded construction in progress for the building
improvements. The Southgate Road project was completed in fiscal year 2022-23. For the overall
Treasure Island Development Project, construction began in late 2018, with the complete buildout of
the project occurring over fifteen to twenty years. For additional information, refer to Note 15.

CITY AND COUNTY OF SAN FRANCISCO
Notes to Basic Financial Statements (Continued)
June 30, 2023
(Dollars in Thousands)
91
(8) BONDS, LOANS, LEASES AND OTHER PAYABLES
The changes in short-term obligations for governmental and business-type activities for the year ended
June 30, 2023, are as follows:
* The $503.2 million in outstanding CP by the Airport includes $497.8 million CP that was repaid by the Series 2023CD bonds
that were issued in November 2023. The $497.8 million CP has been reclassed to long-term debt in the financial statements
as of June 30, 2023.
** The $371.5 million outstanding CP by the Water Enterprise was repaid by the Series 2023AB bonds that were issued in
July 2023. The $371.5 million CP has been reclassed to long-term debt in the financial statements as of June 30, 2023.
*** The $116.4 million outstanding CP by the Hetch Hetchy Water and Power Enterprise was repaid by the Series 2023A bonds
that were issued in October 2023. The $116.4 million CP has been reclassed to long-term debt in the financial statements
as of June 30, 2023.
City and County of San Francisco Commercial Paper Program
The City launched a commercial paper (CP) program to pay for project costs in connection with the
acquisition, improvement, renovation and construction of real property and the acquisition of capital
equipment and vehicles (Resolution No. 85-09) in March 2009, when the Board of Supervisors
established a $150.0 million commercial paper program. Pursuant to Resolution 247-13, the
authorization of the commercial paper program was increased from $150.0 million to $250.0 million in
July 2013. The City currently has revolving credit agreements (RCA) supporting the $250.0 million
program.
CP is an alternative form of short-term (or interim) financing for certain capital projects, vehicles and
equipment, that permits the City to pay project costs as project expenditures are incurred. The CP has
a fixed maturity date from one to 270 days and in the City’s general practice, matures between 14 to
90 days. On the maturity date of a CP note, the note may be rolled (or refinanced) with the re-issuance
of CP notes for additional periods of up to 270 days until the CP is refunded with the issuance of long-
term obligations.
The City issues CP in series based on the bank providing the applicable credit facility. The City’s CP
program has had several credit facilities, which included two RCAs issued by State Street Bank and
Trust Company (State Street Bank) and U.S. Bank National Association, that supported the issuance
of Commercial Paper Certificates of Participation Series 1&2 (Series 1&2). In March 2023, the two
RCAs supporting Series 1&2 were replaced by an RCA issued by Wells Fargo Bank (WFB RCA) in the
maximum principal and interest commitment not to exceed $150.0 million and $13.5 million,
respectively. The WFB RCA will only support the Commercial Paper Certificates of Participation Series
2 and it will not support in any respect the payment of the principal of and interest with respect to any
July 1, Additional Current June 30,
Commercial Paper 2022 Obligation Maturities 2023
Governmental activities:
Multiple Capital Projects……………………………………
29,771$ 240,491$ (231,472)$ 38,790$
Governmental activities short-term obligations………………………………
29,771$ 240,491$ (231,472)$ 38,790$
Business-type activities:
San Francisco International Airport *…………………………………
85,975$ 417,250$ -$ 503,225$
San Francisco Water Enterprise**…………………………………
206,297 371,459 (206,297) 371,459
Hetch Hetchy Water and Power*** 40,019 116,352 (40,019) 116,352
San Francisco Wastewater Enterprise…………………………
379,157 - (379,157) -
Business-type activities short-term obligations………
711,448$ 905,061$ (625,473)$ 991,036$
CITY AND COUNTY OF SAN FRANCISCO
Notes to Basic Financial Statements (Continued)
June 30, 2023
(Dollars in Thousands)
92
Series 1/1-T Commercial Paper Certificates. Additionally, no letter of credit, revolving line of credit, or
similar facility established by any bank or financial institution with respect to any other obligation of the
City is anticipated to be available in any respect to pay the principal of and interest with respect to any
Series 1/1-T Commercial Paper Certificates. The WFB RCA stipulates a quarterly commitment fee of
0.25%, on the maintenance of ratings of at least “AA+” by Fitch, “AA+” by S&P, and “Aa1” by Moody’s.
The WFB RCA is scheduled to expire on March 30, 2026.
The Commercial Paper Certificates of Participation Series 3 (Series 3) is supported by an RCA with
Bank of the West (BOTW RCA), in the maximum principal and interest commitment not to exceed
$100.0 million and $9.0 million, respectively. The BOTW RCA stipulates a semiannual commitment fee
of 0.12%, on the maintenance of ratings at least “AA-” by Fitch, “AA-” by S&P, and “Aa3” by Moody’s.
The BOTW RCA is scheduled to expire on April 30, 2026.
In fiscal year 2023, the City issued $240.5 million and retired $231.5 million of CP notes to provide
interim financing for the development, acquisition, construction or rehabilitation of affordable rental
housing projects; to finance and refinance capital projects at certain HOPE SF properties; to fund
approved capital improvement projects, including but not limited to certain projects generally known as
the Homeless Services Center, Laguna Honda Hospital Wings Reuse Project, and AITC Immunization
and Travel Clinic Relocation; to finance critical repairs, renovations and improvements to City-owned
buildings, facilities and works utilized by various City departments; to provide financing for the
acquisition of police vehicles; and to finance and refinance improvement and equipping of certain
existing real property including the existing Hall of Justice facilities and related facilities. As of June 30,
2023, the outstanding principal of taxable and tax-exempt CP of governmental activities was $20.1
million and $18.7 million with an interest rate of 5.25% and 3.20%, respectively.
Events of default under the RCA for Commercial Paper Series 2, consist of failure by the City to pay
any Reimbursement Obligation or interest thereon to the Bank; failure by the City to perform certain
covenants, including the failure to make rental payments under the Sublease, which is an agreement
by which the City is obligated to make annual rental payments to a trustee by leasing back City-owned
property from the trustee; the City fails to make payment on any other Special Lease Obligation Debt;
City files for bankruptcy or has certain types of involuntary cases or proceedings filed against it that
remain undismissed or unstayed for 60 days; a non-appealable judgment or legislation or order or
decree invalidates the Agreement or Certificates; City is downgraded below investment grade; City
sustains unsatisfied judgment of $25.0 million or more. Upon the occurrence and during the
continuance of an Event of Default, advances and all other amounts outstanding under the credit facility
shall bear interest at the default rate, the Commitment shall automatically and immediately terminate
with respect to all outstanding Certificates and the Bank’s obligation to make any Revolving Loan or
Advances shall terminate; the Bank may exercise any other rights or remedies available by law or under
contract. The RCA for Series 2 has no acceleration provision.
Events of default under the RCA for Commercial Paper Series 3, consist of failure by the City to pay
any Reimbursement Obligation to the Bank; failure by the City to perform certain covenants, including
the failure to make rental payments under the Sublease, which is an agreement by which the City is
obligated to make annual rental payments to a trustee by leasing back City-owned property from the
trustee; the City fails to make payment on any other material debt; City or trustee files for bankruptcy
or has certain types of involuntary cases or proceedings filed against it that remain undismissed or
unstayed for 60 days; City is downgraded below “BBB+/Baa1”; City sustains unsatisfied judgment of
$25.0 million or more; the IRS declares the interest taxable with respect to any Certificate issued as
tax-exempt; any governmental authority of appropriate jurisdiction declares a moratorium with respect
to any of the debt of the City. Upon the occurrence of an event of default under the RCA, the Credit
Bank may terminate the RCA. No additional Certificates shall be issued, the available Commitment
shall immediately be reduced to the then outstanding principal amount of Certificates, and the available
Commitment shall further be reduced in a similar manner as and when such Certificates mature.
Revolving Bank Certificate, and some or all of Reimbursement Obligations or other Obligations may be
converted to Term Loans at the Default Rate. For any special event of default, the RCA shall

CITY AND COUNTY OF SAN FRANCISCO
Notes to Basic Financial Statements (Continued)
June 30, 2023
(Dollars in Thousands)
93
automatically and immediately terminate with respect to all outstanding Certificates and the Bank shall
have no obligation to make any revolving loan. The RCA for Series 3 has no acceleration provision.
San Francisco International Airport
In May 1997, the Airport adopted Resolution No. 97-0146, as amended, and supplemented (the 1997
Note Resolution), authorizing the issuance of subordinate CP notes in an aggregate principal amount
not to exceed the lesser of $600.0 million or the stated amount of the letter(s) of credit (LOC) securing
the CP.
The Airport issues CP in series based on tax status that are divided into subseries according to the
bank providing the applicable direct-pay LOC. In addition to the applicable LOC, the CP notes are
further secured by a pledge of the Net Revenues of the Airport, subject to the prior payment of the
Airport’s Second Series Revenue Bonds (the Senior Bonds) outstanding from time to time under
Resolution No. 91-0210, adopted by the Airport on December 3, 1991, as amended and supplemented
(the 1991 Master Bond Resolution).
Net Revenues are generally defined in the 1997 Note Resolution as all revenues earned by the Airport
from or with respect to its construction, possession, management, supervision, maintenance,
extension, operation, use and control of the Airport (not including certain amounts specified in the 1997
Note Resolution), less Operation and Maintenance Expenses (as defined in the 1997 Note Resolution).
The CP notes are special, limited obligations of the Airport, and the payment of the principal of and
interest on the CP notes is secured by a pledge of, lien on and security interest in the Net Revenues
and amounts in the funds and accounts as provided in the 1997 Note Resolution, subject to the prior
payment of principal of and interest on the Senior Bonds. The CP notes are secured on a parity with
any other bonds or other obligations from time to time outstanding under the 1997 Note Resolution.
As of June 30, 2023, the CP program was supported by six direct-pay LOC with a combined maximum
stated principal amount of $600.0 million, from State Street Bank and Trust Company ($100.0 million,
expires May 2, 2024), Sumitomo Mitsui Banking Corporation, acting through its New York Branch
($100.0 million, expires April 7, 2027), Barclays Bank PLC ($100.0 million, expires May 24, 2024),
Sumitomo Mitsui Banking Corporation, acting through its New York Branch ($100.0 million, expires
June 6, 2028), Barclays Bank PLC ($125.0 million, expires April 23, 2027), and Bank of America, N.A.
($75.0 million, expires May 4, 2026). Each of the LOC supports a separate subseries of CP notes.
The following table summarizes CP activity during the year ended June 30, 2023:
The table presents the CP notes’ net increase and decrease activity during the fiscal year 2022-23.
This excludes the issuance of CP notes to repay maturing CP notes.
As of June 30, 2023, the Airport had $503.2 million in outstanding CP including $497.8 million that was
repaid by Series 2023CD bonds that were issued in November 2023. The $497.8 million has been
reclassed to long-term debt in the financial statements as of June 30, 2023. See Note 19 Subsequent
Events.
July 1, June 30,
Interest rate 2022 Increases
Decreases
2023
Commercial paper (Taxable) - short-term…..
3.50% - 5.45% 2,700$ 2,750$ -$ 5,450$
Commercial paper (AMT) - long-term…...... 2.32% - 3.42% 65,225 392,000 - 457,225
Commercial paper (Non-AMT) - long-term…..
2.42% - 3.35% 18,050 22,500 - 40,550
Total 85,975$ 417,250$ -$ 503,225$
Commercial Paper

CITY AND COUNTY OF SAN FRANCISCO
Notes to Basic Financial Statements (Continued)
June 30, 2023
(Dollars in Thousands)
94
As of June 30, 2023, there were no obligations other than the CP notes outstanding under the 1997
Note Resolution.
During fiscal year 2022-23, the Airport issued new money CP notes in the aggregate principal amount
of $392.0 million (AMT), $22.5 million (Non-AMT), and $2.8 million (Taxable) to fund capital
improvement projects.
Events of default for the CP notes include nonpayment events, bankruptcy events, noncompliance with
covenants, and default under the 1991 Master Bond Resolution. The CP notes are not subject to
acceleration.
Events of default with respect to the LOC supporting the CP notes include nonpayment events (both
on CP notes and Senior Bonds), bankruptcy events, noncompliance with covenants, default on debt in
excess of a specified threshold amount, default under the 1997 Note Resolution, or a determination of
taxability of interest on the tax-exempt CP notes. A downgrade of the Airport’s Senior Bonds to below
“Baa1” by Moody’s or “BBB+” by S&P or Fitch is an event of termination with respect to all of the LOC
supporting the CP notes. In addition, the State Street Bank and Trust LOC supporting $100.0 million of
CP notes includes certain changes in law affecting the Airport’s payment obligations to the bank as
events of termination. Remedies include the LOC bank’s ability to stop issuance of the CP notes it
supports and to require a final drawing on the LOC. If not repaid when due, drawings under the
respective LOC supporting the CP notes are amortized over a three-, four- or five-year period.
San Francisco Water Enterprise
The San Francisco Public Utilities Commission and the Board of Supervisors have authorized the
issuance of up to $500.0 million in CP pursuant to the voter-approved 2002 Proposition E. As of June
30, 2023, the amount outstanding under Proposition E was $371.5 million. CP interest rates ranged
from 1.2% to 5.3%. With maturities up to 270 days, the Water Enterprise intends to maintain the
program by remarketing the CP upon maturity over the near-to-medium term, at which time outstanding
CP will likely be refunded with revenue bonds. This is being done to take advantage of the continued
low interest rate environment. If the CP interest rates rise to a level that exceeds these benefits, the
Water Enterprise will refinance the CP with long-term, fixed rate debt. The Water Enterprise had $128.5
million in unused authorization as of June 30, 2023.
As of June 30, 2023, the Water Enterprise had $371.5 million in outstanding CP which was repaid by
the 2023 Series AB Water Revenue Bonds issued in July 2023. The $371.5 million CP has been
reclassed to long-term debt in the financial statements as of June 30, 2023. See Note 19 Subsequent
Events.
Events of default as specified in the Reimbursement Agreements, or Revolving Credit Agreement
include payment defaults; material breach of warranty, representation, or other non-remedied breach
of covenants as specified in the respective agreements (not cured within applicable grace periods); and
bankruptcy and insolvency events, which may result in all outstanding obligations to be immediately
due and payable (unless waived by the respective Bank, if applicable); or issuance of a No-Issuance
Notice, reduction in credit to outstanding amounts plus interest coverage, and/or termination of the
respective agreement. As of June 30, 2023, there were no such events described herein.
Hetch Hetchy Water and Power
Effective March 2019, under Charter Sections 9.107(6) and 9.107(8), and 2018 Proposition A, the San
Francisco Public Utilities Commission and Board of Supervisors authorized the issuance of up to $250.0
million in CP for the purpose of reconstructing, replacing, expanding, repairing or improving power
facilities of Hetchy Power. Interest rates for the CP ranged from 1.1% to 3.2% in fiscal year 2022-23.
Hetch Hetchy Water and Power had $116.4 million CP outstanding and $133.6 million in unused
authorization as of June 30, 2023.

CITY AND COUNTY OF SAN FRANCISCO
Notes to Basic Financial Statements (Continued)
June 30, 2023
(Dollars in Thousands)
95
As of June 30,2023, The Hetch Hetchy Water and Power had $116.4 million CP which was repaid by
the 2023 Series A bonds issued in October 2023. The $116.4 million CP has been reclassed to long-
term debt in the financial statements as of June 30, 2023. See Note 19 Subsequent Events.
Events of default as specified in the Reimbursement Agreements include non-payment; material breach
of warranty, representation, or other non-remedied breach of covenants as specified in the respective
agreements; and bankruptcy, which may result in all outstanding obligations to be immediately due and
payable (unless waived by the respective Bank, if applicable); or issuance of a No-Issuance Notice,
reduction in credit to outstanding amount plus interest coverage, and/or termination of the respective
agreement. As of June 30, 2023, there were no such events described herein.
San Francisco Wastewater Enterprise
Under the voter-approved 2002 Proposition E, the San Francisco Public Utilities Commission and
Board of Supervisors authorized the issuance of up to $750.0 million in CP for the purpose of
reconstructing, expanding, repairing, or improving the Wastewater Enterprise’s facilities. The
Wastewater Enterprise has no CP outstanding as of June 30, 2023.
Significant events of default as specified in the Reimbursement Agreements, Revolving Credit and
Term Loan Agreements or Revolving Credit Agreements include payment defaults, material breach of
warranty, representation, or other non-remedied breach of covenants as specified in the respective
agreements (not cured within applicable grace periods), bankruptcy and insolvency events, which may
result in all outstanding obligations to be immediately due and payable (unless waived by the respective
Bank, if applicable); or issuance of a No-Issuance Notice, reduction in credit to outstanding amount
plus interest coverage, and/or termination of the respective agreement. As of June 30, 2023, there were
no such events described herein.

CITY AND COUNTY OF SAN FRANCISCO
Notes to Basic Financial Statements (Continued)
June 30, 2023
(Dollars in Thousands)
96
Long-Term Obligations
The following is a summary of long-term obligations of the City as of June 30, 2023:
GOVERNMENTAL ACTIVITIES
* Includes the Moscone Center West Expansion Project Refunding Bonds Series 2008-1 & 2, both of which were financed
with variable rate bonds that reset weekly. The rate at June 30, 2023 for Series 2008-1 & 2 averaged 2.20%.
Debt service payments are made from the following sources:
(a) Property tax recorded in the Debt Service Fund.
(b) Lease revenues from participating departments in the General and Special Revenue Funds.
(c) Revenues recorded in the Special Revenue Funds.
(d) Revenues recorded in the General Fund.
(e) Hotel taxes and other revenues recorded in the General and Special Revenue Funds.
(f) User-charge reimbursements from the General and Special Revenue Funds.
(g) Sales tax revenues by the San Francisco County Transportation Authority.
(h) Certain tax increment revenue by Infrastructure Financing District and special tax revenue by Special Tax
District.
(i) Tax increment revenue by the Infrastructure and Revitalization Financing District.
Internal Service Funds serve primarily the governmental funds. Accordingly, long-term liabilities for the
Internal Service Funds are included in the above amounts.
Final Remaining
Maturity Interest
Type Of Obligation and Purpose Date Rates Amount
GENERAL OBLIGATION BONDS
(a)
:
Affordable housing………………………….....………...........……
2048 0.396% - 6.00% 421,865$
Earthquake safety and emergency response…………………….……………………..…….…
2046 2.25% - 5.00% 315,685
Clean and safe neighborhood parks .........................................................................................................
2037 2.00% - 6.26% 86,025
Health and recovery .........................................................................................................
2048 4.00% - 5.00% 193,180
Preservation and seismic safety (PASS) program .........................................................................................................
2060 0.616% - 4.321% 162,280
Public health and safety .........................................................................................................
2045 3.00% - 5.00% 205,125
Road repaving and street safety .........................................................................................................
2035 2.25% - 5.00% 30,095
San Francisco General Hospital………………………………………...……….
2030 5.30% - 6.26% 117,950
Seismic safety loan program .........................................................................................................
2031 3.36% - 5.83% 12,173
Transportation and road improvement .........................................................................................................
2046 2.00% - 5.00% 302,655
Refunding ..........................................................................................................................
2035 4.00% - 5.00% 740,765
General obligation bonds .....................................................................................................................................
2,587,798
LEASE REVENUE BONDS:
San Francisco Finance Corporation
(b), (e) & (f)
.........................................................................................................
2030 2.20% - 5.00% * 83,085
SALES TAX REVENUE BONDS
SFCTA revenue bonds
(g)
………………………………………………………………………………………………………………..
2034 3.00% - 4.00% 194,185
CERTIFICATES OF PARTICIPATION:
Certificates of participation
(c) & (d)
........................................................................................................................
2050 2.00% - 5.00% 1,102,005
SPECIAL TAX BONDS:
Development special tax bonds
(h)
…..................................................................
2052 3.00% - 5.25% 106,230
INCREMENT TAX BONDS:
Tax increment revenue bonds
(i)
…................................................................
2053 5.00% 29,390
OTHER LONG-TERM OBLIGATIONS:
Loans
(d), (f)
........................................................................................................
2045 4.50% 19,900
Lease purchase - Public Safety Radio Replacement
(d)
…………………………………………………………..
2027 1.6991% 12,619
Governmental activities total long-term obligations………………………………………………………………………………..….....
4,135,212$

CITY AND COUNTY OF SAN FRANCISCO
Notes to Basic Financial Statements (Continued)
June 30, 2023
(Dollars in Thousands)
97
BUSINESS-TYPE ACTIVITIES
* Includes Second Series Revenue Bonds Issue 2018B and 2018C, which were issued as variable rate bonds in a weekly mode.
For the year ended June 30, 2023, the average interest rates on Issue 2018B and 2018C, were 1.99% and 2.03%, respectively.
Sources of funds to meet debt service requirements are revenues derived from user fees and charges
for services recorded in the respective enterprise funds.
Debt Compliance
The City believes it’s in compliance with all significant limitations and restrictions contained in the
various bond indentures.
Final Remaining
Maturity Interest
Entity and Type of Obligation Date Rates Amount
San Francisco International Airport:
Revenue bonds *.....................................................................................................................................
2058 1.98% - 5.50%* 8,049,665$
San Francisco Water Enterprise:
Revenue bonds ...................................................................................................................................
2051 0.26% - 6.95% 4,459,365
Certificates of participation ..................................................................................................................................…
2042 2.00% - 6.49% 92,499
State Revolving fund loans ….......................................................................
2051 1.00% - 1.10% 163,627
Hetch Hetchy Water and Pow er:
Energy and revenue bonds ................................................................................................
2052 3.00% - 5.00% 162,984
Certificates of participation………………………...……………….……………....
2042 2.00% - 6.49% 12,593
Municipal Transportation Agency:
Revenue bonds………………………………………………………………………………………...………..……....
2051 0.389% - 5.00% 430,365
Loans………………………………………………………………..……………..
…
2047 3.30% 10,934
San Francisco General Hospital:
Certificates of participation………………………………………………………………………………..………………
2026
5.55% 5,388
San Francisco Wastew ater Enterprise:
Revenue bonds ...................................................................................................................................
2052 1.00% - 5.82% 2,397,670
Revenue notes ...................................................................................................................................
2027 1.00% 347,465
Certificates of participation .............................................................................................…
2042 2.00% - 6.49% 24,458
State Revolving fund loans ….......................................................................
2056 0.80% - 1.80% 318,689
WIFIA Loans….........................................................................................
2059 1.45% 122,357
Port of San Francisco:
Revenue bonds .......................................................................................................................................
2044 1.79% - 5.0% 38,490
Certificates of participation…………………………………………………………………………...………………
2043 4.75% - 5.25% 24,765
Loans ..........................................................................................................
2037 4.50% 6,229
Laguna Honda Hospital:
Certificates of participation .............................................................................................…
2031 3.00% - 5.00% 63,120
Business-type activities total long-term obligations .............................................................................................…
16,730,663$

CITY AND COUNTY OF SAN FRANCISCO
Notes to Basic Financial Statements (Continued)
June 30, 2023
(Dollars in Thousands)
98
Legal Debt Limit and Legal Debt Margin
As of June 30, 2023, the City’s general obligation bond debt limit (3% of valuation subject to taxation)
was $9.96 billion. The total amount of debt applicable to the debt limit was $2.84 billion. The resulting
legal debt margin was $7.12 billion.
Arbitrage
Under U.S. Treasury Department regulations, all governmental tax-exempt debt issued after August 31,
1986, is subject to arbitrage rebate requirements. The requirements stipulate, in general, that the actual
earnings from the investment of tax-exempt bond proceeds, which exceed related interest earnings if
such investments were invested at a rate equal to the yield of the bonds, must be remitted to the Federal
government on every fifth anniversary of each bond issuance. The City has evaluated each series of
tax-exempt general obligation bonds, lease revenue bonds, and certificates of participation, and other
direct loans issued by the City and the Finance Corporation. The City has recognized an arbitrage
liability of $3.1 million, and the Finance Corporation does not have an arbitrage liability as of June 30,
2023. Each enterprise fund has performed a similar analysis of its debt which was subject to arbitrage
rebate requirements. Any material arbitrage liability related to the debt of the enterprise funds has been
recorded as a liability in the respective fund.
Conduit Debt Obligations
Mortgage Revenue Bonds
The City, through the Mayor’s Office of Housing and Community Development and the former San
Francisco Redevelopment Agency has issued various mortgage revenue bonds for the financing of
multifamily rental housing and to facilitate affordable housing construction and rehabilitation in the City.
These obligations were issued on behalf of various property owners and developers who retain full
responsibility for the payment of the debt. These bonds are secured by the related project revenues
and other sources of funds, and are not considered obligations of the City. No commitments beyond
the maintenance of the tax-exempt status of the conduit debt obligation were extended by the City for
any of the mortgage revenue bonds. As of June 30, 2023, the total obligation outstanding was $2.20
billion.
San Francisco International Airport Special Facilities Lease Revenue Bonds
In February 2019, the Airport issued San Francisco International Airport Special Facilities Lease
Revenue Bonds (SFO FUEL COMPANY LLC), Series 2019A (AMT) and Series 2019B (Federally
Taxable) (Fuel Bonds), in an aggregate principal amount of $125.0 million to refund all of the then-
outstanding special facilities lease revenue bonds previously issued by the Airport for the benefit of
SFO FUEL COMPANY LLC (SFO Fuel), finance capital improvements to the jet fuel distribution and
related facilities at San Francisco International Airport, pay capitalized interest on a portion of the Series
2019A Bonds, make a deposit to a reserve account for the Fuel Bonds, and pay costs of issuance. As
of June 30, 2023, the outstanding balance was $96.7 million. The 2019 Fuel Bonds have a final maturity
of January 1, 2047.
SFO Fuel, a special purpose limited liability company formed by certain airlines operating at the Airport,
is required to pay facilities rent to the Airport pursuant to a lease agreement between the Airport and
SFO Fuel with respect to the on-Airport jet fuel distribution facilities in an amount equal to debt service
payments on the Fuel Bonds and any required bond reserve account deposits. The principal and
interest on the Fuel Bonds are paid solely from the facilities rent payable by SFO Fuel to the Airport.
The lease payments, and therefore the Fuel Bonds, are payable from charges imposed by SFO Fuel
on air carriers for into-plane fueling at the Airport and are not payable from or secured by the Net
Revenues of the Airport. The Airport assigned its right to receive the facilities rent to the Fuel Bonds
trustee to pay and secure the payment of the Fuel Bonds. Neither the Airport nor the City is obligated

CITY AND COUNTY OF SAN FRANCISCO
Notes to Basic Financial Statements (Continued)
June 30, 2023
(Dollars in Thousands)
99
in any manner for the repayment of the Fuel Bonds other than from the facilities rent received from SFO
Fuel.
Community Facilities Districts and Special Tax Districts Bonds
Community Facilities District No. 2014-1 (Transbay Transit Center)
The following is a summary of long-term obligations of the City and County of San Francisco Community
Facilities District No. 2014-1 (CFD 2014-1) as of June 30, 2023:
In December 2022, the City, on behalf of the City and County of San Francisco Community Facilities
District No. 2014-1 (CFD 2014-1) issued Special Tax Bonds, Series 2022A (Tax-Exempt) and Series
2022B (Federally Taxable – Green Bonds) in the par amounts of $31.2 million and $47.4 million,
respectively. The 2022A Bonds were issued to fund streetscape and pedestrian improvements around
the Salesforce Transit Center, acquisition of transit vehicles, and enhancements at BART Embarcadero
Station. The 2022B Bonds were issued to fund planning, design, engineering, right of way acquisition
and construction of certain capital improvements that are part of the Transbay Program’s Downtown
Rail Extension. The 2022A Bonds bear an interest rate of 5.0%, with principal amortizing from
September 1, 2023, through September 1, 2052. The 2022B Bonds bear interest rates ranging from
4.798% to 6.332%, with principal amortizing from September 1, 2023, through September 1, 2051.
The Special Tax Bonds of CFD 2014-1 are secured under the provisions of a Fiscal Agent Agreement
and will be payable solely from Special Tax Revenues and funds pledged under that agreement. These
bonds are not payable from any revenues or assets of the City. Neither the faith and credit nor the
taxing power of the City, the State, or any political subdivision thereof are pledged for the payment of
the principal or interest on Special Tax Bonds of CFD 2014-1.
Community Facilities District No. 2016-1 (Treasure Island)
The following is a summary of long-term obligations of the City and County of San Francisco Community
Facilities District No. 2016-1 (CFD 2016-1) as of June 30, 2023:
Bonds
Remaining
Interest
Rates
Final
Maturity
Date
Amount
Special Tax Bonds Series 2017A 2.750% - 4.00% 2049 34,710$
Special Tax Bonds Series 2017B 2.750% - 4.00% 2049 164,865
Special Tax Bonds Series 2019A 3.038% - 4.25% 2050 32,485
Special Tax Bonds Series 2019B 3.028% - 4.371% 2050 151,975
Special Tax Bonds Series 2020B 1.683% - 3.572% 2051 80,060
Special Tax Bonds Series 2021B 0.645% - 3.482% 2051 33,450
Special Tax Bonds Series 2022A 5.00% 2053 31,190
Special Tax Bonds Series 2022B 4.798% - 6.332% 2052 47,380
Total obligations
576,115$
Bonds
Remaining
Interest
Rates
Final
Maturity
Date
Amount
Improvement Area No.1 Special Tax Bonds Series 2020 3.00% - 4.00% 2051 16,825$
Improvement Area No.1 Special Tax Bonds Series 2021 4.00% 2052 41,340
Improvement Area No.2 Special Tax Bonds Series 2022A 4.00% 2053 25,130
Total obligations
83,295$

CITY AND COUNTY OF SAN FRANCISCO
Notes to Basic Financial Statements (Continued)
June 30, 2023
(Dollars in Thousands)
100
The Special Tax Bonds of CFD 2016-1 Improvement Area No. 1 and Improvement Area No. 2 were
issued in order to finance infrastructure and development costs for the Treasure Island/Yerba Buena
Island Development Project. The bonds are secured under the provisions of their respective Fiscal
Agent Agreements and will be payable solely from Special Tax Revenues and funds pledged under
those agreements. These bonds are not payable from any revenues or assets of the City. Neither the
faith and credit nor the taxing power of the City, the State, or any political subdivision thereof are
pledged for the payment of the principal or interest on Special Tax Bonds of CFD 2016-1.
Changes in Long-Term Obligations
The changes in long-term obligations for the year ended June 30, 2023, are as follows:
Current
Additional Maturities, Amounts
Restated Obligations, Retirements, Due
July 1, and Net and Net June 30, Within
2022 Increases Decreases 2023 One Year
Governmental activities:
Bonds payable:
General obligation bonds ....................................................................
2,625,533$ 238,585$ (276,320)$ 2,587,798$ 179,681$
Lease revenue bonds........................................................................
96,340 - (13,255) 83,085 14,455
Sales tax revenue bonds…………………………...….….
208,310 - (14,125) 194,185 14,545
Certificates of participation .........................................................…....................................…….
1,140,925 - (38,920) 1,102,005 40,985
Special tax bonds*.........................................................…....................................…….
106,230 - - 106,230 -
Increment tax bonds ...............................................................
- 29,390 - 29,390 465
Subtotal.........................................................…....................................…….
4,177,338 267,975 (342,620) 4,102,693 250,131
Issuance premiums:
Add: unamortized premiums* .....................................................................…………………………………
403,789 6,364 (27,785) 382,368 -
Less: unamortized discounts .....................................................................…………………………………
- - - - -
Total bonds payable, net..............................................…………………….
4,581,127 274,339 (370,405) 4,485,061 250,131
Loans.....................................................................…………………………………………………………………………………………
20,418 - (518) 19,900 542
Others.......................................................................………......................................……………………………………..
16,089 - (3,470) 12,619 3,530
Accrued vacation and sick leave pay.....................................................................………………………
243,885 166,974 (164,617) 246,242 128,356
Accrued w orkers' compensation.....................................................................………………………
359,835 86,314 (68,359) 377,790 72,304
Estimated claims payable.....................................................................………………………
296,919 182,206 (63,439) 415,686 155,464
Lease liabilities ….....................................................................
511,317 74,057 (89,178) 496,196 62,481
Subscription liabilities **….....................................................................
44,098 1,036 (9,796) 35,338 14,337
Arbitrage rebate liability….....................................................................
- 3,074 - 3,074 3,074
Governmental activities long-term obligations.....................................................................………………………
6,073,688$ 788,000$ (769,782)$ 6,091,906$ 690,219$
* Restated 7/1/2022 balance due to change of reporting entity for Mission Rock Special Tax District
**Restated 7/1/2022 balance due to implementation of GASB 96 - Subscription-Based Information Technology Arrangements (SBITAs)

CITY AND COUNTY OF SAN FRANCISCO
Notes to Basic Financial Statements (Continued)
June 30, 2023
(Dollars in Thousands)
101
Internal Service Funds serve primarily the governmental funds, the long-term liabilities of which are
included as part of the above totals for governmental activities. Also, for the governmental activities,
claims and judgments, workers’ compensation and compensated absences are generally liquidated by
the General Fund.
Annual debt service requirements to maturity for all bonds and loans outstanding as of June 30, 2023,
for governmental and business-type activities are as follows:
Current
Additional Maturities, Amounts
Restated Obligations, Retirements, Due
July 1, and Net and Net June 30, Within
2022 Increases Decreases 2023 One Year
Business-type Activities:
Bonds payable:
Revenue bonds ........................................................................
15,027,450$ 1,353,375$ (881,270)$ 15,499,555$ 267,525$
Revenue notes ………………………………………….
347,465 - - 347,465 -
Clean renewable energy bonds………………………………………….
40,956 - (1,972) 38,984 710
Certificates of participation ........................................................
236,940 - (14,117) 222,823 14,073
Subtotal…………………………………………………………….
15,652,811 1,353,375 (897,359) 16,108,827 282,308
Issuance premiums / discounts:
Add: unamortized premiums .....................................................................…………………………………
1,528,556 200,058 (113,636) 1,614,978 -
Less: unamortized discounts .....................................................................…………………………………
(130) - 15 (115) -
Total bonds payable, net .................................................…………………….
17,181,237 1,553,433 (1,010,980) 17,723,690 282,308
Commercial paper notes - long-term *….........................................................
- 985,586 - 985,586 -
Notes, loans, and other payables............................................
442,353 182,734 (3,251) 621,836 3,333
Accrued vacation and sick leave pay……………………
165,036 70,908 (70,558) 165,386 89,830
Accrued w orkers' compensation…………………………..
253,294 83,459 (60,707) 276,046 50,502
Estimated claims payable…………………..……………..
167,117 37,195 (83,951) 120,361 46,288
Lease liabilities ….....................................................................
235,905 17,122 (22,842) 230,185 13,100
Subscription liabilities **….....................................................................
3,653 2,697 (3,563) 2,787 1,687
Arbitrage rebate liability….....................................................................
- 188 - 188 -
Business-type activities long-term obligations………….………………...….……
18,448,595$ 2,933,322$ (1,255,852)$ 20,126,065$ 487,048$
* CP notes repaid by long-term debt in fiscal year 2024 w ere reclassed to long-term debt
**Restated 7/1/2022 balance due to implementation of GASB 96 - Subscription-Based Information Technology Arrangements (SBITAs)

CITY AND COUNTY OF SAN FRANCISCO
Notes to Basic Financial Statements (Continued)
June 30, 2023
(Dollars in Thousands)
102
(1)
The specific year for payment of estimated claims payable, accrued vacation and sick leave pay and accrued workers’
compensation is not practicable to determine.
(2)
The interest is before the federal subsidy for the General Obligation Bonds Series 2010C and Series 2010D. The subsidy is
approximately $10.2 million and $2.1 million, respectively, through the year ending 2030. The federal sequester reduction was
5.7% in fiscal year 2023. Future interest subsidy may be reduced as well.
(3)
Includes the Moscone Center Expansion Project Lease Revenue Refunding Bonds Series 2008-1 & 2 which bear interest at
a weekly rate. An assumed rate of 2.20%, together with liquidity fee of 0.27% and remarketing fee of 0.05% were used to project
the interest rate payment in this table.
(4)
Debt service for the Airport is per debt service requirement. In the event the letters of credit securing the Airport’s outstanding
variable rate bonds had to be withdrawn upon to pay such bonds and the amount drawn had to be repaid by the Airport pursuant
to the terms of the related agreement with banks providing such letters of credit, the total interest would be $190.8 million less.
(5)
The interest is before the federal subsidy for the Revenue Bonds, Certificates of Participation, Clean Renewable Energy, and
Energy Conservation Bonds by the San Francisco Water, San Francisco Wastewater and Hetch Hetchy Water and Power.
Federal subsidy was reduced by 5.7% or a total reduction of $18.8 million, $2.5 million, and $201, respectively, over the life of
the bonds, assuming the sequestration rate will remain the same.
Fiscal Year
Ending
June 30 Principal
Interest
(2)
Principal
Interest
(3)
Principal Interest Principal Interest
2024............ 179,681$ 104,758$ 14,455$ 2,682$ 60,067$ 58,952$ 254,203$ 166,392$
2025..............................................................
181,456 96,441 13,105 2,166 63,629 56,302 258,190 154,909
2026..............................................................
168,787 88,137 13,730 1,721 64,794 53,540 247,311 143,398
2027..............................................................
175,771 80,526 14,375 1,256 65,889 50,659 256,035 132,441
2028..............................................................
182,379 72,846 8,735 808 66,983 47,823 258,097 121,477
2029-2033…
793,649 252,750 18,685 680 378,821 194,950 1,191,155 448,380
2034-2038……………..……………………….……
432,100 130,609 - - 308,542 128,661 740,642 259,270
2039-2043………
230,790 72,238 - - 266,743 68,839 497,533 141,077
2044-2048…
172,265 29,092 - - 120,846 28,457 293,111 57,549
2049-2053…
28,690 10,734 - - 68,015 5,489 96,705 16,223
2054-2058…
34,325 5,102 - - - - 34,325 5,102
2059-2060…
7,905 368 - - - - 7,905 368
Total.........................................…
2,587,798$ 943,601$ 83,085$ 9,313$ 1,464,329$ 693,672$ 4,135,212$ 1,646,586$
Governmental Activities
(1)
Lease Revenue
Bonds
Bonds
General Obligation
Total
Other Long-Term
Obligations
Fiscal Year
Ending
June 30 Principal Interest Principal Interest Principal Interest Principal Interest
2024............ 268,235$ 717,051$ 14,073$ 12,289$ 3,333$ 2,116$ 285,641$ 731,456$
2025..............................................................
358,989 707,251 14,754 11,502 6,428 3,311 380,171 722,064
2026..............................................................
632,138 689,491 14,297 10,681 10,324 5,397 656,759 705,569
2027..............................................................
586,791 667,627 13,775 9,918 13,943 7,920 614,509 685,465
2028..............................................................
485,680 645,047 14,430 9,150 14,149 7,715 514,259 661,912
2029-2033…
2,349,351 2,893,474 61,994 35,424 77,720 36,890 2,489,065 2,965,788
2034-2038……………..……………………….……
2,723,395 2,303,994 44,475 21,309 81,853 31,178 2,849,723 2,356,481
2039-2043………
3,188,525 1,621,606 45,025 6,183 86,262 25,436 3,319,812 1,653,225
2044-2048…
3,040,330 920,428 - - 111,234 18,851 3,151,564 939,279
2049-2053…
2,174,150 211,849 - - 120,444 11,014 2,294,594 222,863
2054-2058…
78,420 7,839 - - 85,263 3,629 163,683 11,468
2059-2060…
- - - - 10,883 119 10,883 119
Total.........................................…
15,886,004$ 11,385,657$ 222,823$ 116,456$ 621,836$ 153,576$ 16,730,663$ 11,655,689$
Business-Type Activities
(1)
Revenue Bonds
and Revenue Notes
(4) (5)
Certificates
of Participation
(5)
Other Long-Term
Obligations
Total

CITY AND COUNTY OF SAN FRANCISCO
Notes to Basic Financial Statements (Continued)
June 30, 2023
(Dollars in Thousands)
103
Governmental Activities Long-term Liabilities
General Obligation Bonds
The City issues general obligation bonds to provide funds for the acquisition or improvement of real
property and construction of affordable housing. General obligation bonds have been issued for both
governmental and business-type activities. The net authorized and unissued governmental activities
general obligation bonds for the year ended June 30, 2023, are as follows:
In April 2023, the City issued Tax-Exempt General Obligation Bonds Series 2023A (Health and
Recovery), and Taxable General Obligation Series 2023B (Embarcadero Seawall Earthquake Safety)
and Series 2023C (Social Bonds – Affordable Housing) with the par value of $28.8 million, $39.0 million,
and $170.8 million, respectively.
The proceeds of the Series 2023A bonds will be used to finance the acquisition or improvement of real
property, including to stabilize, improve, and make permanent investments in supportive housing
facilities, shelters, and/or facilities that deliver services to persons experiencing mental health
challenges, substance use disorder, and/or homelessness; improve the accessibility, safety and quality
of parks, open spaces and recreation facilities; improve the accessibility, safety and condition of the
City’s streets and other right-of-way and related assets; and to pay certain costs related to the issuance
of the Series 2023A bonds. The Series 2023A bonds bear interest rates of 4.0% and 5.0% and with
maturities from June 2024 through June 2048.
The proceeds of the Series 2023B bonds will be used to finance projects to protect the waterfront,
BART and MUNI infrastructure, buildings, historic piers, and roads from earthquakes, flooding and
rising sea level by repairing the 100-year-old Embarcadero Seawall, strengthening the Embarcadero
roadway, fortifying transit infrastructure and utilities serving residents and businesses and to pay certain
costs related to the issuance of the Series 2023B bonds. The Series 2023B bonds bear an interest rate
of 6.0% and finally matured in June 2023.
The proceeds of the Series 2023C bonds will be used to finance the construction, development,
acquisition, and preservation of affordable housing to extremely-low, low and middle-income
households through programs that will prioritize vulnerable populations such as the City’s working
families, veterans, seniors, and persons with disabilities; to assist in the acquisition, rehabilitation, and
preservation of existing affordable housing to prevent displacement of residents; to repair and
reconstruct distressed and dilapidated public housing developments and their underlying infrastructure;
to assist the City’s middle-income residents or workers in obtaining affordable rental or home ownership
opportunities including down payment assistance and support for new construction of affordable
housing for San Francisco Unified School District and City College of San Francisco employees; and
to pay related costs on the issuance of the Series 2023C bonds. The Series 2023C bonds bear interest
rates ranging from 4.45% to 6.0% with principal amortizing from June 2023 through June 2048.
Governmental Activities - General Obligation Bonds
Authorized and unissued as of June 30, 2022......................................................................................
1,496,115$
Bonds issued:
Series 2023A Health and Recovery ..……………………………………….…………………..……….….
(28,785)
Series 2023B Embarcadero Seawall Earthquake Safety ..……………………………………….…………………..……….….
(39,020)
Series 2023C Social Bonds - Affordable Housing ..……………………………………….…………………..……….….
(170,780)
Net authorized and unissued as of June 30, 2023...........................................................................
1,257,530 $

CITY AND COUNTY OF SAN FRANCISCO
Notes to Basic Financial Statements (Continued)
June 30, 2023
(Dollars in Thousands)
104
The General Obligation Bonds debt service payments are funded through ad valorem taxes on property.
The City is obligated to levy ad valorem taxes without limitation as to rate or amount on all real property
subject to taxation (except in certain limited circumstances) for the payment of general obligation bonds.
No City property is pledged to the repayment of general obligation bonds nor is the City required to
maintain a reserve fund for the payment of principal and interest.
An event of default is the non-payment of interest or principal, when due. Remedies include mandamus
action for payment. General Obligation Bonds are not subject to acceleration.
Certificates of Participation
As of June 30, 2023, the City has a total of $1.10 billion of certificates of participation, excluding
business-type activities, payable by pledged revenues from the base rental payments payable by the
City. A Reserve Fund has been established for payment of certain COP issuances, equivalent to either
50% or 100% of the lesser of maximum annual debt service, 125% of average annual debt service, or
10% of the original principal amount of the COPs. The total debt service requirement on the certificates
of participation is $1.62 billion payable through April 1, 2050. For the year ended June 30, 2023,
principal and interest paid by the City totaled $38.9 million and $46.6 million, respectively.
An event of default on every outstanding series of Certificates of Participation, include: (i) the failure to
make lease payments when due; or (ii) failure to observe covenants under the respective Project Lease.
In an event of default, the trustee may enforce all of its rights and remedies under the Project Lease,
including reletting the leased property for the account of the City, or hold the Project Lease and sue
each year for rent. Certificates of Participation are not subject to acceleration.
Lease Revenue Bonds
The changes in governmental activities - lease revenue bonds for the year ended June 30, 2023, were
as follows:
Finance Corporation
The purpose of the Finance Corporation is to provide a means to publicly finance, through lease
financings, the acquisition, construction and installation of facilities, equipment, and other tangible real
and personal property for the City’s general governmental purposes.
The Finance Corporation uses lease revenue bonds to finance the purchase or construction of property
and equipment, which are in turn leased to the City under the terms of an Indenture and Equipment
Lease Agreement. These assets are then recorded in the basic financial statements of the City. Since
the sole purpose of the bond proceeds is to provide lease financing to the City, any amount that is not
applied towards the acquisition or construction of real and personal property such as unapplied
acquisition fund, bond issuance costs, funds withheld pursuant to a reserve fund requirement, and
amounts designated for capitalized interest are recorded as unearned revenues in the internal service
fund until such time it is used for its intended purpose. The unearned amounts are eliminated in the
governmental activities statement of net position.
The lease revenue bonds are payable by pledged revenues from the base rental payments payable by
the City, pursuant to a Master Lease Agreement between the City and the Finance Corporation for the
use of equipment and facilities acquired, constructed, and improved by the Finance Corporation. The
Governmental Activities - Lease Revenue Bonds
Authorized and unissued as of June 30, 2022....................................................................…………...................…
204,916$
Increase in authorization in this fiscal year:
Current year annual increase in Finance Corporation's equipment program...........................................................................
4,538
Authorized and unissued as of June 30, 2023....................................................................…………...................…
209,454$

CITY AND COUNTY OF SAN FRANCISCO
Notes to Basic Financial Statements (Continued)
June 30, 2023
(Dollars in Thousands)
105
total debt service requirement remaining on the lease revenue bonds is $92.4 million payable through
June 2030. For the year ended June 30, 2023, principal and interest paid by the Finance Corporation
in the form of lease payments by the City totaled $13.3 million and $2.7 million, respectively.
Equipment Lease Program - In the June 5, 1990, election, the voters of the City approved Proposition
C, which amended the City Charter to allow the City to lease-purchase up to $20.0 million of equipment
through a nonprofit corporation using tax-exempt obligations. Beginning July 1, 1991, the Finance
Corporation was authorized to issue lease revenue bonds up to $20.0 million in aggregate principal
amount outstanding plus 5% annual adjustment each July 1. As of June 30, 2023, all the previously
issued equipment lease revenue bonds have been repaid. $95.3 million of unused authorization is still
available for new issuance.
Events of Default and Remedies
Moscone Lease Revenue Refunding Bonds, Series 2008-1 and 2008-2 - Events of default as specified
in the Letter of Credit Agreements include: (i) the City fails to pay when due the amounts of any drawing,
the principal or interest on any Liquidity Advance, or otherwise fails to pay the Credit Bank when due;
(ii) the City fails to observe any covenant under Credit Agreement; (iii) the San Francisco Finance
Corporation fails to observe any covenant or warranty under Credit Agreement; (iv) the City defaults on
any appropriation debt; (v) the City files for bankruptcy; (vi) downgrade of the City’s rating on the Bonds
or any other Lease Obligation Debt below “BBB” (or its equivalent). Upon the occurrence of an Event
of Default, the bank’s remedies are as follows: (i) by notice require the City to post collateral up to the
Available Amount of the letter of credit (except the City has no such right upon bankruptcy event), (ii)
declare all Obligations due and payable (except such declaration is automatic upon bankruptcy event),
(iii) by notice to Trustee declare Event of Default and cause a mandatory tender of bonds, thereby
causing the letter of credit to expire 15 days thereafter; (iv) pursue other rights under the Indenture and
otherwise available under equity and law.
Emergency Communications System Lease Revenue Refunding Bonds, Series 2010-R1 - Events of
default as specified in the Master Trust Agreement include: (i) failure to make lease payments when
due; or (ii) failure to observe covenants under the Master Lease. In an event of default, the trustee may
enforce all of its rights and remedies under the Master Lease, including the right to terminate the Master
Lease, enter the leased property, and remove all persons and property, reletting leased property for
account of the City for public purpose, or hold the Master Lease and sue each year for rent. The bonds
are not subject to acceleration.
Open Space Fund Lease Revenue Refunding Bonds, Series 2018A and Branch Library Improvement
Program Lease Revenue Refunding Bonds, Series 2018B - Events of default as specified in the Project
Lease include: (i) failure to make lease payments when due, (ii) or failure to observe covenants under
the Project Lease. In an event of default, the trustee may enforce all of its rights and remedies under
the Project Lease, including reletting property for account of the City, or sue each year for rent. The
bonds are not subject to acceleration.
San Francisco County Transportation Authority Long-Term Debt
In November 2017, the San Francisco County Transportation Authority (SFCTA) issued Senior Sales
Tax Revenue Bonds, Series 2017 (the Series 2017 Bonds) with a par value of $248.3 million to finance
the cost of construction, acquisition and improvement of certain transit, street, and traffic facilities and
other transportation projects, repay a portion of the outstanding amount of a revolving credit agreement,
pay capitalized interest on a portion of the Series 2017 Bonds and pay cost of issuance of the Series
2017 Bonds. The Series 2017 Bonds bear interest rates ranging from 3.0% to 4.0% and have final
maturity date of February 1, 2034. The outstanding principal on June 30, 2023, is $194.2 million. The
Series 2017 Bonds are repaid and secured by a pledge of Prop K half-cent sales tax and other legally
available revenues of the SFCTA. Based on the total sales tax revenue of $111.5 million for the year
ended June 30, 2023, the total debt service payments of $21.3 million on the Series 2017 Bonds, the
SFCTA’s senior debt service coverage ratio was 522% or 5.22x. Events of default for the bonds include

CITY AND COUNTY OF SAN FRANCISCO
Notes to Basic Financial Statements (Continued)
June 30, 2023
(Dollars in Thousands)
106
nonpayment events, bankruptcy events, and noncompliance with covenants. The Series 2017 Bonds
are not subject to acceleration.
In October 2021, the SFCTA entered into a Revolving Credit Agreement (RCA) with U.S. Bank National
Association for $125.0 million. The RCA is secured by a lien on the SFCTA’s sales tax revenues
subordinate to the lien on the sales tax revenues securing the Series 2017 Bonds and will expire in
October 2024.The SFCTA will use the RCA to fund the capital projects and programs included in the
Prop K Expenditure Plan. As of June 30, 2023, the SFCTA has no outstanding balance in the RCA.
Events of Default under the RCA include nonpayment events, noncompliance with covenants, default
on other specified debt, bankruptcy events, specified litigation events, or a ratings downgrade below
“Baa2” by Fitch, “BBB” by Moody’s or “BBB” by S&P. Remedies include acceleration (subject in some,
but not all, circumstances to a 270-day notice period) and the termination of the right of the SFCTA to
borrow under the RCA.
Events of Default and Remedies - Other Long-Term Obligations
Marina West Harbor Loans - Events of default include the failure to make loan payments within 30 days
of the due date, or failure to observe or comply with requirements under the Agreement within 180 days
of receipt of written notice. Remedies by the Department of Boating and Waterways by the State of
California includes the repossession of the project area, declaring that the loan is immediately due and
payable, and the exercise of all other rights and remedies available by law. The Marina West Harbor
Loan is subject to an acceleration provision.
Public Safety Radio Lease Financing - Events of default include the failure to make lease payments
when due, or failure to observe covenants under the Lease Purchase Financing Agreement. Remedies
of the lender are repossessing the leased equipment, enforcing rights under the Lease, and other
remedies available by law. The Public Safety Radio Lease Financing has no acceleration provision.
Special Tax District No. 2020-1 (Mission Rock Facilities and Services)
The following is a summary of long-term obligations of the City and County of San Francisco Special
Tax District No. 2020-1 as of June 30, 2023:
The Development Special Tax Bonds of STD 2020-1 were issued in order to finance infrastructure and
development costs for the Mission Rock Development Project. The bonds are secured under the
provisions of a Fiscal Agent Agreement and will be payable solely from the Revenues and funds
pledged under that agreement. Revenues generally consist of Special Tax Revenues and certain tax
increment of the City’s Infrastructure Financing District No. 2, Project Area I pledged to the bonds under
a Pledge Agreement.
In fiscal year 2022-23, tax increment revenues collected from the City’s Infrastructure Financing District
No. 2, Project Area I surpassed the one hundred thousand dollars threshold stipulated in the Pledge
Agreement. Accordingly, the taxes increment revenues collected were pledged by the City to the
Special Tax District. The pledge of allocated tax increment revenues to the STD created a financial
burden relationship between the City and the STD. This change in circumstance triggered Mission Rock
STD to become a blended component unit reported in a special revenue fund in the City’s financial
statements. These bonds are not payable from any other revenues or assets of the City. Neither the
Bonds
Remaining
Interest
Rates
Final
Maturity
Date
Amount
Development Special Tax Bonds Series 2021A 3.00% - 4.00% 2052 41,950$
Development Special Tax Bonds Series 2021B 4.00% - 5.25% 2050 54,280
Development Special Tax Bonds Series 2021C 4.00% 2052 10,000
Total obligations 106,230$

CITY AND COUNTY OF SAN FRANCISCO
Notes to Basic Financial Statements (Continued)
June 30, 2023
(Dollars in Thousands)
107
faith and credit nor the taxing power of the City, the State, or any political subdivision thereof are
pledged for the payment of the principal or interest on Special Tax Bonds of STD 2020-1.
The District is obligated to fund the 2021A Reserve Fund for the benefit of the 2021A bonds, the 2021C
Bonds and any other 2021A Related parity Bonds in an amount equal to the 2021A Reserve
Requirement, or the lesser of: (i) maximum annual debt service on the 2021A Bonds, 2021C Bonds
and any 2021A Related Parity Bonds; (ii) 125% of average annual debt service on the 2021A Bonds,
2021C Bonds and any 2021A Related Parity Bonds; or (iii) 10% of the outstanding principal amount of
the 2021A Bonds, 2021C Bonds and any 2021A Related Parity Bonds.
The District is obligated to fund the 2021B Reserve Fund for the benefit of the 2021B bonds and any
2021B Related Parity Bonds in an amount equal to the 2021B Reserve Requirement, or the lesser of:
(i) maximum annual debt service on the 2021B Bonds and any 2021B Related Parity Bonds; (ii) 125%
of average annual debt service on the 2021B bonds and any 2021B Related Parity Bonds; or (iii) 10%
of the outstanding principal amount of the 2021B Bond and any 2021B Related Parity Bonds.
As authorized under the Special Tax Financing Law, the City covenants with and for the benefit of the
Owners of the Bonds that it will order, and cause to be commenced as hereinafter provided, and
thereafter diligently prosecute to judgment (unless such delinquency is theretofore brought current), an
action in the superior court to foreclose the lien of any Development Special Tax or installment thereof
not paid when due. If by May 1 of each fiscal year, the City determines that any single Leasehold
Interest in a Taxable Parcel subject to the Development Special Taxes is delinquent in the payment of
one or more installments, then the City shall cause notice to be sent to the owner of the Leasehold
Interest within 45 days of such determination, and (if the delinquency remains unsecured) foreclosure
proceedings shall be commenced by the City within 60 days of such determination. The City may defer
any of such actions if (i) the District is participating in the Teeter Plan, (ii) the amount in the 2021A
Reserve Fund is at least equal to the 2021A Reserve Requirement and (iii) the amount in the reserve
account for any Parity Bonds that are not 2021A Related Parity Bonds is at least equal to the required
amount. The principal of the Bonds shall not be subject to acceleration.
Infrastructure and Revitalization Financing District No. 1 (Treasure Island)
The following is a summary of long-term obligations of the City and County of San Francisco
Infrastructure and Revitalization Financing District No. 1 (Treasure Island) as of June 30, 2023:
In September 2022, the City, on behalf of the City and County of San Francisco Infrastructure and
Revitalization Financing District No. 1 (Treasure Island) issued Tax Increment Revenue Bonds, Series
2022A (Facilities Increment) and Series 2022B (Housing Increment) (the 2022A Bonds and 2022B
Bonds) in the original par amounts of $24.3 million and $5.1 million, respectively. The 2022A Bonds
were issued to fund the acquisition of certain public facilities and improvements for the Treasure
Island/Yerba Buena Island Development Project, and the 2022B Bonds were issued to finance the
acquisition and construction of affordable housing on Treasure Island. The 2022A Bonds bear an
interest rate of 5.0%, with principal amortizing from September 1, 2023, through September 1, 2052.
The 2022B Bonds bear an interest rate of 5.0%, with principal amortizing from September 1, 2023,
through September 1, 2052.
Bonds
Remaining
Interest
Rates
Final
Maturity
Date
Amount
Tax Increment Revenue Bonds, Series 2022A (Facilities Increment) 5.00% 2053 24,270$
Tax Increment Revenue Bonds, Series 2022B (Housing Increment) 5.00% 2053 5,120
Total obligations
29,390$
CITY AND COUNTY OF SAN FRANCISCO
Notes to Basic Financial Statements (Continued)
June 30, 2023
(Dollars in Thousands)
108
The 2022A Bonds and 2022B Bonds are secured under the provisions of separate Indentures of Trust
and will be payable solely from Pledged Facilities Increment and Pledged Housing Increment,
respectively, pledged under those agreements. Revenues generally consist of tax increment of the
City’s Infrastructure Revitalization and Financing District No. 1, Project Areas A, B, C, D, and E. These
bonds are not a debt of the City, the State, or any political subdivision (other than the IRFD).
The District is obligated to fund the 2022 Facilities Reserve Requirement in an amount equal to the
least of (a) Maximum Annual Debt Service on the Series 2022A Facilities Bonds and 2022 Related
Facilities Bonds, if any, (b) 125% of average Annual Debt Service on the Series 2022A Facilities Bonds
and 2022 Related Facilities Bonds, if any and (c) 10% of the original principal of the Series 2022A
Facilities Bonds and 2022 Related Facilities Bonds.
The District is also obligated to fund the 2022 Housing Reserve Requirement in an amount equal to the
least of (a) Maximum Annual Debt Service on the Series 2022B Housing Bonds and 2022 Related
Housing Bonds, if any, (b) 125% of average Annual Debt Service on the Series 2022B Housing Bonds
and 2022 Related Housing Bonds, if any and (c) 10% of the original principal of the Series 2022B
Housing Bonds and 2022 Related Housing Bonds.
Events of default as specified in the Indenture of Trust for the Facilities Bonds consist of (i) default by
the IRFD in the due and punctual payment of principal and interest or redemption premium (if any) on
the Bonds when due and payable; (ii) default by the IRFD in the observance of any of the covenants,
agreements, or conditions in the Indenture or Facilities Bonds; and (iii) IRFD files a petition seeking
reorganization or arrangement under the federal bankruptcy laws or any other applicable law of the
U.S. In an Event of Default, the Trustee, may, and, if requested in writing by the Owners of a majority
in aggregate principal amount of the Facilities Bonds then Outstanding the Trustee shall (i) declare the
principal of the Facilities Bonds, together with the accrued interest thereon, to be due and payable
immediately, and upon any such declaration the same shall become immediately due and payable,
anything in the Indenture or in the Facilities Bonds to the contrary notwithstanding, and (ii) exercise
any other remedies available to the Trustee and the Owners of the Facilities Bonds in law or at equity.
Events of default as specified in the Indenture of Trust for the Housing Bonds consist of (i) default by
the IRFD in the due and punctual payment of principal and interest or redemption premium (if any) on
the Bonds when due and payable; (ii) default by the IRFD in the observance of any of the covenants,
agreements, or conditions in the Indenture or Housing Bonds; and (iii) IRFD files a petition seeking
reorganization or arrangement under the federal bankruptcy laws or any other applicable law of the
U.S. In an Event of Default, the Trustee, may, and, if requested in writing by the Owners of a majority
in aggregate principal amount of the Housing Bonds then Outstanding the Trustee shall (i) declare the
principal of the Housing Bonds, together with the accrued interest thereon, to be due and payable
immediately, and upon any such declaration the same shall become immediately due and payable,
anything in the Indenture or in the Housing Bonds to the contrary notwithstanding, and (ii) exercise any
other remedies available to the Trustee and the Owners of the Housing Bonds in law or at equity.
Business-Type Activities Long-Term Liabilities
The following provides a brief description of the current year additions to the long-term debt of the
business-type activities.

CITY AND COUNTY OF SAN FRANCISCO
Notes to Basic Financial Statements (Continued)
June 30, 2023
(Dollars in Thousands)
109
San Francisco International Airport
Second Series Revenue Bonds (Capital Plan Bonds)
Pursuant to resolutions adopted between fiscal years 2008 and 2022, as of June 30, 2023, the Airport
has authorized the issuance of up to $10.8 billion of San Francisco International Airport Second Series
Revenue Bonds (Capital Plan Bonds) to finance and refinance the construction, acquisition, equipping,
and development of capital projects undertaken by the Airport, including retiring all or a portion of the
Airport’s outstanding subordinate commercial paper notes (CP) issued for capital projects, funding debt
service reserves, funding capitalized interest, and for paying costs of issuance. As of June 30, 2023,
$4.2 billion of the authorized capital plan bonds remained unissued.
Second Series Revenue Refunding Bonds
Pursuant to resolutions adopted between fiscal years 2005 and 2023, as of June 30, 2023, the Airport
has authorized the issuance of up to $17.1 billion of San Francisco International Airport Second Series
Revenue Refunding Bonds for the purposes of refunding outstanding 1991 Master Bond Resolution
Bonds and outstanding CP, funding debt service reserves, and paying costs of issuance, including any
related bond redemption premiums. As of June 30, 2023, $7.2 billion of the authorized refunding bonds
remained authorized but unissued.
During fiscal year 2022-23, the Airport issued the following bonds for refunding and other purposes
under the 1991 Master Bond Resolution:
In March 2023, the Airport issued its fixed rate Second Series Revenue Bonds, Series 2023A (AMT),
and Second Series Revenue Bonds, Series 2023B (Non-AMT/Governmental Purpose), in an aggregate
principal amount of $241.9 million to refund a combined $261.5 million of its Series 2010A Bonds,
Series 2013A Bonds, and Series 2013B Bonds, to fund the termination payment of an interest rate
swap, and to pay costs of issuance.
The proceeds of the Series 2023A, and Series 2023B, (consisting of $241.9 million par amount and
original issue premium of $21.6 million, less underwriters’ discount of $0.5 million), together with $8.6
million accumulated in the debt service fund were used to deposit $265.0 million into redemption
accounts and escrow funds with the Senior Trustee to refund $261.5 million in revenue bonds as
described below, $5.5 million to fund the swap termination to payment, and $1.1 million to pay costs of
issuance.
The Series 2010A bonds were redeemed on March 31, 2023, and Series 2013A and Series 2013B
bonds identified in the table below were redeemed on May 1, 2023.
In aggregate, the Series 2023A/B refundings resulted in the recognition of a deferred accounting loss
of $3.5 million for the year ended June 30, 2023. The Series 2023A/B refundings decreased the
Airport’s aggregate gross debt service payments by approximately $23.9 million over the life of the
Interest
Rate
June 30, 2022
Amount
Refunded
June 30, 2023
Second Series Revenue Bonds Issue:
Series 2010A1 (AMT) variable 71,845$ 71,845$ -$
Series 2010A2 (AMT) variable 47,900 47,900 -
Series 2013A (AMT)
5.00%-5.50%
295,650 53,860 241,790
Series 2013B (Non-AMT/Governmental Purpose) 5.00% 87,860 87,860 -
Total 503,255$ 261,465$ 241,790$

CITY AND COUNTY OF SAN FRANCISCO
Notes to Basic Financial Statements (Continued)
June 30, 2023
(Dollars in Thousands)
110
bonds and obtained an economic gain (the difference between the present values of the debt service
on the old debt and the new debt) of $10.6 million.
Variable Rate Demand Bonds
As of June 30, 2023, the Airport had outstanding aggregate principal amount of $276.3 million,
consisting of Second Series Variable Rate Revenue Refunding Bonds, Series 2018B and
Series 2018C, (collectively, the “Variable Rate Bonds”) with final maturity dates of May 1, 2058
(Series 2018B and 2018C). The Variable Rate Bonds are long-term, tax-exempt bonds that currently
bear interest at a rate that is adjusted weekly, and that are subject to tender at par at the option of the
holder thereof on seven days’ notice. Any tendered Variable Rate Bonds are remarketed by the
applicable remarketing agent in the secondary market to other investors. The interest rate on the
Variable Rate Bonds can be converted to other interest rate modes, including a term rate or fixed rates
to maturity, upon appropriate notice by the Airport.
The scheduled payment of the principal of and interest on, and payment of purchase price of, the
Variable Rate Bonds is secured by separate irrevocable letters of credit issued to the Senior Trustee
for the benefit of the applicable bondholders by the banks identified in the table below.
Amounts drawn under a letter of credit that are not reimbursed by the Airport constitute “Repayment
Obligations” under the 1991 Master Bond Resolution and are accorded the status of other outstanding
bonds to the extent provided in the Resolution. The commitment fees for the letters of credit range
between 0.34% and 0.37% per annum. As of June 30, 2023, there were no unreimbursed draws under
these facilities.
The letters of credit securing the Variable Rate Bonds included in long-term debt as of June 30, 2023,
are as follows:
Hotel Special Facility Bonds
Pursuant to resolutions adopted in fiscal years 2017, 2018 and 2019, the Airport authorized the
issuance of $260.0 million of Special Facility Bonds to finance an on-Airport Hotel. These resolutions
also designated the on-Airport Hotel as a “Special Facility” under the 1991 Master Bond Resolution,
which allows the hotel revenues to be segregated from the Airport’s other revenues and used to pay
hotel operating expenses and debt service on the Hotel Special Facility Bonds through the Hotel Special
Facility Bond trustee. In June 2018, the Airport issued its fixed rate Special Facility Revenue Bonds
(San Francisco International Airport Hotel), Series 2018 (Hotel Special Facility Bonds), in the aggregate
principal amount of $260.0 million to finance the on-Airport Hotel and to fund a capitalized interest
account.
The Hotel Special Facility Bonds are issued pursuant to a Trust Agreement (Hotel Trust Agreement).
In February 2021, the Hotel Special Facility Bonds, and the trust agreement pursuant to which they
were issued were amended and restated, including to delay the initial principal repayment until April 1,
2025 (instead of April 1, 2022) and temporarily reduce the interest rate on the Hotel Special Facility
Bonds from 3.00% to 0.086% from April 1, 2020, through September 30, 2023. The interest rate will
then increase incrementally until it is restored to 3.00% beginning on April 1, 2029. In addition, the
Series 2018B Series 2018C
Principal amount
$
138,170
$
138,170
Expiration date June 3, 2026 April 5, 2027
Credit provider Barclays
(1)
SMBC
(2)
(1) Barclays Bank PLC
(2) Sumitomo Mitsui Banking Corporation, acting through its New York branch

CITY AND COUNTY OF SAN FRANCISCO
Notes to Basic Financial Statements (Continued)
June 30, 2023
(Dollars in Thousands)
111
amendments provided that October 1, 2020, is no longer an interest payment date, and there is no
requirement to pay interest accrued on the Hotel Special Facility Bonds until October 1, 2023. The
maximum principal amount of the Hotel Special Facility Bonds is not limited by the Hotel Trust
Agreement, but the Airport must satisfy an additional bonds test prior to the issuance of any such bonds.
The Hotel Special Facility Bonds are limited obligations of the Airport. Under the Hotel Trust Agreement,
the Airport has pledged the Revenues of the on-Airport Hotel, together with other assets, to the payment
of the principal of and interest on the Hotel Special Facility Bonds. Revenues are generally defined in
the Hotel Trust Agreement as all revenue and income of any kind derived directly or indirectly from
operations at the on-Airport Hotel (not including certain amounts specified in the Hotel Trust
Agreement). Operating expenses of the on-Airport Hotel are payable prior to payment of principal of
and interest on the Hotel Special Facility Bonds. The Airport does not maintain a reserve account for
the Hotel Special Facility Bonds. The Hotel Special Facility Bonds are subject to acceleration upon the
occurrence of an event of default. Events of default include nonpayment events, bankruptcy events,
noncompliance with covenants, condemnation of the hotel, or a failure by the Airport to maintain a third-
party manager for the hotel. The Hotel Special Facility Bonds are not payable from or secured by the
Airport’s Net Revenues (as defined under the 1991 Master Bond Resolution). However, because the
Airport is the owner of the on-Airport Hotel, the Airport is obligated to repay the Hotel Special Facility
Bonds from the net revenues of the hotel.
Because the Airport is the issuer of the Hotel Special Facility Bonds and the sole beneficiary of the trust
entity serving as holder of the Hotel Special Facility Bonds, neither the Hotel Special Facility Bonds
debt service payments nor the Airport’s receipts from the trust are included in the accompanying
financial statements. The financial statements net the interest income received from the trust against
the combined interest expenses of the Hotel Special Facility Bonds and the Series 2018B/C Bonds.
As of June 30, 2023, the Airport had $260.0 million of outstanding Hotel Special Facility Bonds.
Interest Rate Swaps
The Airport entered into forward starting interest rate swaps in connection with the anticipated issuance
of its Second Series Variable Rate Revenue Refunding Bonds, Series 2010A, on February 10, 2010.
The swap structure was intended as a means to increase the Airport’s debt service savings by setting
a low synthetic fixed rate in advance of the first date that tax-exempt variable rate refunding bonds
could be issued in the future to refinance callable bonds.
The Airport terminated these interest rate swaps in August 2019 and March 2023.
Debt Service Reserves and Requirements
Issue 1 Reserve Account - As of June 30, 2023, the reserve requirement for the Issue 1 Reserve
Account was $534.9 million, which was satisfied by $539.5 million of cash and investment securities,
and reserve fund surety policies in the initial principal amount of $108.6 million. All of the providers of
such reserve policies have one or more credit ratings below the Airport’s rating or are no longer rated.
In addition, $27.5 million of such surety policies have likely experienced a reduction in value in
accordance with their terms.
2017 Reserve Account - As of June 30, 2023, the reserve requirement for the 2017 Reserve Account
was $40.6 million, which was satisfied by $57.1 million in cash and investment securities.
Series Not Secured by Reserve Accounts - The Airport does not maintain reserve accounts for its
Second Series Variable Rate Revenue Refunding Bonds, Series 2018B/C, all of which are secured by
letters of credit.

CITY AND COUNTY OF SAN FRANCISCO
Notes to Basic Financial Statements (Continued)
June 30, 2023
(Dollars in Thousands)
112
Cash Defeasance of Bonds
In June 2023, the Airport legally defeased $28.8 million of its Series 2019D Bonds, using monies
previously deposited by the Airport in the Debt Service Fund.
The outstanding balance of Series 2019D Bonds for the year ended June 30, 2023, is as follows:
Events of default for the bonds include nonpayment events, bankruptcy events, and noncompliance
with covenants, including the rate covenants described below. The bonds are not subject to
acceleration.
Payment of principal, interest and purchase price of bonds that bear interest at variable interest rates
are supported by letters of credit. Events of default with respect to the letters of credit supporting the
bonds include nonpayment events, bankruptcy events, noncompliance with covenants, default on debt
in excess of a specified threshold amount, default under the 1991 Master Bond Resolution, or a
determination of taxability of interest on tax-exempt bonds supported by the letter of credit. A
downgrade of the Airport’s Senior Bonds to below “Baa1” or “BBB+” or withdrawal or suspension of a
bond rating for credit-related reasons by any rating agency is an event of termination under the letters
of credit supporting the bonds. Remedies include the letter of credit bank’s ability to cause a mandatory
tender of the supported bonds or to accelerate amounts due and payable to the bank; provided that
payments made on a parity with the bonds are capped based on provisions in the 1991 Master Bond
Resolution. If there are no default events pending, drawings under the respective letters of credit
supporting the bonds are amortized over a three- or five-year period; provided that payments made on
a parity with the bonds are capped based on provisions in the 1991 Master Bond Resolution.
San Francisco Water Enterprise
Clean Water State Revolving Fund (CWSRF) Loan and Grant
In September 2017, the SFPUC entered into an Installment Sale Agreement with the State Water
Resources Control Board for a Clean Water State Revolving Fund (CWSRF) Loan and Grant to fund
the Water Enterprise’s SF Westside Recycled Water Project. The CWSRF loan is in the amount of
$186.2 million, which includes $15.0 million of principal forgiveness, or a grant. It will bear an interest
rate of 1.0% for a 30-year term, with loan repayment beginning one year after substantial completion
of project construction. The CWSRF loan is secured on a parity lien basis with the Enterprise’s
outstanding revenue bonds. The principal outstanding as of June 30, 2023, was $131.5 million. In
addition, there was $15.0 million of principal forgiveness.
Drinking Water State Revolving Fund (DWSRF) Loan
In April 2022, the SFPUC entered into an Installment Sale Agreement with the State Water Resources
Control Board for a Drinking Water State Revolving Fund (DWSRF) Loan to fund the Enterprise’s
Mountain Tunnel Improvement Project. The DWSRF loan is in the amount of $238.2 million. It will bear
an interest rate of 1.1% for a 30-year term, with interest payments beginning annually after the initial
loan proceed draw occurs and loan principal repayment beginning one year after substantial completion
of project construction. Power Enterprise is responsible for repayment for its share of SRF Loan debt
service costs representing up to its allocable share of the cost of the Mountain Tunnel Project by a
Memorandum of Understanding that will be executed with the Water Enterprise. The DWSRF loan is
Bond Series June 30, 2022
Cash
Defeasance
Amount
June 30, 2023
2019D 402,115$ 28,820$ 373,295$
CITY AND COUNTY OF SAN FRANCISCO
Notes to Basic Financial Statements (Continued)
June 30, 2023
(Dollars in Thousands)
113
secured on a parity lien basis with the Enterprise’s outstanding revenue bonds. The principal
outstanding as of June 30, 2023, was $32.1 million.
Events of Default and Remedies
Water Revenue Bonds, and State Revolving Fund Loans - Events of default as specified in the Water
Enterprise Indenture, include non-payment, material breach of warranty, representation, or indenture
covenants (not cured within applicable grace periods), and bankruptcy and insolvency events, which
may result in the Trustee (upon written request by the majority of the owners, by aggregate amount of
the bond obligations or of a credit provider), declaring the principal and the interest accrued thereon, to
be due and payable immediately. As of June 30, 2023, there were no such events described herein.
Hetch Hetchy Water and Power
Events of Default and Remedies
Power Revenue Bonds and Energy Bonds - Significant events of default as specified in the Power
Enterprise Indenture and Equipment Lease/Purchase Agreement include non-payment, material
breach of warranty, representation, or indenture covenants (not cured within applicable grace periods),
and bankruptcy and insolvency events, which may result in the Trustee (upon written request by the
majority of the owners by aggregate amount of the bond obligations) declare the principal and the
interest accrued thereon to be due and payable immediately. As of June 30, 2023, there were no such
events described herein.
Wastewater Enterprise
Wastewater Revenue Refunding Bonds 2022 Series B
In July 2022, the Wastewater Enterprise issued tax-exempt revenue bonds, 2022 Series B in the
aggregate amount of $137.1 million on a forward delivery basis. The 2022 Series B bonds were issued
for the purpose of refunding a portion of the outstanding 2013 Series A bonds maturing on October 1,
2024, and October 1, 2025, and a portion of the outstanding 2013 Series B bonds maturing on October
1, 2024, through October 1, 2034.
The 2022 Series B bonds include serial bonds, each with an interest rate of 5.0% and have a final
maturity in 2034. The refunding resulted in the recognition of a deferred accounting gain of $6.9 million,
gross debt service savings of $12.4 million and an economic gain of $12.0 million or 8.0% of refunded
bonds.
Wastewater Revenue Refunding Bonds 2023 Series ABC
In April 2023, the Wastewater Enterprise issued tax-exempt revenue bonds, 2023 Series ABC in an
aggregate principal amount of $974.4 million to refund approximately $557.8 million aggregate principal
amount of CP notes, finance various capital projects of the Wastewater Enterprise, and refund certain
outstanding revenue bonds.
The $530.6 million 2023 Series A bonds were issued as tax-exempt Green Bonds to refund
approximately $400.9 million of CP notes for SSIP capital projects and finance certain capital projects
benefitting the Wastewater Enterprise. The Series A bonds were issued as serial bonds with coupons
of 5.0% and 5.3% and a final maturity of 2042.
CITY AND COUNTY OF SAN FRANCISCO
Notes to Basic Financial Statements (Continued)
June 30, 2023
(Dollars in Thousands)
114
The $278.1 million 2023 Series B bonds were issued as tax-exempt bonds to refund a portion of the
outstanding 2013 Series B bonds maturing on October 1, 2035, through October 1, 2039, refund
approximately $156.9 million of CP notes for certain capital projects benefitting the Wastewater
Enterprise. The Series B bonds were issued as serial bonds with coupons of 4.0% and 5.0% and a final
maturity of 2042. The refunding resulted in the recognition of a deferred accounting gain of $5.3 million
and gross debt service savings of $10.6 million.
The $165.7 million 2023 Series C bonds were issued as tax-exempt Green Bonds to refund all of the
outstanding 2018 Series C bonds. The Series C bonds were issued as serial bonds with a coupon of
4.0% and a final maturity of 2048. The refunding resulted in the recognition of a deferred accounting
gain of $1.0 million, gross debt service savings of $24.6 million, and an economic gain of $15.8 million
or 8.8% of refunded bonds.
Lake Merced Green Infrastructure Project CWSRF Loan
In January 2016, then amended in May 2016, the SFPUC entered into an Installment Sale Agreement
with the State Water Resources Control Board for a Clean Water State Revolving Fund (CWSRF) Loan
to fund the Lake Merced Green Infrastructure Project of the Sewer System Improvement Program. The
aggregate amount of the CWSRF loans is $7.4 million. The loan bears an interest rate of 1.6% which
was equal to one-half of the State of California’s most recent 30-year General Obligation Bond true
interest cost at the time the agreement was executed. The CWSRF loan will have a 30-year term, with
loan repayment beginning one year after substantial completion of each project’s construction;
completion was in October 2020. The CWSRF loan is secured on a parity lien basis with the
Enterprise’s outstanding revenue bonds. The SFPUC has received loan disbursements to date totaling
$6.1 million and a construction period interest of $0.17 million transferred to principal. As of June 30,
2023, the principal amount outstanding of the loan was $5.9 million.
Southeast Plant (SEP) 521/522 and Disinfection Upgrade Project CWSRF Loan
In September 2017, then amended in December 2017 and May 2018, the SFPUC entered into an
Installment Sale Agreement with the State Water Resources Control Board for a CWSRF Loan to fund
the SEP 521/522 and Disinfection Upgrade Project of the Sewer System Improvement Program. The
aggregate amount of the CWSRF loans is $40.0 million. The loan bears an interest rate of 1.8% which
was equal to one-half of the State of California’s most recent 30-year General Obligation Bond true
interest cost at the time the agreement was executed. The CWSRF loan will have a 30-year term, with
loan repayment beginning one year after substantial completion of each project’s construction;
substantial completion occurred in July 2019. The CWSRF loan is secured on a parity lien basis with
the Enterprise’s outstanding revenue bonds. The SFPUC has received proceeds from loan
disbursements to date totaling $39.7 million. As of June 30, 2023, the principal amount outstanding of
the loan was $36.4 million.
North Point Facility Outfall Rehabilitation Project CWSRF Loan
In September 2017, the SFPUC entered into an Installment Sale Agreement with the State Water
Resources Control Board for a CWSRF Loan to fund the North Point Facility Outfall Rehabilitation
Project of the Sewer System Improvement Program. The aggregate amount of the CWSRF loans is
$20.2 million. The loan bears an interest rate of 1.8% which was equal to one-half of the State of
California’s most recent 30-year General Obligation Bond true interest cost at the time the agreement
was executed. The CWSRF loan will have a 30-year term, with loan repayment beginning one year
after substantial completion of each project’s construction; substantial completion occurred in February
2018. The CWSRF loan is secured on a parity lien basis with the Enterprise’s outstanding revenue
bonds. The SFPUC has received proceeds from loan disbursements to date totaling $17.7 million. As
of June 30, 2023, the principal amount outstanding of the loan was $15.2 million.
CITY AND COUNTY OF SAN FRANCISCO
Notes to Basic Financial Statements (Continued)
June 30, 2023
(Dollars in Thousands)
115
Southeast Plant (SEP) Primary/Secondary Clarifier Upgrade Project CWSRF Loan
In September 2017, the SFPUC entered into an Installment Sale Agreement with the State Water
Resources Control Board for a CWSRF Loan to fund the SEP Primary/Secondary Clarifier Upgrade
Project of the Sewer System Improvement Program. The aggregate amount of the CWSRF loans is
$34.4 million. The loan bears an interest rate of 0.8% which was equal to one-half of the State of
California’s most recent 30-year General Obligation Bond true interest cost at the time the agreement
was executed. The CWSRF loan will have a 30-year term, with loan repayment beginning one year
after substantial completion of each project’s construction; substantial completion occurred in June
2018. The CWSRF loan is secured on a parity lien basis with the Enterprise’s outstanding revenue
bonds. The SFPUC has received proceeds from loan disbursements to date totaling $29.2 million. As
of June 30, 2023, the principal amount outstanding of the loan was $25.3 million.
Oceanside (OSP) Digester Gas Utilization Upgrade Project
In May 2020, the SFPUC entered into an Installment Sale Agreement with the State Water Resources
Control Board for a CWSRF Loan to fund the OSP Digester Gas Utilization Upgrade Project of the
Sewer System Improvement Program. The CWSRF loan is in the amount of $54.4 million, which
includes $4.0 million of principal forgiveness, or a grant. The loan bears an interest rate of 1.4% which
was equal to one-half of the State of California’s most recent 30-year General Obligation Bond true
interest cost at the time the agreement was executed. The CWSRF loan will have a 30-year term, with
loan repayment beginning one year after substantial completion of each project’s construction. The
CWSRF loan is secured on a parity lien basis with the Enterprise’s outstanding revenue bonds. The
SFPUC has received proceeds from loan disbursements to date totaling $33.2 million, which included
a loan forgiveness grant of $4.0 million. As of June 30, 2023, the principal amount outstanding of the
loan was $29.2 million.
Southeast Plant (SEP) Biosolids Digester Facilities Project
In May 2020, the SFPUC entered into an Installment Sale Agreement with the State Water Resources
Control Board for a CWSRF Loan to fund the SEP Biosolids Digester Facilities Project of the Sewer
System Improvement Program. The CWSRF loan is in the amount of $132.0 million, which includes
$4.0 million of principal forgiveness, or a grant. The loan bears an interest rate of 1.4% which was equal
to one-half of the State of California’s most recent 30-year General Obligation Bond true interest cost
at the time the agreement was executed. The CWSRF loan will have a 30-year term, with loan
repayment beginning one year after substantial completion of each project’s construction; substantial
completion is expected in May 2026. The CWSRF loan is secured on a parity lien basis with the
Enterprise’s outstanding revenue bonds. The SFPUC has received proceeds from loan disbursements
to date totaling $132.0 million, which includes a $4.0 million loan forgiveness grant. As of June 30,
2023, the principal amount outstanding of the loan was $128.0 million.
Southeast Plant (SEP) New Headworks (Grit) Replacement Project
In May 2021, the SFPUC entered into an Installment Sale Agreement with the State Water Resources
Control Board for a CWSRF Loan to fund the SEP New Headworks (Grit) Replacement Project of the
Sewer System Improvement Program. The CWSRF loan is in the amount of $112.0 million. The loan
bears an interest rate of 1.1% which was equal to one-half of the State of California’s most recent 30-
year General Obligation Bond true interest cost at the time the agreement was executed. The CWSRF
loan will have a 30-year term, with loan repayment beginning one year after substantial completion of
each project’s construction; substantial completion is expected in March 2024. The CWSRF loan is
secured on a parity lien basis with the Enterprise’s outstanding revenue bonds. The SFPUC has
received proceeds from loan disbursements to date totaling $64.7 million and a receivable for
reimbursement of $13.9 million. As of June 30, 2023, the principal amount outstanding of the loan was
$78.6 million.
CITY AND COUNTY OF SAN FRANCISCO
Notes to Basic Financial Statements (Continued)
June 30, 2023
(Dollars in Thousands)
116
WIFIA Loan Agreement-Biosolids Digester Facility Project
In July 2018, the SFPUC entered into a Water Infrastructure Finance and Innovation Act (WIFIA) Loan
Agreement (WIFIA Loan) with the United States Environmental Protection Agency in the amount of
$699.2 million. The WIFIA Loan was entered into pursuant to the WIFIA statute authorized by Congress
in 2014. The WIFIA Loan will fund 49% of the costs of the Wastewater Enterprise’s Biosolids Digester
Facility Project plus certain eligible expenses. Payment of the WIFIA Loan will be secured by a senior
lien pledge of the Wastewater Enterprise’s net revenues and is on a parity lien basis with the SFPUC’s
outstanding Wastewater Revenue Bonds and CWSRF Loans entered into with the California State
Water Resources Control Board.
The original 2018 loan bears a fixed interest rate of 3.09% for a 35-year term, with loan repayment
expected to begin in fiscal year 2026, after substantial completion of the project construction. In June
2020, the SFPUC re-executed the WIFIA Loan Agreement to have a fixed interest rate of 1.45% for a
35-year term. All other terms of the WIFIA Loan Agreement were unchanged.
In March of 2023, the SFPUC received disbursement of $122.3 million in respect to eligible project
costs and a capitalized interest of $74 added to principal. As of June 30, 2023, the principal amount of
loan outstanding was $122.4 million.
WIFIA Loan Agreement-Southeast Treatment Plant Improvements
In June 2020, the SFPUC entered into a WIFIA Loan with the United States Environmental Protection
Agency in the amount of $513.9 million. The WIFIA Loan was entered into pursuant to the WIFIA statute
authorized by Congress in 2014. The WIFIA Loan will fund 49% of the costs of the Wastewater
Enterprise’s SEP New Headworks Replacement Project and additional costs of the revised Biosolids
Digester Facility Project plus certain eligible expenses. Payment of the WIFIA Loan will be secured by
a senior lien pledge of the Wastewater Enterprise’s net revenues and is on a parity lien basis with the
SFPUC’s outstanding Wastewater Revenue Bonds and CWSRF Loans entered into with the California
State Water Resources Control Board. The loan will bear a fixed interest rate of 1.45% for a 35-year
term, with loan repayment expected to begin in fiscal year 2025, after substantial completion of project
construction. The SFPUC has not submitted any requests for loan disbursements to date and there is
no outstanding loan principal as of June 30, 2023.
WIFIA Master Loan Agreement and Project 1 Loan Agreement
In April 2023, the SFPUC entered into a Loan Agreement with the United States Environmental
Protection Agency. The WIFIA Master Agreement and Project 1 Loan was entered into pursuant to the
WIFIA authorized by Congress in 2014. The SFPUC entered the WIFIA Master Loan Agreement with
the EPA in an amount not to exceed $791.3 million to provide partial funding for projects in the
Wastewater Enterprise Capital Plan. The Master Agreement defines the general terms for funding a
series of WIFIA loans, the first of which is the “Project 1 Loan Agreement”. The incurrence of the Project
1 Loan Agreement, in an aggregate initial principal amount not to exceed $369.3 million will provide
partial funding for six Wastewater Enterprise capital improvement projects. Those projects are
Westside Pump Station Reliability Improvements, North Shore Pump Station Wet Weather
Improvements, Wawona Area Stormwater Improvement, New Treasure Island Wastewater Treatment
Plant, Folsom Area Stormwater Improvement, and Yosemite Creek Daylighting. Proceeds of the loan
will fund 49% of project costs plus eligible expenses. The Project 1 Loan is on a parity lien basis with
the SFPUC’s outstanding Wastewater Revenue Bonds and CWSRF Loans entered into with the
California State Water Resources Control Board. The loan will bear a fixed interest rate of 3.65% for a
32-year term, with loan repayment expected to begin in fiscal year 2033. The SFPUC has not yet
submitted any requests for loan disbursements to date and there is no outstanding loan principal as of
June 30, 2023.
CITY AND COUNTY OF SAN FRANCISCO
Notes to Basic Financial Statements (Continued)
June 30, 2023
(Dollars in Thousands)
117
Events of Default and Remedies
Wastewater Revenue Bonds, SRF Loans, and WIFIA Loan - Events of default as specified in the
Wastewater Enterprise Indenture include non-payment, material breach of warranty, representation, or
indenture covenants which are not cured within applicable grace periods, and bankruptcy and
insolvency events. The trustee, upon written request, by majority of the owners (by aggregate amount
of the bond obligations or of a credit provider), shall declare the principal and interest accrued thereon,
to be due and payable immediately. As of June 30, 2023, there were no such events described herein.

CITY AND COUNTY OF SAN FRANCISCO
Notes to Basic Financial Statements (Continued)
June 30, 2023
(Dollars in Thousands)
118
(9) EMPLOYEE BENEFIT PROGRAMS
(a) Retirement Plans
General Information About the Pension Plans – The San Francisco City and County Employees’
Retirement System (Retirement System) administers a cost-sharing multiple-employer defined benefit
pension plan (SFERS Plan), which covers substantially all of the employees of the City and County of
San Francisco, and certain classified and certificated employees of the San Francisco Community
College and Unified School Districts, and San Francisco Trial Court employees other than judges. The
San Francisco City and County Charter and the Administrative Code are the authority which establishes
and amends the benefit provisions and employer obligations of the SFERS Plan. The Retirement
System issues a publicly available financial report that includes financial statements and required
supplementary information for the SFERS Plan. That report may be obtained on the Retirement
System’s website at http://mysfers.org or by writing to the San Francisco City and County Employees’
Retirement System, 1145 Market Street, 5
th
Floor, San Francisco, CA 94103 or by calling (415) 487-
7000.
Replacement Benefits Plan – The Replacement Benefits Plan (RBP) is a qualified excess benefit plan
established in October 1989. Internal Revenue Code Section 415(m) provides for excess benefit
arrangements that legally permit benefit payments above the Section 415 limits, provided that the
payments are not paid from the SFERS Trust. The RBP allows the City to pay SFERS retirees any
portion of the Charter-mandated retirement allowance that exceeds the annual Section 415(b) limit.
The RBP plan does not meet the criteria of a qualified trust under GASB Statement No. 73 because
RBP assets are subject to the claims of the employer’s general creditors under federal and State law
in the event of insolvency.
In addition, some City employees are eligible to participate in the Public Employees’ Retirement Fund
(PERF) of the California Public Employees’ Retirement System (CalPERS) Safety Plan, an agent multi-
employer pension plan, or the CalPERS Miscellaneous Rate Plan, included in CalPERS public agency
cost-sharing multiple-employer pension plan. Some employees of the Transportation Authority, a
blended component unit, and the Successor Agency, a fiduciary component unit, are eligible to
participate in a CalPERS Miscellaneous Rate Plan or a CalPERS Public Employees’ Pension Reform
Act (PEPRA) Miscellaneous Rate Plan, both rate plans are included in CalPERS public agency cost-
sharing multiple-employer pension plan. In addition, some employees of the Treasure Island
Development Authority, a discretely presented component unit, are eligible to participate in the
CalPERS Miscellaneous Rate Plan included in CalPERS public agency cost-sharing multiple-employer
pension plan.
CalPERS acts as a common investment and administrative agent for various local and State
governmental agencies within the State of California . Benefit provisions and other requirements are
established by State statute, employer contract with CalPERS, by City resolution and resolution of
component units. CalPERS issues publicly available reports that include a full description of the pension
plans regarding benefit provisions, assumptions and membership information that can be found on the
CalPERS website at www.calpers.ca.gov.

CITY AND COUNTY OF SAN FRANCISCO
Notes to Basic Financial Statements (Continued)
June 30, 2023
(Dollars in Thousands)
119
Benefits
SFERS – The SFERS Plan provides service retirement, disability, and death benefits based on
specified percentages of defined final average monthly salary and provides annual cost-of-living
adjustments (COLA) after retirement. The SFERS Plan also provides pension continuation benefits to
qualified survivors. The Retirement System pays benefits according to the category of employment and
the type of benefit coverage provided by the City. The four main categories of SFERS Plan members
are:
• Miscellaneous Non-Safety Members – staff, operational, supervisory, and all other eligible
employees who are not in special membership categories.
• Sheriff’s Department and Miscellaneous Safety Members – sheriffs assuming office on and after
January 7, 2012, and undersheriffs, deputized personnel of the Sheriff’s Department, and
miscellaneous safety employees hired on and after January 7, 2012.
• Firefighter Members – firefighters and other employees whose principal duties are in fire prevention
and suppression work or who occupy positions designated by law as firefighter member positions.
• Police Members – police officers and other employees whose principal duties are in active law
enforcement or who occupy positions designated by law as police member positions.
The membership groups and the related service retirement benefits are summarized as follows:
Miscellaneous Non-Safety Members who became members prior to July 1, 2010, qualify for a service
retirement benefit if they are at least 50 years old and have at least 20 years of credited service or if
they are at least 60 years old and have at least 10 years of credited service. The service retirement
benefit is calculated using the member’s final compensation (highest one-year average monthly
compensation) multiplied by the member’s years of credited service times the member’s age factor up
to a maximum of 75% of the member’s final compensation.
Miscellaneous Non-Safety Members who became members on or after July 1, 2010, and prior to
January 7, 2012 qualify for a service retirement benefit if they are at least 50 years old and have at
least 20 years of credited service or if they are at least 60 years old and have at least 10 years of
credited service. The service retirement benefit is calculated using the member’s final compensation
(highest two-year average monthly compensation) multiplied by the member’s years of credited service
times the member’s age factor up to a maximum of 75% of the member’s final compensation.
Miscellaneous Non-Safety Members who became members on or after January 7, 2012, qualify for a
service retirement benefit if they are at least 53 years old and have at least 20 years of credited service
or if they are at least 60 years old and have at least 10 years of credited service. The service retirement
benefit is calculated using the member’s final compensation (highest three-year average monthly
compensation) multiplied by the member’s years of credited service times the member’s age factor up
to a maximum of 75% of the member’s final compensation.
Sheriff’s Department Members and Miscellaneous Safety Members who were hired on or after
January 7, 2012 qualify for a service retirement benefit if they are at least 50 years old and have at
least 5 years of credited service. The service retirement benefit is calculated using the member’s final
compensation (highest three-year average monthly compensation) multiplied by the member’s years
of credited service times the member’s age factor up to a maximum of 90% of the member’s final
compensation.
CITY AND COUNTY OF SAN FRANCISCO
Notes to Basic Financial Statements (Continued)
June 30, 2023
(Dollars in Thousands)
120
Firefighter Members and Police Members who became members before November 2, 1976, qualify for
a service retirement benefit if they are at least 50 years old and have at least 25 years of credited
service. The service retirement benefit is calculated using the member’s final compensation (monthly
salary earnable at the rank or position the member held for at least one year immediately prior to
retiring) multiplied by the member’s years of credited service times the member’s age factor up to a
maximum of 90% of the member’s final compensation.
Firefighter Members and Police Members who became members on or after November 2, 1976, and
prior to July 1, 2010 qualify for a service retirement benefit if they are at least 50 years old and have at
least 5 years of credited service. The service retirement benefit is calculated using the member’s final
compensation (highest one-year average monthly compensation) multiplied by the member’s years of
credited service times the member’s age factor up to a maximum of 90% of the member’s final
compensation.
Firefighter Members and Police Members who became members on or after July 1, 2010, and prior to
January 7, 2012 qualify for a service retirement benefit if they are at least 50 years old and have at
least 5 years of credited service. The service retirement benefit is calculated using the member’s final
compensation (highest two-year average monthly compensation) multiplied by the member’s years of
credited service times the member’s age factor up to a maximum of 90% of the member’s final
compensation.
Firefighter Members and Police Members who became members on or after January 7, 2012, qualify
for a service retirement benefit if they are at least 50 years old and have at least 5 years of credited
service. The service retirement benefit is calculated using the member’s final compensation (highest
three-year average monthly compensation) multiplied by the member’s years of credited service times
the member’s age factor up to a maximum of 90% of the member’s final compensation.
All members are eligible to apply for a disability retirement benefit, regardless of age, when they have
10 or more years of credited service and they sustain an injury or illness that prevents them from
performing their duties. Safety members are eligible to apply for an industrial disability retirement benefit
from their first day on the job if their disability is caused by an illness or injury that they receive while
performing their duties.
All members’ qualified surviving spouses and qualified domestic partners are eligible to apply for death
benefits prior to or after member’s retirement.
Death benefit prior to retirement generally, upon death of the active member who is eligible for a service
retirement, qualified surviving spouse and qualified domestic partner receive continuation benefits
equal to 50% to 100% of the member’s retirement allowance that the member would have received had
he or she retired on the date of death. The qualified surviving spouses and qualified domestic partners
of Safety members who die prior to becoming eligible for service retirement and whose death is due to
an injury received in or illness caused by the performance of duty, salary continuation is provided to
the qualified survivor until such time as the member would have qualified for service retirement had he
or she lived at which time a continuation benefit equal to 100% of the member’s service retirement
allowance is provided to the qualified survivor. A lump sum death payment equal to 6 months’ earnable
salary plus the member’s accumulated contributions is provided upon the death of an active employee
not yet eligible for a service retirement to the member’s named beneficiary or estate.
Death benefit after retirement generally, upon the death of a retired member, the Retirement System
provides continuation benefits to a qualified surviving spouse or qualified domestic partner equal to
50% to 100% of the member’s retirement allowance as of the date of death.
All retired members receive a benefit adjustment each July 1, which is the Basic COLA. The majority
of adjustments are determined by changes in the Consumer Price Index (CPI) with increases capped
at 2%. The SFERS Plan provides for a Supplemental COLA in years when there are sufficient “excess”
investment earnings in the Plan. The maximum benefit adjustment each July 1 is 3.5% including the

CITY AND COUNTY OF SAN FRANCISCO
Notes to Basic Financial Statements (Continued)
June 30, 2023
(Dollars in Thousands)
121
Basic COLA. Effective July 1, 2012, voters approved changes in the criteria for payment of the
Supplemental COLA benefit, so that Supplemental COLAs would only be paid when the Plan is also
fully funded on a market value of assets basis. Certain provisions of this voter-approved proposition
were challenged in the Courts. A decision by the California Courts modified the interpretation of the
proposition. Effective July 1, 2012, members who retired before November 6, 1996, will receive a
Supplemental COLA only when the Plan is also fully funded on a market value of assets basis.
However, the “full funding” requirement does not apply to members who retired on or after November
6, 1996, and were hired before January 7, 2012. For all members hired before January 7, 2012, all
Supplemental COLAs paid to them in retirement benefits will continue into the future even when an
additional Supplemental COLA is not payable in any given year. For members hired on and after
January 7, 2012, a Supplemental COLA will only be paid to retirees when there are sufficient “excess”
investment earnings in the Plan and the Plan is also fully funded on a market value of asset basis and
in addition for these members, Supplemental COLAs will not be permanent adjustments to retirement
benefits. That is, in years when a Supplemental COLA is not paid, all previously paid Supplemental
COLAs will expire.
CalPERS – CalPERS provides service retirement and disability benefits, annual cost-of-living
adjustments and death benefits to plan members, who must be public employees and beneficiaries.
Benefits are based on a final compensation, which is the highest average pay rate and special
compensation during any consecutive one-year or three-year period. The cost-of-living adjustments for
the CalPERS plans are applied as specified by the Public Employees’ Retirement Law. The California
PEPRA, which took effect in January 2013, changes the way CalPERS retirement and health benefits
are applied, and places compensation limits on members. As such, members who established
CalPERS membership on or after January 1, 2013, are known as “PEPRA” members.
The CalPERS’ provisions and benefits in effect at June 30, 2023, are summarized as follows:
CalPERS’ Provisions and Benefits
Prior to On or after
January 1, 2013 January 1, 2013
Benefit formula
2% @ 50, 2% @
55, or 3% @ 55
2% @ 57 or
2.7% @ 57
Benefit vesting schedule 5 years of service 5 years of service
Benefit payments Monthly for life Monthly for life
Required employee contribution rates 7.00% to 9.00%
11.50% to 14.50%
Required employer contribution rates 23.70% 23.70%
City Safety Plan
Hire date
* For the City Miscellaneous Plan and the Treasure Island Miscellaneous Plan there are no current active employees.
Prior to On or after Prior to On or after
January 1, 2013 January 1, 2013 January 1, 2013 January 1, 2013
Benefit formula
2% @ 55 2% @ 62 2% @ 55 2% @ 62
Benefit vesting schedule 5 years of service 5 years of service 5 years of service 5 years of service
Benefit payments Monthly for life Monthly for life Monthly for life Monthly for life
Required employee contribution rates 6.91% 6.75% 6.92% 7.25%
Required employer contribution rates 10.87% 7.47% 11.65% 7.65%
Hire date
Transportation Authority
Successor Agency
Miscellaneous Plan
Miscellaneous Plan

CITY AND COUNTY OF SAN FRANCISCO
Notes to Basic Financial Statements (Continued)
June 30, 2023
(Dollars in Thousands)
122
At June 30, 2023, the following current and former employees were covered by the benefit terms under
each pension plan:
Contributions
For the year ended June 30, 2023, the City’s actuarial determined contributions were as follows:
SFERS – Contributions are made to the basic SFERS Plan by both the City and the participating
employees. Employee contributions are mandatory as required by the Charter. Employee contribution
rates for fiscal year 2022-23 varied from 7.5% to 12.0% as a percentage of gross covered salary. For
the year ended June 30, 2023, most employee groups agreed through collective bargaining for
employees to contribute the full amount of the employee contributions on a pretax basis. The City is
required to contribute at an actuarially determined rate. Based on the July 1, 2021, actuarial report, the
required employer contribution rates for fiscal year 2022-23 were 17.85% to 21.35%.
CalPERS – Section 20814(c) of the California Public Employees’ Retirement Law requires that the
employer contribution rates for all public employers be determined on an annual basis by the actuary
and shall be effective on the July 1 following notice of a change in the rate. Funding contributions for
the PERF are determined annually on an actuarial basis as of June 30 by CalPERS. The actuarially
determined rate is the estimated amount necessary to finance the costs of benefits earned by public
employees during the year, with an additional amount to finance any unfunded accrued liability.
Replacement Benefits Plan – The RBP is and will remain unfunded and the rights of any participant
and beneficiary are limited to those specified in the RBP. The RBP constitutes an unsecured promise
by the City to make benefit payments in the future to the extent funded by the City. The City paid $4.5
million replacement benefits in the year ended June 30, 2023.
Pension liabilities are financed by governmental funds, enterprise funds, fiduciary funds and discrete
component unit that are responsible for the charges.
SFERS Plan
City CalPERS
Miscellaneous
Plan
City CalPERS
Safety Plan
Transportation
Authority CalPERS
Classic & PEPRA
Miscellaneous
Plans
Successor Agency
CalPERS Classic &
PEPRA
Miscellaneous
Plans
Treasure Island
Development
Authority CalPERS
Miscellaneous
Plan
Inactive employees or beneficiaries
currently receiving benefits.............. 32,104 62 1,270 16 189 1
Inactive employees entitled to but not
yet receiving benefits...................... 12,657 1 250 65 100 -
Active employees.............................. 34,017 - 660 39 43 -
Total............................................. 78,778 63 2,180 120 332 1
SFERS Plan.................................................................................................
$ 638,003
City CalPERS Miscellaneous Plan..................................................................
-
City CalPERS Safety Plan............................................................................. 50,754
Transportation Authority CalPERS Classic & PEPRA Miscellaneous Plans........ 689
Successor Agency CalPERS Classic & PEPRA Miscellaneous Plans............... 2,934
Treasure Island Development Authority CalPERS Miscellaneous Plan................ 2
Total....................................................................................................... 692,382$

CITY AND COUNTY OF SAN FRANCISCO
Notes to Basic Financial Statements (Continued)
June 30, 2023
(Dollars in Thousands)
123
Net Pension Liability (Asset)
The table below shows how the net pension liability (NPL) or (net pension asset) (NPA) as of June 30,
2023, is distributed.
As of June 30, 2023, the City’s NPL/(NPA) is comprised of the following:
The City’s NPL/(NPA) for each of its cost-sharing plans is measured as a proportionate share of the
plans’ NPL/(NPA). The City’s NPL/(NPA) for each of its cost-sharing plans is measured as of June 30,
2022, and the total pension liability for each cost-sharing plan used to calculate the NPL/(NPA) was
determined by an actuarial valuation as of June 30, 2021, rolled forward to June 30, 2022, using
standard update procedures. The City’s proportion of the NPL/(NPA) for the SFERS Plan was based
on the City’s long-term share of contributions to SFERS relative to the projected contributions of all
participating employers, actuarially determined. The City’s proportions of the NPL/(NPA) for the
CalPERS plans were actuarially determined as of the valuation date.
Net Pension Asset Net Pension Liability Total
Governmental activities................................................... (17,362)$ 1,954,150$ 1,936,788$
Business-type activities.................................................. - 1,113,763 1,113,763
Fiduciary funds.............................................................. - 37,328 37,328
Component Unit - Treasure Island Development Authority.. - 11 11
Total....................................................................... (17,362)$ 3,105,252$ 3,087,890$
Proportionate
Share
Share of Net
Pension
Liability
(Asset)
SFERS Plan................................................................................................................ 94.8676% 2,552,996$
City CalPERS Miscellaneous Plan......................................................................... -0.1503% (17,362)
City CalPERS Safety Plan........................................................................................ N/A 355,592
Transportation Authority CalPERS Classic & PEPRA Miscellaneous Plans. 0.0294% 3,394
Successor Agency CalPERS Classic & PEPRA Miscellaneous Plans.......... 0.3232% 37,328
Treasure Island Development Authority CalPERS Miscellaneous Plan......... 0.0001% 11
Replacement Benefits Plan..................................................................................... N/A 155,931
Total.............................................................................................................. 3,087,890$

CITY AND COUNTY OF SAN FRANCISCO
Notes to Basic Financial Statements (Continued)
June 30, 2023
(Dollars in Thousands)
124
The City’s proportionate share and NPL/(NPA) of each of its cost-sharing plans as of June 30, 2022
and 2021 were as follows:
The City’s NPL for the CalPERS City Safety Plan (agent plan) is measured as the total pension liability,
less the CalPERS Safety Plan’s fiduciary net position. The change in the NPL for the City CalPERS
Safety Plan is as follows:
Proportionate
Share
Share of Net
Pension
Liability
(Asset)
Proportionate
Share
Share of Net
Pension
Liability
(Asset)
SFERS Plan................................................................................................................ 94.8676% 2,552,996$ 94.6421% (2,446,565)$
City CalPERS Miscellaneous Plan......................................................................... -0.1503% (17,362) -0.4126% (22,316)
Transportation Authority CalPERS Classic & PEPRA Miscellaneous Plans. 0.0294% 3,394 0.0160% 868
Successor Agency CalPERS Classic & PEPRA Miscellaneous Plans.......... 0.3232% 37,328 0.4073% 22,028
Treasure Island Development Authority CalPERS Miscellaneous Plan......... 0.0001% 11 0.0001% 6
Total.............................................................................................................. 2,576,367$ (2,445,979)$
June 30, 2021
(Measurement Date)
June 30, 2022
(Measurement Date)
Total
Pension
Liability
Plan
Fiduciary
Net Position
Net Pension
Liability
Balance at June 30, 2021 (MD)............................ 1,590,799$ 1,446,527$ 144,272$
Change in year:
Service cost.......................................................... 27,820 - 27,820
Interest on the total pension liability................ 109,898 - 109,898
Changes of assumptions................................. 45,696 - 45,696
Differences between expected and actual
experience........................................................ (19,162) - (19,162)
Contributions from the employer..................... - 55,172 (55,172)
Contributions from employees........................ - 7,885 (7,885)
Net investment loss........................................... - (109,224) 109,224
Benefit payments, including refunds of
employee contributions................................. (77,028) (77,028) -
Administrative expense..................................... - (901) 901
Net changes during measurement period........ 87,224 (124,096) 211,320
Balance at June 30, 2022 (MD) ........................... 1,678,023$ 1,322,431$ 355,592$
Increase (Decrease)

CITY AND COUNTY OF SAN FRANCISCO
Notes to Basic Financial Statements (Continued)
June 30, 2023
(Dollars in Thousands)
125
The City’s pension liability for the Replacement Benefits Plan is measured as the total pension liability
as there are no assets in the plan. The change in the total pension liability for the City Replacement
Benefits Plan is as follows:
Pension Expenses/(Benefits) and Deferred Outflows/Inflows of Resources Related to Pensions
For the year ended June 30, 2023, the City recognized pension expense/(benefit) including
amortization of deferred outflows/inflows related to pension items as follows:
Balance at June 30, 2021 (MD)............................
Change in year:
Service cost..........................................................
Interest..................................................................
Differences between expected and actual
experience........................................................
Assumption changes.........................................
Benefit payments................................................
Net changes during measurement period........
Balance at June 30, 2022(MD).............................
(42,151)
(4,473)
(63,643)
155,931$
Increase (Decrease)
Total Pension Liability
$ 219,574
2,894
4,726
(24,639)
Component Unit
Governmental
Activities
Business-type
Activities
Fiduciary
Funds
Treasure
Island
Development
Authority
Total
SFERS Plan.................................................................................................................. (5,916)$ (7,280)$ -$ -$ (13,196)$
City CalPERS Miscellaneous Plan........................................................................... 18,937 - - - 18,937
City CalPERS Safety Plan........................................................................................... 47,305 - - - 47,305
Transportation Authority CalPERS Classic & PEPRA Miscellaneous Plans... 1,415 - - - 1,415
Successor Agency CalPERS Classic & PEPRA Miscellaneous Plans............. - - (7,327) - (7,327)
Treasure Island Development Authority CalPERS Miscellaneous Plan........... - - - (1) (1)
Replacement Benefits Plan....................................................................................... 8,101 6,866 - - 14,967
Total pension expense/(benefit)....................................................................... 69,842$ (414)$ (7,327)$ (1)$ 62,100$
Primary Government

CITY AND COUNTY OF SAN FRANCISCO
Notes to Basic Financial Statements (Continued)
June 30, 2023
(Dollars in Thousands)
126
At June 30, 2023, the City’s reported deferred outflows of resources and deferred inflows of resources
related to pensions from the following sources.
Deferred
Outflows of
Resources
Deferred
Inflows of
Resources
Deferred
Outflows of
Resources
Deferred
Inflows of
Resources
Deferred
Outflows of
Resources
Deferred
Inflows of
Resources
Deferred
Outflows of
Resources
Deferred
Inflows of
Resources
Pension contributions subsequent
to measurement date......................
638,003$ -$ -$ -$ 689$ -$ 2,934$ -$
Change in assumptions.....................
663,373 317,349 - 1,779 348 - 3,825 502
Difference between expected and
actual experience............................. 233,032 - - 115 68 46 750 -
Change in employer's proportion
and differences between the
employer's contributions and the
employer's proportionate share
of contributions................................. 73,364 55,246 10,641 2,401 492 111 166 4,593
Net difference between projected
and actual earnings on plan
investments....................................... - 199,056 - 3,180 622 - 6,838 -
Total........................................................ 1,607,772$ 571,651$ 10,641$ 7,475$ 2,219$ 157$ 14,513$ 5,095$
Deferred
Outflows of
Resources
Deferred
Inflows of
Resources
Deferred
Outflows of
Resources
Deferred
Inflows of
Resources
Deferred
Outflows of
Resources
Deferred
Inflows of
Resources
Deferred
Outflows of
Resources
Deferred
Inflows of
Resources
Pension contributions subsequent
to measurement date......................
2$ -$ 50,754$ -$ -$ -$ 692,382$ -$
Change in assumptions.....................
1 - 23,936 - 25,082 33,721 716,565 353,351
Difference between expected and
actual experience............................. 8 - 264 10,039 20,567 19,711 254,689 29,911
Change in employer's proportion
and differences between the
employer's contributions and the
employer's proportionate share
of contributions................................. 3 3 - - 10,593 10,593 95,259 72,947
Net difference between projected
and actual earnings on plan
investments....................................... 2 - 66,439 - - - 73,901 202,236
Total........................................................ 16$ 3$ 141,393$ 10,039$ 56,242$ 64,025$ 1,832,796$ 658,445$
CalPERS
Transportation Authority
Miscellaneous Plan
CalPERS
Successor Agency
Miscellaneous Plan
Replacement Benefits Plan
Total
CalPERS
Treasure Island Development
Authority
Miscellaneous Plan
City CalPERS Safety Plan
SFERS Plan
CalPERS
City Miscellaneous Plan

CITY AND COUNTY OF SAN FRANCISCO
Notes to Basic Financial Statements (Continued)
June 30, 2023
(Dollars in Thousands)
127
At June 30, 2023, the City reported $692.4 million as deferred outflows of resources related to
contributions subsequent to the measurement date, which will be recognized as an adjustment to net
pension liability/(asset) in the reporting year ended June 30, 2024. Other amounts reported as deferred
outflows of resources and deferred inflows of resources related to pensions will be recognized as
pension expense in the reporting year as follows:
Actuarial Assumptions
A summary of the actuarial assumptions and methods used to calculate the total pension liability as of
June 30, 2022 is provided below, assumptions were consistent with the July 1, 2021 actuarial valuation.
For SFERS, mortality rates for healthy Miscellaneous members were based upon adjusted PubG-2010
Employee and Retiree tables for non-annuitants and retirees, respectively. Mortality rates were then
projected generationally from the base year using the MP-2019 projection scale.
The actuarial assumptions used in the SFERS valuation at the June 30, 2022, measurement date were
based upon the results of an experience study for the period July 1, 2014, through June 30, 2019, and
an economic experience study as of July 1, 2021.
For CalPERS, the mortality table used was developed based on CalPERS’ specific data. The rates
incorporate generational mortality to capture ongoing mortality improvements using 80% of Scale MP
2020 published by the Society of Actuaries. All other actuarial assumptions were based on the results
of the 2021 actuarial experience study. The Experience Study report can be obtained at CalPERS’
website.
Year
Ending
June 30
SFERS Plan
CalPERS
City Miscellaneous
Plan
CalPERS
Transportation
Authority
Miscellaneous
Plan
CalPERS
Successor Agency
Miscellaneous
Plan
CalPERS
Treasure Island
Development
Authority
Miscellaneous Plan
CalPERS
Safety Plan
Replacement
Benefits Plan
Total
2024.......
(136,819)$ 1,703$ 447$ 913$ 4$ 23,510$ 10,599$ (99,643)$
2025.......
(178,373) 2,014 359 869 3 10,750 1,969 (162,409)
2026....... (382,574) 1,394 187 520 2 4,657 (6,994) (382,808)
2027....... 1,095,884 (1,945) 380 4,182 2 41,683 (13,357) 1,126,829
Total 398,118$ 3,166$ 1,373$ 6,484$ 11$ 80,600$ (7,783)$ 481,969$
CalPERS Miscellaneous and Safety Plans
Valuation date............................................. June 30, 2021 updated to June 30, 2022 June 30, 2021
Measurement date..................................... June 30, 2022 June 30, 2022
Actuarial cost method................................ Entry-age normal cost method Entry-age normal cost method
Investment rate of return...........................
7.20%, net of pension plan investment
expenses
6.90%, net of pension plan investment expenses, includes
inflation
Municipal bond yield.................................. 3.54% as of June 30, 2022
Bond Buyer 20-Bond GO Index, June 30,
2022
Inflation......................................................... 2.50% 2.30%
Projected salary increases.......................
3.25% plus merit component based
employee classification and years of service
Varies by Entry Age and Service
Discount rate............................................... 7.20% as of June 30, 2022 6.90% as of June 30, 2022
Basic COLA................................................. Old Miscellaneous and
All New Plans..................................................... 2.00%
Old Police and Fire:
Pre 7/1/75 Retirements.................................... 1.90%
Chapters A8.595 and A8.596.......................... 2.50%
Chapters A8.559 and A8.585.......................... 3.60%
Miscellaneous Contract COLA up to 2.30% until Purchasing
Protection Allowance Floor on Purchasing Power applies.
Safety standard COLA 2.0%
SFERS Plan

CITY AND COUNTY OF SAN FRANCISCO
Notes to Basic Financial Statements (Continued)
June 30, 2023
(Dollars in Thousands)
128
GASB Statement No. 68 states that the long-term expected rate of return should be determined net of
pension plan investment expense but without reduction for pension plan administrative expense. The
CalPERS discount was 6.90% as of the June 30, 2022, measurement date.
For the Replacement Benefits Plan beginning of the year measurement is also based on the census
data used in the actuarial valuation as of July 1, 2021.
Discount Rates
SFERS – The discount rate used to measure SFERS’s total pension liability as of June 30, 2022, was
7.20%. The projection of cash flows used to determine the discount rate assumed that plan members
and employers contributions will continue to be made at the rates specified in the Charter. Employer
contributions were assumed to be made in accordance with the contribution policy in effect for July 1,
2021, actuarial valuation.
While the contributions and measure of the Actuarial Liability in the valuation do not anticipate any
future Supplemental COLAs, the projected contributions for the determination of the discount rate
include the anticipated future amortization payments on future Supplemental COLAs for current
members when they are expected to be granted. For members who worked after November 6, 1996,
and before Proposition C passed (Post 97 Retirees), a Supplemental COLA is granted if the actual
investment earnings during the year exceed the expected investment earnings on the Actuarial Value
of Assets. For members who did not work after November 6, 1996, and before Proposition C passed,
the Market Value of Assets must also exceed the Actuarial Liability at the beginning of the year for a
Supplemental COLA to be granted. When a Supplemental COLA is granted, the amount depends on
the amount of excess earnings and the basic COLA amount for each membership group. The large
majority of members receive a 1.50% Supplemental COLA when granted.
Because the probability of a Supplemental COLA depends on the current funded level of the Retirement
System, the Retirement System developed an assumption as of June 30, 2022, of the probability and
amount of Supplemental COLA for each future year. No Supplemental COLA was payable as of July
1, 2022 due to the unfavorable investment returns for fiscal year 2021-22.
The table below shows the net assumed Supplemental COLAs for members with a 2.00% basic COLA
for sample years.
The projection of benefit payments to current members for determining the discount rate includes the
payment of anticipated future Supplemental COLAs.
Year Ending
June 30
96 - Prop C
2024 0.75%
2025 0.75%
2026 0.75%
2027+ 0.75%
Before 11/6/96 or
After Prop C
Assumed Supplemental COLA
for Members with a 2.00% Basic COLA
0.50%
0.70%
0.60%
0.60%

CITY AND COUNTY OF SAN FRANCISCO
Notes to Basic Financial Statements (Continued)
June 30, 2023
(Dollars in Thousands)
129
Based on these assumptions, the Retirement System’s fiduciary net position was projected to be
available to make projected future benefit payments for current members. Projected benefit payments
are discounted at the long-term expected return on assets of 7.20% to the extent the fiduciary net
position is available to make the payments and at the municipal bond rate of 3.54% to the extent they
are not available. The single equivalent rate used to determine the total pension liability as of June 30,
2022, is 7.20%.
The long-term expected rate of return on pension plan investments was 7.20%. It was set by the
Retirement Board after consideration of both expected future returns and historical returns experienced
by the Retirement System. Expected future returns were determined by using a building-block method
in which best-estimate ranges of expected future real rates of return were developed for each major
asset class. These ranges were combined to produce the long-term expected rate of return by weighting
the expected future real rates of return by the target asset allocation percentage and by adding
expected inflation.
Target allocation and best estimates of geometric long-term expected real rates of return (net of pension
plan investment expense and inflation) for each major asset class are summarized in the following
table.
CalPERS - The discount rate used to measure each of the CalPERS Miscellaneous Rate Plans and
the Safety Plan total pension liability was 6.90%. The projection of cash flows used to determine the
discount rate assumed that contributions from plan members will be made at the current member
contribution rates and that contributions from employers will be made at statutorily required rates,
actuarially determined. Based on those assumptions, the Plan’s fiduciary net position was projected to
be available to make all projected future benefit payments of current plan members. Therefore, the
long-term expected rate of return on plan investments was applied to all periods of projected benefit
payments to determine the total pension liability.
The long-term expected rate of return on pension plan investments was determined using a building-
block method in which best-estimate ranges of expected future real rates of return (expected returns,
net of pension plan investment expense and inflation) are developed for each major asset class.
In determining the long-term expected rate of return, CalPERS took into account long-term market
return expectations as well as the expected pension fund cash flows. Projected returns for all asset
classes are estimated and combined with risk estimates, are used to project compound (geometric)
returns over the long term. The discount rate used to discount liabilities was informed by the long-term
projected portfolio return.
Long-Term Expected
Asset Class Target Allocation Real Rate of Return
Global Equity 37.0% 4.8%
Treasuries 8.0% 0.6%
Liquid Credit 5.0% 3.5%
Private Credit 10.0% 5.8%
Private Equity 23.0% 7.9%
Real Assets 10.0% 4.7%
Hedge Funds/Absolute Return 10.0% 3.4%
Leverage -3.0% 0.6%

CITY AND COUNTY OF SAN FRANCISCO
Notes to Basic Financial Statements (Continued)
June 30, 2023
(Dollars in Thousands)
130
The table below reflects long-term expected real rates of return by asset class.
________
(1)
An expected price inflation of 2.30% used for this period.
(2)
Figures are based on the 2021-22 Asset Liability Management study.
Replacement Benefits Plan – The discount rate was 3.54% as of June 30, 2022. This reflects the yield
for a 20-year, tax-exempt general obligation municipal bond with an average rating of AA/Aa or higher.
The Municipal Bond Yield is the Bond Buyer 20-Year GO Index as of June 30, 2022. This is the rate
used to determine the total pension liability as of June 30, 2022.
The inflation assumption of 2.50% compounded annually was used for projecting the annual IRC
Section 415(b) limitations. However, the actual IRC Section 415(b) limitations published by the IRS of
$245 thousand was used for the 2022 measurement date.
The SFERS assumptions about Basic and Supplemental COLA previously discussed also apply to the
Replacement Benefits Plan, including the impact of the State Appeals Court determination that the full
funding requirement for payment of Supplemental COLA included in Proposition C was unconstitutional
and the impact is accounted for as a change in benefits.
At June 30, 2023, the membership in the RBP had a total of 327 active members and 160 retirees and
beneficiaries currently receiving benefits.
Asset Class
Target
Allocation
Real
Return
(1),(2)
Global equity - cap-weighted 30.00% 4.54%
Global equity - non-cap-weighted 12.00% 3.84%
Private equity 13.00% 7.28%
Treasury 5.00% 0.27%
Mortgage-backed securities 5.00% 0.50%
Investment grade corporates 10.00% 1.56%
High yield 5.00% 2.27%
Emerging market debt 5.00% 2.48%
Private debt 5.00% 3.57%
Real estate 15.00% 3.21%
Leverage -5.00% -0.59%

CITY AND COUNTY OF SAN FRANCISCO
Notes to Basic Financial Statements (Continued)
June 30, 2023
(Dollars in Thousands)
131
Sensitivity of Proportionate Share of the Net Pension Liability/(Asset) to Changes in the
Discount Rate
The following presents the City’s proportionate share of the NPL/(NPA) for each of the City’s cost-
sharing retirement plans, calculated using the discount rate, as well as what the City’s proportionate
share of the net pension liability (asset) would be if it were calculated using a discount rate that is 1%
lower or 1% higher than the current rate.
The following presents the NPL/(NPA) for the City’s CalPERS Safety Plan (agent multiple-employer
plan) and the total pension liability for the City’s Replacement Benefits Plan, calculated using the
discount rate, in effect as of the measurement date, as well as what the net/total pension liability would
be if it were calculated using a discount rate that is 1% lower or 1% higher than the current rate.
Detailed information about the CalPERS Safety Plan’s fiduciary net position is available in a separately
issued CalPERS financial report, copies may be obtained from the CalPERS website at
www.calpers.ca.gov.
Deferred Compensation Plan
The City offers its employees a deferred compensation plan in accordance with Internal Revenue Code
(IRC) Section 457. The plan, available to all employees, permits them to defer a portion of their salary
until future years. The deferred compensation is not available to employees or other beneficiaries until
termination, retirement, death, or unforeseeable emergency.
The City has no administrative involvement and does not perform the investing function. The City has
no fiduciary accountability for the plan and, accordingly, the plan assets and related liabilities to plan
participants are not included in the basic financial statements.
Cost-Sharing Pension Plans
Proportionate Share of Net Pension Liability
1% Decrease
Share of
NPL/(NPA)
@ 6.20%
Current Share
of NPL/(NPA)
@ 7.20%
1% Increase
Share of
NPL/(NPA)
@ 8.20%
SFERS.................................................................................................... 6,991,061$ 2,552,996$ (1,105,652)$
1% Decrease
Share of
NPL/(NPA)
@ 5.90%
Current Share
of NPL/(NPA)
@ 6.90%
1% Increase
Share of
NPL/(NPA)
@ 7.90%
City CalPERS Miscellaneous Plan............................................................. (14,925)$ (17,362)$ (19,367)$
Transportation Authority CalPERS Classic & PEPRA Miscellaneous Plans... 5,908 3,394 1,324
Successor Agency CalPERS Classic & PEPRA Miscellaneous Plans.......... 52,513 37,328 24,834
Treasure Island Development Authority CalPERS Miscellaneous Plan........... 22 11 2
Agent Pension Plan
1% Decrease @
5.90%
Measurement
Date @ 6.90%
1% Increase @
7.90%
City CalPERS Safety Plan......................................................................... 575,864$ 355,592$ 173,450$
Single Employer Plan
1% Decrease @
2.54%
Measurement
Date @ 3.54%
1% Increase @
4.54%
Replacement Benefits Plan........................................................................ 184,981$ 155,931$ 133,074$

CITY AND COUNTY OF SAN FRANCISCO
Notes to Basic Financial Statements (Continued)
June 30, 2023
(Dollars in Thousands)
132
Health Service System
The Health Service System was established in 1937. Health care benefits of employees, retired
employees and surviving spouses are financed by beneficiaries and by the City through the Health
Service System. The employers’ contribution, which includes the San Francisco Community College
District, San Francisco Unified School District and the San Francisco Superior Court, amounted to
approximately $873.6 million in fiscal year 2022-23. The employers’ contribution is mandated and
determined by Charter provision based on similar contributions made by the ten most populous counties
in California and the contribution models negotiated with the unions. Included in this amount is $257.2
million to provide postemployment health care benefits for 30,788 retired participants, of which $215.5
million related to City employees. The City’s liability for postemployment health care benefits is
enumerated below. The City’s contribution is paid out of current available resources and funded on a
pay-as-you-go basis. The Health Service System issues a publicly available financial report that
includes financial statements. That report may be obtained by writing to the San Francisco Health
Service System, 1145 Market Street, Suite 300, San Francisco, CA 94103 or from the City’s website.
(b) Postemployment Health Care Benefits
City (excluding the Transportation Authority and the Successor Agency)
The City maintains a defined benefit other postemployment benefits plan (the OPEB Plan). The OPEB
Plan provides postemployment medical, dental and vision insurance benefits to eligible employees,
retired employees, surviving spouses, and domestic partners. Health benefit provisions are established
and may be amended through negotiations between the City and the respective bargaining units.
GASB Statement No. 75 requires that reported results must pertain to liability and asset information
within certain defined timeframes. For this report, the following timeframes are used.
San Francisco Health Service System OPEB Plan
Valuation Date (VD)
June 30, 2022
Measurement Date (MD)
June 30, 2022
Measurement Period (MP)
July 1, 2021 to June 30, 2022
The City prefunds its OPEB obligations through the Retiree Health Care Trust Fund (RHCTF) that
allows participating employers to prefund certain postemployment benefits other than pensions for their
covered employees. The RHCTF is an agent multiple-employer trust fund and has two participating
employers: (i) the City and County of San Francisco and (ii) the San Francisco Community College
District. The RHCTF is administered by the City and is presented as an other postemployment benefit
trust fund herein. The RHCTF’s administrator, the City and County of San Francisco’s Retirement
System (SFERS), issues a publicly available financial report consisting of financial statements and
required supplementary information for the RHCTF in aggregate. The report may be obtained by writing
to SFERS, 1145 Market Street, 5th Floor, San Francisco, CA 94103.

CITY AND COUNTY OF SAN FRANCISCO
Notes to Basic Financial Statements (Continued)
June 30, 2023
(Dollars in Thousands)
133
Former employees of the City and County of San Francisco who were members of the Health Service
System and who retire under SFERS or CalPERS are eligible for postretirement health benefits from
the City and County of San Francisco. Effective with Proposition B, passed June 3, 2008, employees
hired on or after January 10, 2009, must retire within 180 days of separation in order to be eligible for
retiree healthcare benefits from the City. The eligibility requirements are as follows:
City and County of San Francisco’s Retirement System (SFERS)
Normal Retirement Miscellaneous Age 50 with 20 years of credited service
1
Age 60 with 10 years of credited service
Safety Age 50 with 5 years of credited service
Disabled Retirement
2
Any age with 10 years of credited service
Terminated Vested 5 years of credited service at separation
California Public Employees’ Retirement System (CalPERS)
Normal Retirement Age 50 with 5 years of credited service
Disabled Retirement
2
Any age with 5 years of credited service
Terminated Vested 5 years of credited service at separation
1
Age 53 with 20 years of credited service, age 60 with 10 years of credited service, or age 65 for Miscellaneous members
hired on or after January 7, 2012 under Charter Section 8.603.
2
No service requirement for Safety members retiring under the industrial disability benefit or for surviving spouses / domestic
partners of those killed in the line of duty.
Retiree healthcare benefits are administered by the San Francisco Health Service System and include
the following:
Medical: PPO – Blue Shield (self-insured) and UHC Medicare Advantage (fully-insured)
HMO – Kaiser (fully-insured) and Blue Shield (flex-funded), and Health Net (flex-funded)
Dental: Delta Dental, DeltaCare USA and UnitedHealthcare Dental
Vision: Vision benefits are provided under the medical insurance plans and are
administered by Vision Service Plan.
Projections of the sharing of benefit related costs are based on an established pattern of practice.
As of the June 30, 2022, valuation date, the following current and former employees were covered by
the benefit terms under the healthcare plan:
City Plan
31,621
2,211
23,624
Total............................................................................................. 57,456
Active plan members............................................................................
Inactive employees entitled to but not yet receiving benefit payments........
Inactive employees or beneficiaries currently receiving benefit payments...

CITY AND COUNTY OF SAN FRANCISCO
Notes to Basic Financial Statements (Continued)
June 30, 2023
(Dollars in Thousands)
134
San Francisco County Transportation Authority and Successor Agency
The Transportation Authority’s defined benefit postemployment healthcare plan provides healthcare
benefits to eligible employees and their surviving spouses. Employees become eligible to retire and
receive healthcare benefits upon reaching the age of 50 and meeting program vesting requirements or
being converted to disability status and retiring directly from the Transportation Authority. Dental and
vision benefits are not available to retirees. The Transportation Authority is a contracting agency under
the Public Employees’ Medical and Hospital Care Act (PEMHCA), which is administered by CalPERS
for the provision of healthcare insurance programs for both active and retired employees.
Effective February 1, 2012, upon the operation of law to dissolve the former Agency, the Successor
Agency assumed the former Agency’s other postemployment benefits plan. The Successor Agency
sponsors a defined benefit plan providing OPEB to employees who retire directly from the former
Agency and/or the Successor Agency. The Successor Agency pays 100% of the premiums of CalPERS
medical plan to eligible employees that satisfied the required services years and minimum age.
The Transportation Authority and the Successor Agency participate in the California Employers’ Retiree
Benefit Trust Fund Program (CERBT), an agent multiple-employer postemployment health plan, to
prefund other postemployment benefits through CalPERS. CalPERS issues publicly available financial
reports for all plans it administers and a separate GASB Statement No. 75 report for CERBT that can
be found on CalPERS website.
Projections of the sharing of benefit related costs are based on an established pattern of practice.
As of the June 30, 2022, actuarial valuation, the following current and former employees were covered
by the benefit terms under the healthcare plan:
Contributions
The City’s benefits provided under the OPEB Plan are currently paid through “pay-as-you-go” funding.
Additionally, under the City Charter, active officers and employees of the City who commenced
employment on or after January 10, 2009, shall contribute to the RHCTF a percentage of compensation
not to exceed 2% of pre-tax compensation. The City shall contribute 1% of compensation for officers
and employees who commenced employment on or after January 10, 2009, until the City’s actuary has
determined that the City’s portion of the RHCTF is fully funded. At that time, the City’s 1% contribution
shall cease, and officers and employees will each contribute 50% of the maximum 2% of pre-tax
compensation.
Starting July 1, 2016, active officers and employees of the City who commenced employment on or
before January 9, 2009, shall contribute 0.25% of pre-tax compensation into the RHCTF. Beginning on
July 1
st
of each subsequent year, the active officers and employees of the City who commenced
employment on or before January 9, 2009, shall contribute an additional 0.25% of pre-tax compensation
up to a maximum of 1%. Starting July 1, 2016, the City contributes 0.25% of compensation into the
RHCTF for each officer and employee who commenced employment on or before January 9, 2009.
Beginning on July 1
st
of each subsequent year, the City contributes an additional 0.25% of
compensation, up to a maximum of 1% for each officer and employee who commenced employment
on or before January 9, 2009. When the City’s actuary has determined that the City’s portion of the
Transportation
Authority
Successor
Agency
39 36
- -
9 103
Total............................................................................................ 48 139
Active plan members..........................................................................
Inactive employees or beneficiaries currently receiving benefit payments..
Inactive employees entitled to but not yet receiving benefit payments......

CITY AND COUNTY OF SAN FRANCISCO
Notes to Basic Financial Statements (Continued)
June 30, 2023
(Dollars in Thousands)
135
RHCTF is fully funded, the City’s 1% contribution shall cease, and officers and employees will each
contribute 50% of the maximum 1% of pre-tax compensation. Additional or existing contribution
requirements may be established or modified by amendment to the City’s Charter.
For the year ended June 30, 2023, the City’s funding was based on “pay-as-you-go” plus a contribution
of $45.2 million to the RHCTF. The “pay-as-you-go” portion paid by the City was $215.4 million for a
total contribution subsequent to the measurement date of $260.6 million for the year ended June 30,
2023.
The Transportation Authority’s contribution requirements are established and may be amended by the
Board. The Transportation Authority makes contributions on an actuarial basis, funding the full
actuarially determined contributions (ADC). The Transportation Authority’s employees are not required
to contribute to the OPEB plan. For the year ended June 30, 2023, the Transportation Authority
contributed $105 thousand to the CERBT plan. The Successor Agency’s OPEB funding policy is to
contribute 100% or more of the ADC annually by contributing to the CERBT. For the year ended
June 30, 2023, the Successor Agency contributed $2.4 million to the plan. There are no employee
contributions to the Successor Agency’s plan. The ADC represents a level of funding that, if paid on an
ongoing basis, is projected to cover normal cost each year and amortize any unfunded actuarial
liabilities (or funding excess) over a period not to exceed thirty years.
OPEB liabilities are financed by governmental funds, enterprise funds and fiduciary funds that are
responsible for the charges.
Net OPEB Liability/(Asset)
The table below shows how the net OPEB liability/(asset) as of June 30, 2023, is distributed.
As of June 30, 2023, the City’s net OPEB liability (asset) is comprised of the following:
Net OPEB Asset Net OPEB Liability Total
Governmental activities................ (101)$
*
2,057,177$ 2,057,076$
Business-type activities............... - 1,677,814 1,677,814
Fiduciary funds........................... (2,118) 11,279 9,161
Total..................................... (2,219)$ 3,746,270$ 3,744,051$
* Amount is reported in other assets on the statement of net position.
Share of Net
OPEB Liability
(Asset)
City defined benefit healthcare plan................................................ 3,746,270$
Transportation Authority defined benefit healthcare plan................... (101)
Successor Agency defined benefit healthcare plan.......................... (2,118)
Total.................................................................................. 3,744,051$

CITY AND COUNTY OF SAN FRANCISCO
Notes to Basic Financial Statements (Continued)
June 30, 2023
(Dollars in Thousands)
136
The changes in the City OPEB Plan’s net OPEB liability are as follows:
The changes in net OPEB liability (asset) for the plans of the Transportation Authority and Successor
Agency are as follows:
Total OPEB
Liability
Plan
Fidicuary Net
Position
Net OPEB
Liability
Balance at June 30, 2021 (MD).......................................
$ 4,409,899 $ 718,778 $ 3,691,121
Changes during the measurement period.........................
Service cost..............................................................
154,800 - 154,800
Interest.....................................................................
306,758 - 306,758
Differences between expected and actual experience...
(224,065) - (224,065)
Changes of assumptions............................................ 49,784 - 49,784
Contributions - employer............................................
- 252,866 (252,866)
Contributions - member..............................................
- 66,455 (66,455)
Net investment loss...................................................
- (87,003) 87,003
Benefit payments, including refunds of
member contributions..............................................
(211,025) (211,025) -
Administrative expense..............................................
- (190) 190
Net changes during the measurement period....................
76,252 21,103 55,149
Balance at June 30, 2022 (MD)...................................
$ 4,486,151 $ 739,881 $ 3,746,270
Increase (Decrease)
Total OPEB
Liability
Plan
Fidicuary Net
Position
Net OPEB
Liability
(Asset)
Total OPEB
Liability
Plan Fidicuary
Net Position
Net OPEB
Liability
(Asset)
Balance at June 30, 2021 (MD).......................................
$ 1,956 $ 2,493 $ (537) $ 11,217 $ 14,740 $ (3,523)
Changes during the measurement period.........................
Service cost..............................................................
123 - 123 314 - 314
Interest.....................................................................
150 - 150 694 - 694
Differences between expected and actual experience...
(3) - (3) - - -
Changes of assumptions............................................ (99) - (99) - - -
Contributions from the employer.................................
- 70 (70) - 1,689 (1,689)
Benefit payments......................................................
(70) (70) - (854) (854) -
Administrative expense..............................................
- (1) 1 - (6) 6
Net investment loss...................................................
- (334) 334 - (2,080) 2,080
Net changes during the measurement period....................
101 (335) 436 154 (1,251) 1,405
Balance at June 30, 2022 (MD)...................................
$ 2,057 $ 2,158 $ (101) $ 11,371 $ 13,489 $ (2,118)
Transportation Authority
Successor Agency

CITY AND COUNTY OF SAN FRANCISCO
Notes to Basic Financial Statements (Continued)
June 30, 2023
(Dollars in Thousands)
137
OPEB Expenses/(Benefits) and Deferred Outflows/Inflows of Resources Related to OPEB
For the year ended June 30, 2023, the City recognized OPEB expense/(benefit) including amortization
of deferred outflows/inflows related to OPEB items as follows:
As of June 30, 2023, the City reported deferred outflows/inflows of resources related to OPEB from the
following sources:
Governmental
Activities
Business-type
Activities
Fiduciary
Funds
Total
City defined benefit healthcare plan....................................... 147,653$ 109,259$ 62$ 256,974$
Transportation Authority defined benefit healthcare plan... 86 - - 86
Successor Agency defined benefit healthcare plan............ - - (291) (291)
Total OPEB expense/ (benefit).......................................... 147,739$ 109,259$ (229)$ 256,769$
Primary Government
Deferred
Outflows of
Resources
Deferred
Inflows of
Resources
Deferred
Outflows of
Resources
Deferred
Inflows of
Resources
Contributions subsequent to measurement date………………
260,649$ -$ 105$ -$
83,173 623,707 160 451
Changes in assumptions……………………………………......
159,935 - - 139
Changes in proportion…....................................................
123,282 123,282 - -
earnings on plan investments……………………………….
60,306 - 220 -
Total…………………………………………………………………………………………………………
687,345$ 746,989$ 485$ 590$
Deferred
Outflows of
Resources
Deferred
Inflows of
Resources
Deferred
Outflows of
Resources
Deferred
Inflows of
Resources
Contributions subsequent to measurement date…… 2,429$ -$ 263,183$ -$
- 501 83,333 624,659
Changes in assumptions…………………………………
- 79 159,935 218
Changes in proportion…………………………………
- - 123,282 123,282
earnings on plan investments……………………………….
1,190 - 61,716 -
Total…………………………………………………………………………………………………………
3,619$ 580$ 691,449$ 748,159$
Net difference between projected and actual
Successor Agency
Total
Net difference between projected and actual
City Plan
Transportation Authority
Differences between expected and actual experience……….
Differences between expected and actual experience……….

CITY AND COUNTY OF SAN FRANCISCO
Notes to Basic Financial Statements (Continued)
June 30, 2023
(Dollars in Thousands)
138
At June 30, 2023, the City reported $260.6 million as deferred outflows of resources related to
contributions subsequent to the measurement date, which will be recognized as an adjustment to net
OPEB liability/(asset) in the reporting year ending June 30, 2024.
Amounts reported as deferred outflows/inflows will be amortized annually and recognized in OPEB
expense as follows:
Year ending
June 30:
City
Transportation
Authority
Successor
Agency
Total
2024................ (84,576)$ 8$ (272)$ (84,840)$
2025................ (83,580) 4 122 (83,454)
2026................ (45,951) (11) 150 (45,812)
2027................ (55,431) 67 610 (54,754)
2028................ (50,755) (38) - (50,793)
Thereafter........ - (240) - (240)
Total (320,293)$ (210)$ 610$ (319,893)$
CITY AND COUNTY OF SAN FRANCISCO
Notes to Basic Financial Statements (Continued)
June 30, 2023
(Dollars in Thousands)
139
Actuarial Assumptions
A summary of the actuarial assumptions and methods used to calculate the City Plan’s total OPEB
liability as of June 30, 2022 (measurement date) is provided below:
The mortality rates in the base tables are projected generationally from the base year using the modified
version of the MP-2019 projection scale.
Key Actuarial Assumptions
Valuation Date June 30, 2022
Measurement Date June 30, 2022
Actuarial Cost Method The Entry Age Actuarial Cost Method is used to measure the Plan's Total OPEB Liability
Healthcare Cost Trend Rates Pre-Medicare trend starts at 7.74% trending down to ultimate rate of 3.93% in 2076
Medicare trend starts at 7.74% trending down to ultimate rate of 3.94% in 2076
10-County average trend starts at 5.00% trending down to ultimate rate of 3.94% in 2076
Vision and dental expenses trend remains a flat 3.0% for all years
Expected Rate of Return on Plan Assets 7.00%
Discount Rate 7.00%
Salary Increase Rate Wage Inflation Component: 3.25%
Additional Merit Component (dependent on years of service):
Police: 0.50% - 7.50%
Fire: 0.50% - 14.00%
Muni Drivers: 0.00% - 16.00%
Craft: 0.50% - 3.75%
Misc: 0.30% - 5.50%
Inflation Rate Wage Inflation: 3.25% compounded annually
Consumer Price Inflation: 2.50% compounded annually
Mortality Tables
Non-Annuitants
Published Table Male Female
Miscellaneous PubG-2010 Employee 0.834 0.866
Safety PubS-2010 Employee 1.011 0.979
Healthy Retirees
Published Table Male Female
Miscellaneous PubG-2010 Employee 1.031 0.977
Safety PubS-2010 Employee 0.947 1.044
Disabled Retirees
Published Table Male Female
Miscellaneous PubG-2010 Employee 1.045 1.003
Safety PubS-2010 Employee 0.916 0.995
Beneficiaries
Published Table Male Female
Miscellaneous PubG-2010 Employee 1.031 0.977
Safety PubG-2010 Employee 1.031 0.977
Adjustment Factor
Base mortality tables are developed by multiplying a published table by an adjustment factor developed in SFERS
experience study for the period ended June 30, 2019.
Adjustment Factor
Adjustment Factor
Adjustment Factor

CITY AND COUNTY OF SAN FRANCISCO
Notes to Basic Financial Statements (Continued)
June 30, 2023
(Dollars in Thousands)
140
The Transportation Authority net OPEB asset was measured as of June 30, 2022, and the total OPEB
liability used to calculate the net OPEB asset was determined using an actuarial valuation as of June
30, 2021. The Successor Agency’s net OPEB asset was measured as of June 30, 2022, and the total
pension liability used to calculate the net OPEB asset was determined by an actuarial valuation as of
June 30, 2021. A summary of the actuarial assumptions and methods used to calculate the total OPEB
liability are as follows:
Sensitivity of Net OPEB Liability (Asset) to Changes in the Healthcare Cost Trend Rate
The following presents the net OPEB liability (asset) for each plan calculated using the healthcare cost
trend rate, as well as what the plan’s net OPEB liability (asset) would be if it were calculated using a
healthcare cost trend rate that is 1% lower or 1% higher than the current rate:
Discount Rate
City OPEB Plan - The discount rate used to measure the total OPEB liability as of June 30, 2022 was
7.0%. The projection of cash flows used to determine the discount rate assumed that plan member and
employer contributions will continue to be made at the rates specified in the Charter, and disbursements
from the RHCTF will continue to be limited by the Charter until it is fully funded. Based on those
assumptions, it was determined that the OPEB Plan’s fiduciary net position was projected to be
available to make all future benefit payments of current and inactive employees. Therefore, the long-
term expected rate of return on OPEB plan investments was applied to all periods of projected benefit
payments to determine the total OPEB liability.
Key Actuarial Assumptions Transportation Authority Successor Agency
Actuarial Valuation Date
June 30, 2021 June 30, 2021
Discount Rate
7.59% 6.25%
General Inflation
2.75% per annum 2.50%
Salary Increases
2.75% per annum, in aggregate
2.75%; Merit based on 2017 CalPERS Experience
Study
Investment Rate of Return
7.59% 6.25%
Mortality, Turnover, Disability, and Retirement
CalPERS 2017 Experience Study for the
period from 1997 to 2015
CalPERS 2017 Experience Study for the period
from 1997 to 2015
Post-retirement mortality projected fully
generational with Scale MP-2020
Healthcare Cost Trend Rate
Initial 14% for non-medicare eligibles,
24.25% for spouse/domestic partner
medicare eligibles and 6.5% medicare
eligibles, all grading down to 4.0%
Non-Medicare - 6.75% for 2022, decreasing to an
ultimate rate of 3.75% in 2076;
Medicare (non-Kaiser)- 5.85% for 2022, decreasing
to an ultimate rate of 3.75% in 2076;
Medicare (Kaiser) - 4.75% for 2022, decreasing to
an ultimate rate of 3.75% in 2076
June 30, 2022 Measurement Date
Plan
1% Decrease Healthcare Trend 1% Increase
City Defined Benefit Plan 3,204,874$ 3,746,270$ 4,417,804$
Transportation Authority (408) (101) 290
Successor Agency (3,269) (2,118) (748)
June 30, 2022 (measurement year)

CITY AND COUNTY OF SAN FRANCISCO
Notes to Basic Financial Statements (Continued)
June 30, 2023
(Dollars in Thousands)
141
The long-term expected rate of return on OPEB plan investments was determined using a building-
block method in which expected future real rates of return (expected returns, net of OPEB plan
investment expense and inflation) are developed for each major asset class. These ranges are
combined to produce the long-term expected rate of return by weighting the expected future real rates
of return by the target asset allocation percentage and by adding expected inflation. The long-term
expected rate of return is based on the RHCTF’s investment consultant’s 10 and 20-year capital market
assumptions for the RHCTF’s asset allocation. The target allocation and best estimates of geometric
real rates of return for each major asset class are summarized in the following table:
Transportation Authority and Successor Agency - The discount rates used to measure the total
OPEB liability of the Transportation Authority and the Successor Agency were 7.59% and 6.25%,
respectively. The projections of cash flows used to determine the discount rates assumed that
Transportation Authority and Successor Agency contributions will be made at rates equal to the
actuarially determined contribution rates. Based on those assumptions, the OPEB plans’ fiduciary net
position was projected to be available to make all projected OPEB payments for current active and
inactive employees and beneficiaries. Therefore, the long-term expected rate of return on the OPEB
plans’ investments was applied to all periods of projected benefit payments to determine the total OPEB
liability of each plan.
Asset Class Target Allocation
Long-term
Expected Real
Rate of Return
Equities
U.S. Large Cap 28.0% 6.8%
U.S. Small Cap 3.0% 7.4%
Developed Market Equity (non-U.S.) 15.0% 7.5%
Emerging Market Equity 13.0% 8.4%
Credit
Bank Loans 3.0% 4.0%
High Yield Bonds 3.0% 4.4%
Emerging Market Bonds 3.0% 4.2%
Rate Securities
Investment Grade Bonds 9.0% 2.4%
Long-term Government Bonds 4.0% 2.8%
Short-term Treasury Inflation-Protected Securities (TIPS) 4.0% 1.9%
Private Markets
Private Equity 5.0% 10.0%
Core Private Real Estate 5.0% 6.1%
Risk Mitigating Strategies
Global Macro 5.0% 5.0%
Total 100.0%

CITY AND COUNTY OF SAN FRANCISCO
Notes to Basic Financial Statements (Continued)
June 30, 2023
(Dollars in Thousands)
142
The long-term expected rate of return on OPEB plan investments was determined using a building
block method in which expected future real rates of return (expected returns, net of OPEB plan
investment expense and inflation) are developed for each major asset class. These ranges are
combined to produce the long-term expected rate of return by weighting the expected future real rates
of return by the target asset allocation percentage and by adding expected inflation. The target
allocation and best estimates of arithmetic real rates of return for each major asset class are
summarized in the following table:
The following presents the net OPEB liability (asset) calculated using the discount rate, as well as what
the net OPEB liability (asset) would be if it were calculated using a discount rate that is 1% lower or 1%
higher than the current rate for each plan:
Asset Class
Target
Allocation
Long-Term Expected
Real Rate of Return
Target
Allocation
Long-Term Expected
Real Rate of Return
Global Equity 59.00% 5.25% 49.00% 4.56%
Fixed Income 25.00% 0.99% 23.00% 1.56%
Treasury Inflation Protection Securities 5.00% 0.45% 5.00% -0.08%
Real Estate Investment Trusts 8.00% 4.50% 20.00% 4.06%
Commodities 3.00% 3.00% 3.00% 1.22%
Total 100.00% 100.00%
Successor Agency
Transportation Authority
Plan
1% Decrease
6.00%
Discount Rate
7.00 %
1% Increase
8.00%
City Defined Benefit Plan 4,361,388$ 3,746,270$ 3,241,613$
1% Decrease
6.59%
Discount Rate
7.59%
1% Increase
8.59%
Transportation Authority 211$ (101)$ (357)$
1% Decrease
5.25%
Discount Rate
6.25%
1% Increase
7.25%
Successor Agency (957)$ (2,118)$ (3,100)$
June 30, 2022 (measurement year)
June 30, 2022 (measurement year)
June 30, 2022 (measurement year)

CITY AND COUNTY OF SAN FRANCISCO
Notes to Basic Financial Statements (Continued)
June 30, 2023
(Dollars in Thousands)
143
(10) FUND EQUITY
(a) Governmental Fund Balance
Fund balances for all the major and nonmajor governmental funds as of June 30, 2023, were distributed
as follows:
General Fund
Nonmajor
Governmental
Funds
Total
Governmental
Funds
Nonspendable
Imprest Cash, Advances, and Long-Term Receivables.. 1,174$ 356$ 1,530$
Restricted
Rainy Day................................................................ 114,539 - 114,539
Public Protection
Police.................................................................... - 12,316 12,316
Sheriff.................................................................... - 1,177 1,177
Other Public Protection........................................... - 41,789 41,789
Public Works, Transportation & Commerce................. - 236,623 236,623
Human Welfare & Neighborhood Development.............. - 1,883,783 1,883,783
Affordable Housing.................................................... - 216,773 216,773
Community Health..................................................... - 72,100 72,100
Culture & Recreation................................................. - 333,166 333,166
General Administration & Finance............................... - 46,191 46,191
Capital Projects........................................................ - 486,946 486,946
Debt Service............................................................. - 234,979 234,979
Total Restricted...................................................... 114,539 3,565,843 3,680,382
Committed
Budget Stabilization.................................................. 330,010 - 330,010
Assigned
Public Protection
Police.................................................................... 17,039 3,835 20,874
Sheriff.................................................................... 11,167 722 11,889
Other Public Protection........................................... 68,721 - 68,721
Public Works, Transportation & Commerce................. 98,692 88,420 187,112
Human Welfare & Neighborhood Development.............. 85,960 155,141 241,101
Affordable Housing.................................................... 367,496 - 367,496
Community Health..................................................... 237,714 - 237,714
Culture & Recreation................................................. 22,158 21,335 43,493
General Administration & Finance............................... 85,554 21,609 107,163
General City Responsibilities...................................... 74,249 - 74,249
Self-Insurance........................................................... 46,496 - 46,496
Capital Projects........................................................ 196,299 - 196,299
Litigation and Contingencies....................................... 262,730 - 262,730
Subsequent Year's Budget......................................... 150,628 - 150,628
Total Assigned........................................................ 1,724,903 291,062 2,015,965
Unassigned................................................................. 477,511 (1,936) 475,575
Total........................................................................... 2,648,137$ 3,855,325$ 6,503,462$
CITY AND COUNTY OF SAN FRANCISCO
Notes to Basic Financial Statements (Continued)
June 30, 2023
(Dollars in Thousands)
144
(b) General Fund Stabilization and Other Reserves
Rainy Day Reserve
The City maintains a “Rainy Day” or economic stabilization reserve under Charter Section 9.113.5, with
separate accounts for the benefit of the City (the City Reserve) and the San Francisco Unified School
District (the School Reserve). In any year when the City projects that total General Fund revenues for
the upcoming budget year are going to be more than five percent higher than the General Fund
revenues for the current year, the City automatically deposits one-half of the “excess revenues” in the
Rainy Day Reserve. Seventy-five percent of the deposit is placed in the City Reserve and twenty-five
percent is placed in the School Reserve. The total amount of money in the Rainy Day Reserve may not
exceed ten percent of the City’s actual total General Fund revenues. The City may spend money from
the City Reserve for any lawful governmental purpose, but only in years when the City projects that
total General Fund revenues for the upcoming year will be less than the current year’s total General
Fund revenues, i.e., years when the City expects to take in less money than it had taken in for the
current year. In those years, the City may spend up to half the money in the City Reserve, but no more
than is necessary to bring the City's total available General Fund revenues up to the level of the current
year. The School District may withdraw up to half the money in the School Reserve when it expects to
collect less money per student than the previous fiscal year and would have to lay off a significant
number of employees. The School District’s Board can override those limits and withdraw any amount
in the School Reserve by a two-thirds vote. The City does not expect to routinely spend money from
the Rainy Day Reserve after evaluating its recent General Fund revenues trends and its most recent
update to the Five-Year Financial Plan covering fiscal years 2023-24 through 2027-28.
Budget Stabilization Reserve
The City sets aside as an additional reserve 75 percent of (1) real estate transfer taxes in excess of the
average collected over the previous five years, (2) proceeds from the sale of land and capital assets,
and (3) ending unassigned General Fund balances. The City will be able to spend those funds in years
in which revenues decline or grow by less than two percent, after using the amount legally available
from the Rainy Day Reserve. The City, by a resolution of the Board of Supervisors adopted by a two-
thirds vote, may temporarily suspend these provisions following a natural disaster that has caused the
Mayor or the Governor to declare an emergency, or for any other purpose. The City does not expect to
routinely spend money from the Budget Stabilization Reserve after evaluating its recent General Fund
revenues trends and its most recent update to the Five-Year Financial Plan covering fiscal years
2023-24 through 2027-28.
(c) Encumbrances
At June 30, 2023, encumbrances recorded in the General Fund and nonmajor governmental funds
were $424.3 million and $869.8 million, respectively.
(d) Restricted Net Position
The City issued general obligation bonds and certificates of participation for the purpose of rebuilding
and improving Laguna Honda Hospital. General obligation bonds were also issued for the purpose of
reconstructing and improving waterfront parks and facilities on Port property and for the seismic
strengthening and repair of the Embarcadero Seawall managed by the Port and for the retrofit and
improvement work to ensure a reliable water supply managed by the Water Enterprise in an emergency
or disaster and for certain street improvements managed by the SFMTA. These capital assets are
reported in the City’s business-type activities. However, the debt service will be paid with governmental
revenues and as such these general obligation bonds and certificates of participation are reported with
unrestricted net position in the City’s governmental activities. In accordance with GASB guidance, the
City reclassified $532.2 million of unrestricted net position of governmental activities, of which $407.1
million reduced net investment in capital assets and $125.1 million reduced net position restricted for
capital projects to reflect the total column of the primary government as a whole perspective.
CITY AND COUNTY OF SAN FRANCISCO
Notes to Basic Financial Statements (Continued)
June 30, 2023
(Dollars in Thousands)
145
(e) Deficit Fund Balances and Net Position
The Senior Citizens Program Fund had a deficit of $1.5 million as of June 30, 2023. The deficit relates
to unavailable revenue in various programs, which is expected to be collected beyond 60 days of the
end of fiscal year 2023.
The Street Improvement Fund had a $0.4 million deficit as of June 30, 2023. The deficit relates to
unavailable revenue in various programs, which is expected to be collected beyond 60 days of the end
of fiscal year 2023.
The Central Shops Internal Service Fund had a deficit in total net position of $20.0 million as of June
30, 2023, mainly due to the accrual of other postemployment benefits liability. The operating deficit is
expected to be reduced in future years through anticipated rate increases or reductions in operating
expenses. The rates are reviewed and updated annually.
Prior to February 1, 2012, the California Redevelopment Law provided tax increment financing as a
source of revenue to redevelopment agencies to fund redevelopment activities. Due to the nature of
the redevelopment financing, the former Agency liabilities exceeded assets. Therefore, the former
Agency historically carried a deficit, which was expected to be reduced as future tax increment
revenues were received and used to reduce its outstanding long-term debt. This deficit was transferred
to the Successor Agency on February 1, 2012. The Successor Agency can only receive tax increment
to the extent that it can show on an annual basis that it has incurred indebtedness that must be repaid
with tax increment. At June 30, 2023, the Successor Agency has a deficit of $418.5 million, which will
be eliminated with future redevelopment property tax revenues distributed from the Redevelopment
Property Tax Trust Fund administered by the City’s Controller.

CITY AND COUNTY OF SAN FRANCISCO
Notes to Basic Financial Statements (Continued)
June 30, 2023
(Dollars in Thousands)
146
(11) UNAVAILABLE RESOURCES IN GOVERNMENTAL FUNDS
The deferred inflows of resources balance in governmental funds as of June 30, 2023, consists of the
following unavailable resources:
California Senate Bill 90 (SB90) was adopted in 1972 and added to the State Constitution in 1979.
When the Governor or Legislature mandates a new program or higher level of service upon local
agencies and school districts, SB90 requires the State to reimburse local agencies and school districts
for the cost of these new programs or higher levels of service. The balance in deferred inflows of
resources is the value of reimbursement claims submitted to the State, which are subject to audit for
unallowable costs.
As described in Note 6, under the Teeter Plan the City is allocated secured property tax revenue, which
has been billed but not collected. Collections which have not occurred within the availability period are
included in deferred inflows of resources in the General Fund.
General Fund
Other
Governmental
Funds
Total
Governmental
Funds
Grant and subvention revenues........................ 113,283$ 118,086$ 231,369$
Property tax............................................................ 179,335 7,556 186,891
Teeter Plan............................................................ 40,685 - 40,685
SB 90...................................................................... 4,634 - 4,634
PG&E franchise tax.............................................. 3,862 - 3,862
Loans...................................................................... 10,705 205,461 216,166
Leases................................................................... 79,916 - 79,916
Total........................................................................ 432,420$ 331,103$ 763,523$
CITY AND COUNTY OF SAN FRANCISCO
Notes to Basic Financial Statements (Continued)
June 30, 2023
(Dollars in Thousands)
147
(12) SAN FRANCISCO COUNTY TRANSPORTATION AUTHORITY
The Transportation Authority was created in 1989 by a vote of the San Francisco electorate. The vote
approved Proposition B, which imposed a sales tax of one-half of one percent (0.5%), for a period not
to exceed 20 years, to fund essential transportation projects. The types of projects to be funded with
the proceeds from the sales tax were set forth in the San Francisco County Transportation Expenditure
Plan (Expenditure Plan), which was approved as part of Proposition B. The Transportation Authority
was organized pursuant to Sections 131000 et seq. of the California Public Utilities Code. Collection of
the voter-approved sales tax began on April 1, 1990. The Transportation Authority administers the
following programs:
Sales Tax Program. San Francisco voters in November 2022 approved Proposition L, the Sales Tax
for Transportation Projects measure that will direct $2.60 billion (2020 dollars) in half-cent sales tax
funds over 30 years to help deliver safer, smoother streets, more reliable transit, continue paratransit
services for seniors and persons with disabilities, reduce congestion, and improve air quality.
Proposition L replaced the 2003 Proposition K Expenditure Plan with a new 30-year Expenditure Plan.
The Prop L Expenditure Plan includes investments in five major categories: 1) Major Transit Projects
(such as Muni Rail Core Capacity, BART Core Capacity, and the Caltrain Downtown Rail Extension);
2) Transit Maintenance and Enhancements; 3) Paratransit (services for seniors and people with
disabilities); 4) Streets and Freeways (including funds for pedestrian and bicycle improvements, signals
and traffic calming, street repaving); and 5) Transportation System Development and Management
(including funds for transportation demand management, neighborhood and equity-focused planning
and implementation). Under Proposition L legislation, the Transportation Authority directs the use of
the Sales Tax and may issue up to $1.91 billion in bonds secured by the Sales Tax.
Congestion Management Agency (CMA) Programs. On November 6, 1990, the Transportation
Authority was designated under State law as the CMA for the City. Responsibilities resulting from this
designation include developing a Congestion Management Program, which provides evidence of the
integration of land use, transportation programming, and air quality goals; preparing a long-range
countywide transportation plan to guide the City’s future transportation investment decisions;
monitoring and measuring traffic congestion levels in the City; measuring the performance of all modes
of transportation; and developing a computerized travel demand forecasting model and supporting
databases. As the CMA, the Transportation Authority is responsible for establishing the City’s priorities
for certain state and federal transportation funds and works with the Metropolitan Transportation
Commission to program those funds to San Francisco projects.
Transportation Fund for Clean Air (TFCA) Program. On June 15, 2002, the Transportation Authority
was designated to act as the overall program manager for the local guarantee (40%) share of
transportation funds available through the TFCA program. Funds from this program, administered by
the Bay Area Air Quality Management District, come from a $4 vehicle registration fee on automobiles
registered in the Bay Area. Through this program, the Transportation Authority recommends projects
that benefit air quality by reducing motor vehicle emissions.
Vehicle Registration Fee for Transportation Improvements Program. On November 2, 2010, San
Francisco voters approved Proposition AA with a 59.6% affirmative vote, authorizing the Transportation
Authority to collect an additional $10 annual vehicle registration fee on motor vehicles registered in San
Francisco, and to use the proceeds to fund transportation projects identified in the 30-year Expenditure
Plan. Revenue collection began in May 2011. Proposition AA revenues must be used to fund projects
from the following three programmatic categories. The percentage allocation of revenues, designated
for each category over the 30-year Expenditure Plan period, is shown in parentheses for the following
category name: Street Repair and Reconstruction (50%); Pedestrian Safety (25%); and Transit
Reliability and Mobility Improvements (25%).
CITY AND COUNTY OF SAN FRANCISCO
Notes to Basic Financial Statements (Continued)
June 30, 2023
(Dollars in Thousands)
148
Treasure Island Mobility Management Authority (TIMMA). The Treasure Island Transportation
Management Act of 2008 (Assembly Bill 981, Leno) authorizes the creation or designation of a Treasure
Island-specific transportation management agency. On April 1, 2014, the City’s Board of Supervisors
approved a resolution designating the Transportation Authority as the TIMMA to implement the
Treasure Island Transportation Implementation Plan in support of the Treasure Island/Yerba Buena
Island Development Project. In September 2014, Governor Brown signed Assembly Bill 141
(Ammiano), establishing TIMMA as a legal entity, distinct from the Transportation Authority, to help
firewall the Transportation Authority’s other functions. The 11 members of the Transportation Authority
Board act as the Commissioners for TIMMA Board. The Transportation Authority financial statements
include TIMMA as a blended special revenue component unit.
Traffic Congestion Mitigation Tax. The Traffic Congestion Mitigation Tax was approved by San
Francisco voters on November 5, 2019, through approval of Proposition D. The measure, also referred
to as the Transportation Network Company (TNC) Tax, is a surcharge on commercial ride‐hailing trips
that originate in San Francisco, for the portion of the trip within the City. The intent of the TNC Tax
program is to support transit and street safety improvements on San Francisco’s roadways, helping to
mitigate the effects of increased congestion due to TNC vehicles. Beginning January 1, 2020, a 1.5%
tax is charged on shared rides or rides taken in a zero‐emission vehicle, and 3.25% is charged on rides
with a single occupant. The measure also takes into account rides provided by autonomous vehicles
that are taxed in this same manner and rides provided by private transit companies, if a company were
to enter the market. The tax is in effect until November 2045. After a 2% set aside for administration by
the City, 50% of the revenues are directed to the SFMTA for transit operations and improvements, and
50% to the Transportation Authority for bicycle and pedestrian safety improvements, traffic calming,
traffic signals upgrades and retimings.
CITY AND COUNTY OF SAN FRANCISCO
Notes to Basic Financial Statements (Continued)
June 30, 2023
(Dollars in Thousands)
149
(13) DETAILED INFORMATION FOR ENTERPRISE FUNDS
(a) San Francisco International Airport
San Francisco International Airport (the Airport or SFO), which is owned and operated by the City, is
the principal commercial service airport for the San Francisco Bay Area. A five-member Commission is
responsible for the operation, development and management of the Airport. The Airport is located 14
miles south of downtown San Francisco in an unincorporated area of San Mateo County, between the
Bayshore Freeway (U.S. Highway 101) and the San Francisco Bay. The Airport is also a major origin
and destination point and one of the nation’s principal gateways for Pacific traffic.
The Airport has pledged all of the Net Revenues (as defined in bond resolutions adopted by the Airport
Commission) to repay the following obligations, when due, in order of priority, (1) the San Francisco
International Airport Second Series Revenue Bonds (Senior Bonds) and a portion of amounts due to
reimburse drawings under the letters of credit securing the Senior Bonds, (2) the Subordinate
Commercial Paper Notes and any other obligations (Subordinate Bonds) and amounts due to
reimburse drawings under the letters of credit securing the Commercial Paper Notes, (3) remaining
amounts due to reimburse drawings under the letters of credit securing the Senior Bonds, and (4)
interest rate swap termination payments.
During fiscal year 2022-23, the original principal amount of the Senior Bonds and Commercial Paper
Notes issued, principal and interest remaining due on outstanding Senior Bonds and Commercial Paper
Notes, principal and interest paid on such obligations, and applicable Net Revenues are as set forth in
the table below. There were no unreimbursed drawings under any letter of credit or interest rate swap
termination payments due.
Bonds issued with revenue pledge .......................................................................... $ 241,915
Bond principal and interest remaining due at end of the fiscal year ........................ 14,950,425
Bond principal and interest paid in the fiscal year ................................................... 400,509
Commercial paper issued with subordinate revenue pledge ................................... 417,250
Commercial paper principal and interest remaining due at end of the fiscal year ... 504,135
Commercial paper principal, interest and fees paid in the fiscal year ..................... 6,291
Net revenues ............................................................................................................ 511,495
In addition, pursuant to the Hotel Trust Agreement, the Airport has pledged all of the Revenues of the
on-Airport Hotel and certain other assets pledged under the Amended and Restated Hotel Trust
Agreement, to repay the Hotel Special Facility Bonds. This pledge is in force so long as the Hotel
Special Facility Bonds are outstanding. The Hotel Special Facility Bonds mature in fiscal year 2057-58
and are subject to mandatory sinking fund redemption each year starting in 2025. The Hotel Special
Facility Bonds are not payable from or secured by the Net Revenues of the Airport.
Reserves and Debt Service - Under the terms of the 1991 Master Bond Resolution, the Airport may
establish one or more reserve accounts with different reserve requirements to secure one or more
series of Senior Bonds. Accordingly, the Airport has established two reserve accounts in the Reserve
Fund: the Issue 1 Reserve Account, and the 2017 Reserve Account, all held by the trustee for the
Senior Bonds. The reserve requirement for the Issue 1 Reserve Account is equal to the maximum
annual debt service accruing in any year during the life of all participating series of bonds secured by
the Issue 1 Reserve Account. The reserve requirement for the 2017 Reserve Account is equal to the
lesser of: (i) the maximum amount of aggregate annual debt service for all 2017 Reserve Series Bonds
in any fiscal year during the period from the date of calculation to the final scheduled maturity of the
2017 Reserve Series Bonds, (ii) 10% of the outstanding aggregate principal amount of all 2017 Reserve
Series Bonds (provided that the issue price of a Series of 2017 Reserve Series Bonds will be used in
this calculation if such Series was sold with an original issue discount that exceeded 2% of the principal
of such Series on its original date of sale), and (iii) 125% of the average aggregate annual debt service
for all 2017 Reserve Series Bonds. As of June 30, 2023, only the Series 2017D, 2019B, and 2019D

CITY AND COUNTY OF SAN FRANCISCO
Notes to Basic Financial Statements (Continued)
June 30, 2023
(Dollars in Thousands)
150
Bonds are secured by the 2017 Reserve Account. Alternatively, the Airport may establish a separate
reserve account with a different reserve requirement to secure an individual series of Senior Bonds or
may issue Senior Bonds without a reserve account.
While revenue bonds are outstanding, the Airport may not create liens on its property essential to
operations, may not dispose of any property essential to maintaining revenues or operating the Airport,
and must maintain specified levels of insurance or self-insurance.
Under the terms of the 1991 Master Bond Resolution, the Airport has covenanted that it will establish
and at all times maintain rentals, rates, fees, and charges for the use of the Airport and for services
rendered by the Airport so that:
(i) Net revenues in each fiscal year will be at least sufficient (i) to make all required debt service
payments and deposits in such fiscal year with respect to the bonds, any subordinate bonds, and
any general obligation bonds issued by the City for the benefit of the Airport and (ii) to make the
annual service payment to the City, and
(ii) Net revenues, together with any transfer from the Contingency Account to the Revenue Account
(both held by the City Treasurer), in each fiscal year will be at least equal to 125% of aggregate
annual debt service with respect to the bonds for such fiscal year.
The methods required by the 1991 Master Bond Resolution for calculating debt service coverage differs
from GAAP used to determine amounts reported in the Airport’s financial statements.
Passenger Facility Charges –The Airport, as authorized by the Federal Aviation Administration (FAA)
pursuant to the Aviation Safety and Capacity Expansion Act of 1990 (the Act), as amended, imposes a
Passenger Facility Charge (PFC) of $4.50 for each enplaned passenger at the Airport. Under the Act,
air carriers are responsible for the collection of PFC and are required to remit PFC revenues to the
Airport in the following month after they are recorded by the air carrier. As of June 30, 2023, the FAA
has approved Airport applications (PFC #2 to PFC #9) for collection and use within a total cumulative
collection amount of $2.3 billion. The final charge expiration date is estimated to be December 1, 2030.
For the year ended June 30, 2023, the Airport reported approximately $99.4 million of PFC revenue,
which is included in other nonoperating revenues in the accompanying basic financial statements.
Commitments and Contingencies - Purchase commitments for construction, material and services
as of June 30, 2023, are as follows:
Construction ........................................... $ 40,615
Operating ................................................ 47,693
Total ........................................................ $ 88,308
Transactions with Other Funds. Pursuant to the Lease and Use Agreement between the Airport and
most of the airlines operating at the Airport, the Airport makes an annual service payment to the City’s
General Fund equal to 15% of concession revenue (net of certain adjustments), but not less than $5.0
million per fiscal year, in order to compensate the City for all indirect services provided to the Airport.
The annual service payment for the year ended June 30, 2023, was $48.7 million and was recorded as
a transfer. In addition, the Airport pays for the cost of certain direct services provided by City
departments to the Airport, including those provided by the Police Department, Fire Department, City
Attorney, City Treasurer, City Controller, City Purchasing Agent and other City departments. The cost
of direct services paid for by the Airport for the year ended June 30, 2023, was $186.4 million.
CITY AND COUNTY OF SAN FRANCISCO
Notes to Basic Financial Statements (Continued)
June 30, 2023
(Dollars in Thousands)
151
Business Concentrations - In addition to the Lease and Use Agreements with the airlines, the Airport
leases other businesses to operate concessions at the Airport. For the year ended June 30, 2023,
revenues realized from the following Airport tenant exceeded five percent of the Airport’s total operating
revenues:
United Airlines ............................................... 26.2%
(b) Port of San Francisco
A five-member Port Commission is responsible for the operation, development, and maintenance
activities of the Port of San Francisco (Port). In February 1969, the Port was transferred in trust to the
City under the terms and conditions of State legislation (Burton Act) ratified by the electorate of the
City. Prior to 1969, the Port was operated by the State of California. The State retains the right to
amend, modify or revoke the transfer of lands in trust provided that it assumes all lawful obligations
related to such lands.
Pledged Revenues – The Port’s revenues, derived primarily from property rentals to commercial and
industrial enterprises and from maritime operations, which include cargo, fishing, harbor services,
cruise and other maritime activities, are held in a separate enterprise fund and appropriated for
expenditure pursuant to the budget and fiscal provisions of the City Charter, consistent with trust
requirements. Under the public trust doctrine, the Burton Act, and the transfer agreement between the
City and the State, Port revenues may be spent only for uses and purposes of the public trust.
The Port pledged future net revenues to repay its revenue bonds. As of June 30, 2023, the total principal
and interest remaining to be paid on the bonds is $55.2 million. The principal and interest payments
made in 2023 were $3.3 million and net revenue for the year ended June 30, 2023, was $60.6 million.
The Port has entered into a loan agreement with the California Division of Boating and Waterways for
$3.5 million to finance certain Hyde Street Harbor improvements. The loan is subordinate to all bonds
payable by the Port and is secured by gross revenues as defined in the loan agreement. The total
principal and interest remaining to be paid on this loan is $1.4 million. Annual principal and interest
payments were $0.2 million in 2023 and pledged harbor revenues were $0.2 million for the year ended
June 30, 2023.
Commitments and Contingencies – The Port is presently planning various development and capital
projects that involve a commitment to expend significant funds. As of June 30, 2023, the Port’s
purchase commitments for construction-related services, materials and supplies, and other services
were $12.4 million for capital projects and $3.8 million for general operations.
Transactions with Other Funds – The Port receives from, and provides services to, various City
departments. In fiscal year 2022-23, the $27.8 million in services provided by other City departments
included $8.8 million of insurance premiums and $1.0 million in workers’ compensation expense.
On September 27, 2018, the Port and Mayor’s Office of Housing and Community Development
(MOHCD) entered into a Memorandum of Understanding to implement the affordable housing
development project at the Seawall Lot 322-1 (“88 Broadway”). In August 2019, the Port received $15.0
million from MOHCD, which included additional interest accrued since June 30, 2019. As part of the
88 Broadway project, the Port entered into a Ground Lease with a developer in March 2019. The
Ground Lease has a term of fifty-seven years plus one eighteen extension option (a 75-year maximum
term but with expiration no later than December 31, 2105). The lease revenues are being amortized
over the 75-year maximum term of the lease. At June 30, 2023, the Port has a deferred inflow balance
in the amount of $13.7 million related to this Ground Lease. In addition to the payment by MOHCD,
the Developer will be required to make lease payments representing a share of any cash flow generated
by commercial activities.

CITY AND COUNTY OF SAN FRANCISCO
Notes to Basic Financial Statements (Continued)
June 30, 2023
(Dollars in Thousands)
152
In December 2017, the Port and the San Francisco Fire Department (SFFD) entered into a MOU for
the use of water, apron, shed and office space at Pier 26 for berthing and servicing of fire boats for five
years and on a month-to-month basis afterward. To facilitate these uses, SFFD repaired apron decking,
replaced the fender system within the leasehold area and upgraded electrical services to Pier 26. In
return, the Port allowed SFFD to apply a hundred percent rent credits toward the lease payments until
all required capital improvements, approximately $2.3 million, are fully offset. As of June 30, 2023, rent
credits of $0.7 million have been provided to SFFD.
In December 2019, the Port and San Francisco Fire Department (SFFD) entered into an MOU for the
installation of the newly constructed Fireboat Station 35, a floating first response facility, at Pier 22½.
This MOU replaced the existing License 501 for the use of the Pier 22½ shed as a firehouse building.
In 2022, the Port authorized SFFD to apply $0.9 million of rent credits toward the lease payments for
the tenant improvements to the existing marginal wharf and substructure as part of the Project for a
dedicated public access area. As of June 30, 2023, rent credits of $0.08 million have been provided to
SFFD.
South Beach Harbor Project Commitments – On May 1, 2019, the Successor Agency transferred
South Beach Harbor operations to the Port. Under San Francisco Bay Conservation and Development
Commission (BCDC) Permit Amendment No. 17 for the South Beach Harbor Project, certain public
access and other improvements were to be completed by December 31, 2017. Construction estimates
prepared by a Port consultant in 2014 indicate that the required uncompleted work would cost
approximately $7.9 million. The Port has worked with the water recreation community to develop an
alternative public access improvement proposal for BCDC consideration. Port management believes
that the alternative proposal will provide significant public access improvements that are relevant to the
project area and at a lower cost. On December 18, 2020, BCDC issued Amendment No. 20 for the
South Beach Harbor Permit (1984.002.20) requiring amended project work to be completed by
December 31, 2024, including installation of a new guest dock, kayak launch, and hoists located at Pier
40.
Pollution Remediation Obligations – The Port’s financial statements include liabilities, established
and adjusted periodically, based on new information, in accordance with applicable GAAP, for the
estimated costs of compliance with environmental laws and regulations and remediation of known
contamination. As future development planning is undertaken, the Port evaluates its overall provisions
for environmental liabilities in conjunction with the nature of future activities contemplated for each site
and accrues a liability, if necessary. It is, therefore, reasonably possible that in future reporting periods
current estimates of environmental liabilities could materially change.
Port lands are subject to environmental risk elements typical of sites with a mix of light industrial
activities dominated by transportation, transportation-related and warehousing activities. Due to the
historical placement of fill of varying quality, and widespread use of aboveground and underground
tanks and pipelines containing and transporting fuel, elevated levels of petroleum hydrocarbons and
lead are commonly found on Port properties. Consequently, any significant construction, excavation or
other activity that disturbs soil or fill material or bay sediment may encounter hazardous materials and/or
generate hazardous waste.
The Port has identified certain environmental issues related to Port property, including polychlorinated
biphenyls, polycyclic aromatic hydrocarbons and other oil contamination. The Port may be required to
perform certain clean-up work if it intends to develop or lease the property, or at such time as required
by the City or State. There are sites where groundwater contamination may be later identified, where
the Port has primary or secondary responsibility. The potential liability for all such risk cannot be
reasonably made at this time.
A 69-acre area commonly known as “Pier 70” has been used for over 150 years for iron and steel
works, ship building and repair, and other heavy industrial operations. Much of the site was owned
and/or occupied by the U.S. Navy or its contractors for at least 60 years. A long history of heavy
industrial use has turned this area into a “brownfield” – an underutilized property area where reuse is

CITY AND COUNTY OF SAN FRANCISCO
Notes to Basic Financial Statements (Continued)
June 30, 2023
(Dollars in Thousands)
153
hindered by actual or suspected contamination. Fifteen acres remain occupied by an on-going ship
repair facility. Environmental conditions exist that require investigation and remediation prior to any
rehabilitation or development for adaptive reuse. The lack of adequate information about environmental
conditions has hindered previous development proposals for Pier 70.
Investigation work completed in 2011 reduced the uncertainty regarding the nature and extent of
contamination, potential need for remediation, and costs associated with implementation of a risk
management plan. The Regional Water Quality Control Board approved the Risk Management Plan in
January 2014. The Risk Management Plan provides institutional controls (e.g. use restrictions, health
and safety plans) and engineering controls (e.g. capping contaminated soil) to protect current and future
users and prevent adverse impact to the environment. The Risk Management Plan specifies how future
development, operation, and maintenance will implement the remedy, by covering existing site soil with
buildings, streets, plazas, hardscape or new landscaping, thereby minimizing or eliminating exposure
to contaminants in soil.
The Port evaluates cost estimates annually based on additional information and transaction events that
may impact the pollution remediation outlays. The accrued cost for pollution remediation at Pier 70 is
estimated to be $3.5 million at June 30, 2023. These are obligations not assumed by the Port
development partners. In addition, the Port estimates the cost to install a sediment cap offshore along
the former Pier 70 Shipyard and adjacent to Crane Cove Park at $2.5 million and the cost to perform
studies and risk assessments involving the Pier 70 Undeveloped Upland area at $0.8 million.
The Port’s Mission Bay Ferry Landing (MBFL) project is located adjacent to the south side of the former
Pier 64. The MBFL project consists of approximately eight acres of in-water area, dredging, ferry berths,
and a few hundred feet of armored shoreline. The Port completed phase one of MBFL construction in
November 2020. A marine mattress and additional sand layer will be part of the phase two construction
to protect the sand layer from erosion. Construction for phase two is scheduled for fiscal year 2024-
25. As of June 30, 2023, the Port estimated this pollution remediation obligation to be $3.7 million. This
estimate is not intended to reflect an admission of liability.
Other environmental conditions on Port property include polycyclic aromatic hydrocarbons and oil
contamination at various sites. As of June 30, 2023, pollution remediation liabilities are estimated at
$3.7 million for the rest of the Port’s properties.
A summary of environmental liabilities, included in noncurrent liabilities, at June 30, 2023, is as follows:
(c) San Francisco Water Enterprise
The San Francisco Water Enterprise (Water Enterprise) was established in 1930. The Water
Enterprise, which consists of a system of reservoirs, storage tanks, water treatment plants, pump
stations, and pipelines, is engaged in the collection, transmission and distribution of water to the City
and certain suburban areas. In fiscal year 2022-23, the Water Enterprise sold water, approximately
62,227 million gallons annually, to a total population of approximately 2.7 million people who reside
primarily in four Bay Area counties (San Francisco, San Mateo, Santa Clara and Alameda).
The San Francisco Public Utilities Commission, established in 1932, provides the operational oversight
for the Water Enterprise, Hetch Hetchy Water and Power (Hetch Hetchy and CleanPowerSF), and the
San Francisco Wastewater Enterprise. Under Proposition E, the City’s Charter Amendment approved
Environmental
Remediation
Environmental liabilities at July 1, 2022…............ 9,683$
Current year claims and changes in estimates…. 1,242
Environmental liabilities at June 30, 2023…......... 10,925$
CITY AND COUNTY OF SAN FRANCISCO
Notes to Basic Financial Statements (Continued)
June 30, 2023
(Dollars in Thousands)
154
by the voters in June 2008, the Mayor nominates candidates subject to qualification requirements to
the Commission and the Board of Supervisors votes to approve the nominees by a majority (at least
six members).
Pledged Revenues – The Water Enterprise has pledged future revenues to repay various bonds and
State Revolving Fund loans. Proceeds from the revenue bonds and State Revolving Fund loans
provided financing for various capital construction projects and to refund previously issued bonds.
These bonds and State Revolving Fund loans are payable solely from revenues of the Water Enterprise
and are payable through fiscal year 2057-58.
The original amount of revenue bonds and State Revolving Fund loans issued, total principal and
interest remaining, principal and interest paid during 2023 and applicable revenues for 2023 are as
follows:
Bonds issued with revenue pledge .......................................................................... $ 4,882,130
Principal and interest remaining due at end of the fiscal year ................................. 7,193,317
Clean Water State Revolving Fund (CWSRF) loans with revenue pledge………… 163,627
Bond principal and interest paid in the fiscal year ................................................... 307,062
Net revenues ............................................................................................................ 372,689
Funds available for revenue bond debt service ....................................................... 566,764
Water Balancing Account – During fiscal year 2022-23, the wholesale revenue requirement, net of
adjustments, charged to wholesale customers was $300.5 million. Such amounts are subject to final
review by wholesale customers, along with a trailing wholesale balancing account compliance audit of
the wholesale revenue requirement calculation. As of June 30, 2023, the Wholesale Customers owed
the Enterprise $10.1 million under the Water Supply Agreement.
Commitments and Contingencies – As of June 30, 2023, the Water Enterprise had outstanding
commitments with third parties of $220.7 million for various capital projects and other purchase
agreements.
Environmental Issue – As of June 30, 2023, the total pollution remediation liability was $1.3 million,
for the excavation of contaminated soil that contained polycyclic aromatic hydrocarbons from a gun
club site in the Lake Merced area.
Transactions with Other Funds – The Water Enterprise purchases water from Hetch Hetchy Water
and electricity from Hetch Hetchy Power at market rates. These amounts, totaling approximately $49.6
million and $11.4 million, respectively, for the year ended June 30, 2023, are included in the operating
expenses for services provided by other departments in the Water Enterprise’s financial statements.
A variety of other City departments provide services such as engineering, purchasing, legal, data
processing, telecommunications, and human resources to the Water Enterprise and charge amounts
designed to recover those departments’ costs. These charges total approximately $18.7 million for the
year ended June 30, 2023 and have been included in services provided by other departments.
(d) Hetch Hetchy Enterprise
San Francisco Hetch Hetchy Water and Power (Hetch Hetchy or the Enterprise) was established as a
result of the Raker Act of 1913, which granted water and power resources rights-of-way on the
Tuolumne River in Yosemite National Park and Stanislaus National Forest to the City. CleanPowerSF,
launched in May 2016, provides green electricity from renewable sources to residential and commercial
customers in San Francisco and was reported as part of Hetch Hetchy starting fiscal year 2016. Hetch
Hetchy is a stand-alone enterprise comprised of three funds, Hetchy Power (the Power Enterprise),
CleanPowerSF and Hetchy Water, the portion of the Water Enterprise’s operations, specifically the
upcountry water supply and transmission service. Hetch Hetchy is engaged in the collection and
conveyance of approximately 85.0% of the City’s water supply and in the generation and transmission
CITY AND COUNTY OF SAN FRANCISCO
Notes to Basic Financial Statements (Continued)
June 30, 2023
(Dollars in Thousands)
155
of electricity from that resource, as well as the City Power services including energy efficiency and
renewable.
Approximately 61.0% of the electricity generated by Hetchy Power is used to provide electric service
to the City’s municipal customers (including the SFMTA, the Recreation and Park Department, the Port,
the Airport and its tenants, SFGH, streetlights, Moscone Convention Center, and the Water and
Wastewater Enterprises). The majority of the remaining 39.0% balance of electricity is sold to
CleanPowerSF and the wholesale electric market . As a result of the 1913 Raker Act, energy produced
above the City’s Municipal Load is sold first to the Districts (Modesto Irrigation District and Turlock
Irrigation District) to cover their agricultural pumping and municipal load needs and any remaining
energy is either sold to other municipalities and/or government agencies (not for resale) or sold into the
California Independent System Operator (CAISO). Hetch Hetchy operation is an integrated system of
reservoirs, hydroelectric power plants, aqueducts, pipelines, and transmission lines.
Hetch Hetchy also purchases wholesale electric power from various energy providers that are used in
conjunction with owned hydro resources to meet the power requirements of its customers. Operations
and business decisions can be greatly influenced by market conditions, State and federal power matters
before the California Public Utilities Commission (CPUC), the CAISO, and the Federal Energy
Regulatory Commission (FERC). Therefore, Hetch Hetchy serves as the City’s representative at CPUC,
CAISO, and FERC forums and continues to monitor regulatory proceedings.

CITY AND COUNTY OF SAN FRANCISCO
Notes to Basic Financial Statements (Continued)
June 30, 2023
(Dollars in Thousands)
156
Segment Information – Hetch Hetchy Power issued debt to finance its improvements. The Hetch
Hetchy Water fund, the Hetch Hetchy Power fund, and CleanPowerSF fund are reported for in a single
enterprise. However, investors in the debt rely solely on the revenue generated by the individual
activities for repayment. Summary financial information for Hetch Hetchy is presented below:
Condensed Statements of Net Position
Hetch Hetchy
Water
Hetch Hetchy
Power
CleanPowerSF Total
Assets*:
Current assets….................................................................. 79,709$ 251,534$ 146,482$ 477,725$
Receivables from other funds and component units…....... - 11,486 - 11,486
Noncurrent restricted cash and investments…................... 10,980 21,446 - 32,426
Other noncurrent assets…................................................. 423 9,832 11,454 21,709
Capital assets…................................................................... 219,754 646,946 - 866,700
Total assets….................................................................. 310,866 941,244 157,936 1,410,046
Deferred outflows of resources:
Pensions…........................................................................... 8,858 10,826 1,292 20,976
Other postemployment benefits…....................................... 3,248 3,969 1,009 8,226
Total deferred outflows of resources…............................ 12,106 14,795 2,301 29,202
Liabilities:
Current liabilities…................................................................ 9,888 65,390 31,461 106,739
Noncurrent liabilities….......................................................... 31,730 363,468 6,557 401,755
Total liabilities…................................................................ 41,618 428,858 38,018 508,494
Deferred inflows of resources:
Pensions…............................................................................ 4,142 5,062 1,296 10,500
Other postemployment benefits…........................................ 3,084 3,769 2,922 9,775
Total deferred inflows of resources…................................ 7,226 8,831 4,218 20,275
Net position:
Net investment in capital assets…....................................... 219,754 336,281 - 556,035
Restrictricted for capital projects…...................................... 5,233 - - 5,233
Restricted for debt service…................................................ - 56 - 56
Unrestricted…....................................................................... 49,141 182,013 118,001 349,155
Total net position…............................................................ 274,128$ 518,350$ 118,001$ 910,479$
* Certain amounts presented herein have been reclassified from the Statement of Net Position
Condensed Statements of Revenues, Expenses,
Hetch Hetchy Hetch Hetchy
and Changes in Fund Net Position Water Power
CleanPowerSF Total
Operating revenues…......................................................... 52,697$ 204,003$ 326,777$ 583,477$
Depreciation expense…...................................................... (6,524) (17,877) (270) (24,671)
Other operating expenses…............................................... (43,487) (173,675) (294,510) (511,672)
Operating income …..................................................... 2,686 12,451 31,997 47,134
Nonoperating revenues (expenses):…................................
Federal and state grants…........................................... 1,627 937 1,173 3,737
Interest and investment income….....…........................ 457 3,741 405 4,603
Interest expense…........................................................ (4) (9,486) (1) (9,491)
Other nonoperating revenues net of expenses…......... 180 14,025 107 14,312
Capital contributions…........................................................ - 2,535 - 2,535
Transfer in (out), net…........................................................ 20,000 (32) - 19,968
Change in net position…..................................................... 24,946 24,171 33,681 82,798
Net position at beginning of year, as restated..................... 249,182 494,179 84,320 827,681
Net position at end of year…............................................... 274,128$ 518,350$ 118,001$ 910,479$
Hetch Hetchy
Water
Hetch Hetchy
Power
CleanPowerSF Total
Net cash provided by (used in): x
Operating activities…..............................................................
x (933)$ 48,520$ 39,626$ 87,213$
Noncapital financing activities…...........................................................
x 20,535 4,244 3,349 28,128
Capital and related financing activities…..................................................
x (26,042) (7,474) (272) (33,788)
Investing activities…................................................................
x 914 3,663 1,207 5,784
Increase (decrease) in cash and cash equivalents….......................................................................
x (5,526) 48,953 43,910 87,337
Cash and cash equivalents at beginning of year….......................................................................
x 97,383 208,857 57,887 364,127
Cash and cash equivalents at end of year….......................................................................
x 91,857$ 257,810$ 101,797$ 451,464$
Condensed Statements of Cash Flows
CITY AND COUNTY OF SAN FRANCISCO
Notes to Basic Financial Statements (Continued)
June 30, 2023
(Dollars in Thousands)
157
Pledged Revenues – Hetch Hetchy Power has pledged future power revenues to repay the 2008
Clean Renewable Energy Bonds (CREBs), the 2011 Qualified Energy Conservation Bonds (QECBs),
and the 2015 New Clean Renewable Energy Bonds (NCREBs). Additionally, Hetch Hetchy Power has
pledged future power revenues for 2015 Series AB power revenue bonds and 2021 Series AB power
revenue bonds. Proceeds from the bonds provided financing for various capital construction and facility
energy efficiency projects. 2015 Series AB and 2021 Series AB power revenue bonds are payable
through fiscal year 2045-46 and 2051-52, respectively, and are solely payable from net revenues of
Hetch Hetchy Power on a senior lien basis to the 2008 CREBs, the 2011 QECBs, and the 2015
NCREBs.
The original amount of revenue bonds issued, total principal and interest remaining, principal and
interest paid during fiscal year 2022-23, applicable net revenues, and funds available for debt service
are as follows:
Hetch Hetchy Power
Bonds issued with revenue pledge .......................................................................... $ 182,271
Bond principal and interest remaining due at end of the fiscal year ........................ 281,546
Bond principal and interest paid in the fiscal year* .................................................. 3,905
Net revenues …………………………………………………………………………….. 52,195
Funds available for revenue bond debt service ....................................................... 162,399
* Per Indenture, debt service for coverage is calculated using the amount of principal and interest paid during the year for the
2015 Series AB and 2021 Series AB power revenue bonds net of capitalized interest if any, which have a senior lien on
Power Enterprise revenues; principal and interest paid during the year for the 2015 Series AB and 2021 Series AB power
revenue bonds was $2,567, net of capitalized interest.
Commitments and Contingencies – As of June 30, 2023, Hetch Hetchy had outstanding
commitments with third parties of $136.3 million for various capital projects and other purchase
agreements for materials and services.
Hetch Hetchy Water
To meet certain requirements of the Don Pedro Reservoir operating license, the City entered into an
agreement with the Modesto Irrigation District and Turlock Irrigation District (collectively the Districts)
in which the Districts would be responsible for an increase in water flow releases from the reservoir in
exchange for annual payments from the City, which are included in Hetchy Water’s operating expenses.
Total payments were $5.3 million in fiscal year 2022-23. The payments are to be made for the duration
of the license but may be terminated with one year’s prior written notice after 2001. The City and the
Districts have also agreed to monitor the fisheries, in the lower Tuolumne River, for the duration of the
license. A maximum monitoring expense of $1.4 million is to be shared between the City and the
Districts over the term of the license. The City’s share of the monitoring costs is 52.0% and the Districts
are responsible for 48.0% of the costs.
Hetch Hetchy Power
Upon expiration of the City’s previous Interconnection Agreement with PG&E, the City began taking
service in 2015 under the Wholesale Distribution Tariff (WDT) for distribution service and under the
CAISO Open-Access Transmission Tariff for transmission service. The FERC-regulated Wholesale
Distribution Tariff is implemented by PG&E through the City specific Service Agreements and
Interconnection Agreements. The terms of these agreements have been in contention since the
effective date. The City is continuing to negotiate with PG&E and, where necessary, filing complaints
and protests at FERC. In September 2020, PG&E filed a revised WDT. Under the terms of the new
WDT, the City would pay substantially higher rates, at least twice to potentially four times the current
charges, and be required to install costly and inefficient equipment not needed for technical, safety or
reliability of operations. In addition, Hetchy Power would no longer be allowed to connect to the
CITY AND COUNTY OF SAN FRANCISCO
Notes to Basic Financial Statements (Continued)
June 30, 2023
(Dollars in Thousands)
158
“network” grid in the center of San Francisco; have new secondary interconnections; and/or serve any
small, typically unmetered loads, such as streetlights, traffic signal and bus shelters.
Staff prepare regular reporting to the Board of Supervisors outlining on-going disputes with PG&E over
project requirements, costs and delays. During fiscal year 2022-23, Hetch Hetchy Power purchased
distribution services for $29.0 million from PG&E under the terms of the service agreements and
Interconnection Agreements that implement the WDT. The City continues to litigate and dispute these
terms at FERC and in the court systems; and pursue the purchase of PG&E’s electric grid in San
Francisco.
Hetchy Power may purchase or sell energy and other related products (such as ancillary services,
spinning reserves, resource adequacy products, and congestion revenue rights) with different market
entities through the Western System Power Pool (WSPP) and the CAISO. During fiscal year 2022-23,
Hetchy Power purchased
$3.7 million of power and other related products. There was $1.2 million or
155,000 MWh of excess power sales after meeting Hetch Hetchy’s obligations in fiscal year 2022-23.
Hetchy Power (Buyer) purchases energy, capacity, and environmental attributes from a solar
photovoltaic project located at Sunset Reservoir (the facility) pursuant to the 2009 25-year Power
Purchase Agreement (PPA) with SFCity1, LP, owned by Duke Energy (Seller). In November 2010, the
facility commenced commercial operation and began to provide Hetchy Power energy generated by
the facility. The PPA sets the purchase price of generated energy at $235/MWh, increased by 3.0%
each year throughout the term of the agreement, and it is expected that the facility will generate 6,560
MWh per year. In fiscal year 2022-23, the facility generated 6,006 MWh and rate was at $344/MWh.
In the event that the facility generates more energy than expected due to better than normal
meteorological conditions, the PPA requires the Buyer to purchase all the excess energy but generation
in excess of 120.0% of expected is purchased at no cost. The PPA also requires the Seller to generate
a minimum amount of energy from the facility annually. If energy production falls below 50% of
expected, the Seller must provide replacement power, and if energy falls below 90% of expected, the
price for energy generated is lowered. In fiscal year 2022-23, purchases of energy under the PPA were
$2.0 million or 6,006 MWh.
Hetchy Power and CleanPowerSF participate in the CAISO energy markets which requires the SFPUC
to have a contract with a certified Scheduling Coordinator (SC). In June 2022, CleanPowerSF renewed
a 5-year contract with APX, Inc with contract amount not to exceed $134.7 million to fulfill this
requirement. APX, Inc provides a number of services including but not limited to an interface with the
CAISO’s energy scheduling portal, manage invoice payments to the CAISO and communications
between the CAISO and the SFPUC, and dispatch of the Hetch Hetchy plant 24 hours a day, seven
days a week. The contract also provides that APX, Inc will act as the SC for renewable generation
plants under some of CleanPowerSF’s Power Purchase Agreements. Hetchy Power’s share was $0.5
million as of June 30, 2023. CleanPowerSF’s share was $0.2 million June 30, 2023.
On January 6, 2023, Amendment No. 1 was requested and approved to increase this contact by $125.0
million, increasing the total contract to $259.7 million, with no change to the agreement duration. On
March 17, 2023, Amendment No. 2, was approved to increase the contract by $636.0 million for a total
not to exceed contract amount of $895.7 million, with no change to the agreement duration. The drivers
for these Amendments were higher than anticipated power prices, due to extreme weather, draught
conditions, and global energy shortages.
CleanPowerSF
CleanPowerSF regularly adds new short-term and medium-term contracts with multiple counterparties
pursuant to master agreements, including the WSPP Master Agreement, to purchase renewable,
carbon-free and conventional energy and resource adequacy capacity. CleanPowerSF has also
entered into long-term contracts for renewable energy and capacity with renewable energy developers
including sPower, Terra-Gen, NextEra, Intersect Power and EDF Renewables. These contracts have
CITY AND COUNTY OF SAN FRANCISCO
Notes to Basic Financial Statements (Continued)
June 30, 2023
(Dollars in Thousands)
159
been entered to allow CleanPowerSF to meet its existing retail sales obligations, to support future retail
sales from anticipated load growth, and to comply with State requirement that 65% of CleanPowerSF’s
Renewables Portfolio Standard (RPS) compliance targets be fulfilled by RPS-eligible electricity from
contracts of 10 or more years. Citywide enrollment was completed in 2020. Since it began serving
customers in 2016, CleanPowerSF’s cumulative opt-out rate is 4.4% of all enrolled accounts. The total
power purchase cost, net of wholesale sales, was $259.5 million in fiscal year 2022-23.
CleanPowerSF contracts with Calpine Energy Solutions to provide meter data management, billing and
customer care support. Calpine is responsible for calculating and providing CleanPowerSF charges to
PG&E, which in turn bills both CleanPowerSF and PG&E customers for electricity transmission,
distribution, and CleanPowerSF generation services. PG&E remits payments received from customers
for CleanPowerSF charges to the City. During fiscal year 2022-23, amount paid was $4.7 million.
In November 2020, CleanPowerSF executed a Power and Storage Purchase Agreement to purchase
solar product and storage product from a solar powered generation facility and battery storage facility
located at Livermore pursuant to the 25-year PPA with IP Aramis, LLC (Seller). As of June 30, 2022,
CleanPowerSF received cash collateral of $9.0 million for Development Assurance and Performance
Assurance from the Seller. The $9.0 million cash collateral was returned to the seller as of June 30,
2023.
In March 2018, CleanPowerSF entered into a five-year, $75.0 million Credit Agreement with JPMorgan
Chase Bank, National Association (Bank) to provide letters of credit or loans from the Bank to guarantee
certain power purchase agreement payment obligations of CleanPowerSF and to meet working capital
needs, if necessary. In November 2021, the Credit Agreement decreased the available amount from
$75.0 million to $20.0 million, and the stated term of the agreement was extended to March 2024.
Additional changes to the agreement effected by the November 2021 Amendments include elimination
of target reserve requirements, revisions to debt service coverage (allowing for a liquidity test two times
in the aggregate for any consecutive four quarters) and rate-setting covenants, changes to ongoing
reporting requirements to the Bank, and changes to events of default, including the addition of an event
of default if CleanPowerSF’s long-term unenhanced credit rating is downgraded below investment
grade or suspended, withdrawn or otherwise unavailable. In May 2022, CleanPowerSF executed
another amendment to its Credit Agreement to eliminate and change certain financial covenants
contained in the 2018 Credit Agreement. Specifically, this Amendment eliminated the covenant of the
Commission to maintain a specified debt service coverage ratio and changed such financial covenant
to commit the Commission to maintain a specified level of Day Liquidity on Hand (as defined in the
Credit Agreement). The Credit Agreement is secured by CleanPowerSF’s net revenues; there is no
pledge of, or lien on net revenues that ranks senior to the obligations under the Credit Agreement. The
Bank issued letters of credit in the face amounts totaling $6.2 million for fiscal year ended June 30,
2023. CleanPowerSF did not draw on the Credit Agreement during fiscal year 2022-23. Accordingly,
the uncommitted credit capacity under the Credit Agreement was $13.8 million during fiscal year 2022-
23.
Original financial covenants include that CleanPowerSF maintain a Debt Service Coverage Ratio as
defined in the Credit Agreement of not less than 1.05 for each fiscal quarter, as determined for the four
consecutive fiscal quarter periods ended on the last day of such fiscal quarter. CleanPowerSF was in
compliance with all covenants and requirements of the Credit Agreement as amended as of June 30,
2023.
Significant events of default under the Credit Agreement, include 1) non-payment, 2) material breach
of warranty, representation, or other non-remedied breach of covenants as specified in the agreement
and 3) bankruptcy and insolvency events, which could result in all outstanding loans under the Credit
Agreement to be immediately due and payable; or the immediate termination of the Bank’s commitment
to issue letters of credit or make loans under the Credit Agreement.
In June 2018. the CPUC established the Disadvantaged Communities-Green Tariff (DAC-GT) and
Community Solar Green Tariff (CSGT) program to address barriers to solar adoption faced by low-
CITY AND COUNTY OF SAN FRANCISCO
Notes to Basic Financial Statements (Continued)
June 30, 2023
(Dollars in Thousands)
160
income electric customers in neglected communities. The DAC-GT program provides a 20% rate
discount on 100% RPS eligible electricity service to income-qualified customers residing in
Disadvantaged Communities (DACs) as defined by the California Environmental Protection Agency’s
(Cal EPA). Similar to DAC-GT, the CSGT program allows primarily for the DACs to benefit from the
development of solar generation projects located in their own or nearby DACs. CSGT projects must
also have a local community-based sponsor that supports site selection and customer enrollment.
The CPUC approved CleanPowerSF’s application to establish DAC-GT and CSGT programs in April
2021 and to receive funds to cover program administration and a portion of electricity supply costs.
CleanPowerSF began enrolling customers in the DAC-GT program branded as “SuperGreen Saver”
on June 1, 2022. The CSGT program is expected to start serving customers during fiscal year 2025-26,
once CleanPowerSF is able to procure electricity from a CSGT-eligible solar project(s). As of June 30,
2023, CleanPowerSF received $0.9 million from a combination of ratepayer funds and California Cap
and Trade Auction proceeds.
Transactions with Other Funds – The Water Enterprise purchases water from Hetch Hetchy Water
and power from Hetch Hetchy Power. Included in the operating revenues are the water assessment
fees totaling $49.6 million and purchased electricity for $11.4 million for the year ended June 30, 2023.
The water assessment fees represent a recovery to fund upcountry, water related costs that are not
otherwise funded through water-related revenue. During fiscal year 2022-23, $49.6 million of the water
assessment fees were received from the Water Enterprise. In addition, the Wastewater Enterprise
purchases power from Hetch Hetchy Power totaling $14.9 million for the year ended June 30, 2023.
Included in 2023 operating revenues are sales of power to departments within the City of $121.0 million.
A variety of other City departments provide services such as engineering, purchasing, legal, data
processing, telecommunications, and human resources to Hetch Hetchy and charge amounts designed
to recover those departments’ costs. These charges total approximately $16.4 million for the year ended
June 30, 2023 and have been included in services provided by other departments.
For the year ended June 30, 2023, operating expenses include purchase of power from Hetchy Power
were $5.8 million.
CleanPowerSF received program support services from Hetchy Power. This amount totaled $2.9 million
for the year ended June 30, 2023.
(e) San Francisco Municipal Transportation Agency
The San Francisco Municipal Transportation Agency (SFMTA) is governed by the SFMTA Board of
Directors, who are appointed by the Mayor and Board of Supervisors. The SFMTA’s financial
statements include the entire City’s surface transportation network that encompasses pedestrians,
bicycling, transit (Muni), traffic and on- and off-street parking, regulation of the taxi industry, and two
nonprofit parking garage corporations operated by separate nonprofit corporations whose operations
are interrelated.
The SFMTA was established by voter approval of the addition of Article VIIIA to the Charter of the City
(the Charter) in 1999 (Proposition E). The purpose of the Charter amendment was to consolidate all
surface transportation functions within a single City department and to provide the transportation
system with the resources, independence, and focus necessary to improve transit service and the City’s
transportation system. The voters approved additional Charter amendments: (1) in 2007
(Proposition A), which increased the autonomy of and revenue to the SFMTA; (2) in 2010
(Proposition G), which increased management flexibility related to labor contracts; (3) in 2014
(Proposition A), which provided $500 million in general obligation bonds for transportation and street
infrastructure; (4) in 2014 (Proposition B), which increases General Fund allocation to SFMTA based
on the City’s population increase; and (5) in 2019 (Proposition D), which imposes tax on fares charged
by commercial shared and private rides to fund transportation operations and infrastructure for traffic
congestion mitigation in the City.
CITY AND COUNTY OF SAN FRANCISCO
Notes to Basic Financial Statements (Continued)
June 30, 2023
(Dollars in Thousands)
161
Muni is one of America’s oldest public transit agencies, the largest in the Bay Area, and eighth largest
system in the United States. Operating historic streetcars, modern light rail vehicles, diesel buses,
alternative fuel vehicles, electric trolley coaches, and the world-famous cable cars, Muni’s fleet is
among the most diverse in the world.
The SFMTA’s Sustainable Streets initiates and coordinates improvements to the City’s streets, transit,
bicycles, pedestrians, and parking infrastructure. It manages 21 City-owned garages and 18 metered
parking lots.
Nonprofit corporations provide operational oversight to two garages, namely Japan Center Garage
Corporation (Japan Center) and Portsmouth Plaza Parking Corporation (Portsmouth). Of these two
garages, Portsmouth garage is owned by the Recreation and Park Department but managed by the
SFMTA. The SFMTA approves and oversees the budget and capital improvements and as authorized
by the City Charter, set the parking rates in garages under SFMTA’s jurisdiction including the two
parking garages. The financial statements of these nonprofit garages, which are audited by other
auditors, are provided to the SFMTA and accounted for in the parking garages account. The nonprofit
corporations’ annual financial statements are publicly available.
Pledged Revenue – In 2007, San Francisco voters approved Proposition A, which authorized the
SFMTA to issue revenue bonds and other forms of indebtedness without further voter approval but with
approval by the SFMTA Board of Directors and concurrence by the Board of Supervisors. The SFMTA
has pledged future revenues to repay various bonds. Proceeds from the revenue bonds provided
financing for various capital construction projects and refunded previously issued bonds. These bonds
are payable from all SFMTA operating revenues except for City General Fund allocations and restricted
sources and are payable through fiscal year 2050-51.
Annual principal and interest payments for fiscal year 2022-23 were 62.4% of funds available for
revenue bond debt service. The original amount of revenue bonds issued, total principal and interest
remaining, principal and interest paid during fiscal year 2022-23, applicable net revenues, and funds
available for bond debt service are as follows:
Bonds issued with revenue pledge .......................................................................... $ 457,065
Principal and interest remaining due at end of the year .......................................... 670,657
Principal and interest paid during the year............................................................... 22,838
Net revenues for the year......................................................................................... 13,744
Funds available for revenue bond debt service ....................................................... 36,582
Operating and Capital Grants and Subsidies – The amount of operating allocation provided to the
SFMTA each year is limited to the amount set by the City Charter and budgeted by the City. Such
allocation is recognized as revenue in the year received. The amount of General Fund subsidy to the
SFMTA reflected in the accompanying financial statements was $556.4 million in fiscal year 2022-23.
The General Fund support from the City includes total revenue baseline transfer of $427.1 million and
$66.2 million allocation in lieu of parking tax. Proposition B, approved by the voters in November 2014,
provides additional City General Fund subsidy to address transportation needs tied to the City’s
population growth. The SFMTA received $58.0 million from this source, of which $30.0 million was
allocated for operations and $28.0 million for capital projects. The SFMTA also received an additional
General Fund allocation of $4.8 million for the Chase Event Center and mixed-use development project
and $0.3 million for the Community Building Program.
The SFMTA also receives operating assistance from various federal, State, and local sources, including
Transit Development Act funds, diesel fuel, and sales tax allocations. As of June 30, 2023, the SFMTA
had various operating grants receivable of $20.2 million. The SFMTA received operating assistance
from BART’s Americans with Disability Act related support of $1.9 million, and other federal, State, and
local grants of $4.7 million, to fund project expenses that are operating in nature.
CITY AND COUNTY OF SAN FRANCISCO
Notes to Basic Financial Statements (Continued)
June 30, 2023
(Dollars in Thousands)
162
The operating assistance from federal sources includes funds received from FTA in response to the
COVID-19 pandemic. The American Rescue Plan Act (ARPA) was signed into law on March 11, 2021,
which provided the SFMTA with supplemental appropriation for emergency transit operations. The
SFMTA received $138.1 million in fiscal year 2022-23 while $339.5 million remains to be accessed in
fiscal year 2023-24.
Proposition 1B is a $20 billion transportation infrastructure bond that was approved by State voters in
November 2006. The bond measure is composed of several funding programs including the Public
Transportation Modernization, Improvement, and Service Enhancement Account (PTMISEA) Program.
The original legislation required funds to be obligated within three years of the date awarded. The
Budget Act of 2019 reappropriated the remaining balances of PTMISEA appropriations, which are
available for encumbrance and liquidation until June 30, 2023. PTMISEA funds may be used for transit
rehabilitation, safety or modernization improvements, capital service enhancements or expansions,
new capital projects, bus rapid transit improvements, bus and rail car procurement, rehabilitation, or
replacement. The SFMTA did not receive cash in the fiscal year 2022-23 from PTMISEA. During fiscal
year 2022-23, drawdowns for various eligible projects costs were made from PTMISEA funds for
$11.9 million. All PTMISEA appropriations other than interest earned were fully spent during the year.
Commitments and Contingencies
(i) Grants and Subventions
Receipts from federal and state grants and other similar programs are subject to audit to determine
if the funds were expended in accordance with appropriate statutes, grant terms, and regulations.
The SFMTA believes that no significant liabilities will result from any such audits.
(ii) Other Commitments
As of June 30, 2023, the SFMTA has outstanding commitments of approximately $353.0 million
with third parties for various capital projects. Grant funding is available for the majority of this
amount. The SFMTA also has outstanding commitments of approximately $75.0 million with third
parties for noncapital expenditures. Various local funding sources are used to finance these
expenditures.
In addition, the SFMTA is involved in various lawsuits, claims, and disputes that have arisen in
SFMTA’s routine conduct of business. In the opinion of management, the outcome of any litigation
of these matters will not have a material effect on the financial position or changes in net position
of the SFMTA.
(f) Laguna Honda Hospital
General Fund Subsidy - The Laguna Honda Hospital (LHH) is a skilled nursing facility which
specializes in serving elderly and disabled residents. The operations of LHH are subsidized by the
City’s General Fund. It is the City’s policy to fund operating deficits of the enterprise on a budgetary
basis; however, the amount of operating subsidy provided is limited to the amount budgeted by the
City. Any amount not required for the purpose of meeting an enterprise fund deficit shall be transferred
back to the General Fund at the end of each fiscal year, unless otherwise approved by the Board of
Supervisors. For the year ended June 30, 2023, the subsidy for LHH was $94.9 million.
Net Patient Services Revenue - Net patient services revenues are recorded at the estimated net
realizable amounts from patients, third-party payors and others for services rendered, including a
provision for doubtful accounts and estimated retroactive adjustments under reimbursement
agreements with federal and State government programs and other third-party payors. Retroactive
adjustments are accrued on an estimated basis in the period the related services are rendered and
adjusted in future periods, as final settlements are determined. Patient accounts receivable are
recorded net of estimated allowances, which include allowances for contractuals and bad debt. These

CITY AND COUNTY OF SAN FRANCISCO
Notes to Basic Financial Statements (Continued)
June 30, 2023
(Dollars in Thousands)
163
allowances are based on current payment rates, including per diems, Diagnosis-Related Group (DRG)
reimbursement amounts and payment received as a percentage of gross charges.
Third-Party Payor Agreements - LHH has agreements with third-party payors that provide for
reimbursement to LHH at amounts different from its established rates. Contractual adjustments under
third-party reimbursement programs represent the difference between the hospital’s established rate
for services and amounts reimbursed by third-party payors. Medicare and Medi-Cal are the major third-
party payors with whom such agreements have been established. Laws and regulations governing the
Medicare and Medi-Cal programs are complex and subject to interpretation. LHH believes that it is in
compliance with all applicable laws and regulations and is not aware of any pending or threatened
investigations involving allegations of potential wrongdoing. While no such regulatory inquiries have
been made, compliance with such laws and regulations can be subject to future government review
and interpretation as well as significant regulatory action including fines, penalties and exclusion from
the Medicare and Medi-Cal programs.
During the year ended June 30, 2023, LHH’s patient receivables and charges for services were as
follows:
Because Medi-Cal reimbursement rates are less that LHH’s established charges rates, LHH is eligible
to receive supplemental federal funding. For the year ended June 30, 2023, LHH accrued and
recognized $58.4 million of revenue as a result of matching federal funds to local funds.
Medi-Cal Medicare Other Total
Gross Accounts Receivable............................ 71,943$ 5,623$ (28)$ 77,538$
Less:
Contractual Allowance............................. (48,690) (3,806) 19 (52,477)
Total, Net Accounts Receivable....................... 23,253$ 1,817$ (9)$ 25,061$
Medi-Cal Medicare Other Total
Gross Patient Service Revenue....................... 406,966$ 26,748$ (132)$ 433,582$
Less:
Contractual Allowance............................. (192,108) (20,968) (914) (213,990)
Total, Net Patient Service Revenue.................. 214,858$ 5,780$ (1,046)$ 219,592$
Patient Receivables, Net
Net Patient Service Revenue
CITY AND COUNTY OF SAN FRANCISCO
Notes to Basic Financial Statements (Continued)
June 30, 2023
(Dollars in Thousands)
164
Unearned Credits and Other Liabilities - As of June 30, 2023, LHH recorded approximately $52.8
million in other liabilities for third-party payor payable.
Transactions with Other Funds – A variety of other City departments provide services such as
engineering, purchasing, legal, data processing, telecommunications, human resources, and public
protection to LHH and charge amounts designed to recover those departments’ costs. These charges
totaled $17.9 million for the year ended June 30, 2023 and have been included in services provided by
other departments.
As of June 30, 2023, LHH has entered into various purchase contracts totaling $52.5 million that are
related to the old building remodel.
(g) San Francisco General Hospital
General Fund Subsidy - San Francisco General Hospital Medical Center (SFGH) is an acute care
hospital. The operations of SFGH are subsidized by the City's General Fund. It is the City's policy to
fully fund enterprise operations on a budgetary basis; however, the amount of operating subsidy
provided is limited to the amount budgeted by the City. Any amount not required for the purpose of
meeting an enterprise fund deficit shall be transferred back to the General Fund at the end of each
fiscal year, unless otherwise approved by the Board of Supervisors. For the year ended June 30, 2023,
the subsidy for SFGH was $137.4 million.
Net Patient Service Revenue - Net patient service revenues are recorded at the estimated net
realizable amounts from patients, third-party payors and others for services rendered, including a
provision for doubtful accounts and estimated retroactive adjustments under reimbursement
agreements with federal and State government programs and other third-party payors. Retroactive
adjustments are accrued on an estimated basis in the period the related services are rendered and
adjusted in future periods, as final settlements are determined.
Patient accounts receivable are recorded net of estimated allowances, which include allowances for
contractuals, bad debt, and administrative write-offs. These allowances are based on current payment
rates, including per diems, DRG amounts and payments received as a percentage of gross charges.
Third-Party Payor Agreements - SFGH has agreements with third-party payors that provide for
reimbursement to SFGH at amounts different from its established rates. Contractual adjustments under
third-party reimbursement programs represent the difference between SFGH established rates and
amounts reimbursed by third-party payors. Major third-party payors with whom such agreements have
been established are Medicare, Medi-Cal, and the State of California through the Section 1115
Medicaid Waiver and Short-Doyle mental health programs. Laws and regulations governing the
Medicare and Medi-Cal programs are complex and subject to interpretation. SFGH believes that it is in
compliance with all applicable laws and regulations and is not aware of any pending or threatened
investigation involving allegations of potential wrongdoing. While no such regulatory inquiries have
been made, compliance with such laws and regulations can be subject to future government review
and interpretation as well as significant regulatory action including fines, penalties and exclusion from
the Medicare and Medi-Cal programs.

CITY AND COUNTY OF SAN FRANCISCO
Notes to Basic Financial Statements (Continued)
June 30, 2023
(Dollars in Thousands)
165
During the year ended June 30, 2023, SFGH's patient receivables and charges for services were as
follows:
California's Section 1115 Medicaid Waiver (Waiver), titled "Medi-Cal 2020" expired on December 31,
2021. Medi-Cal 2020 was replaced by a new Waiver entitled “CalAIM”, California’s “…long-term
commitment to transform and strengthen Medi-Cal, offering Californians a more equitable, coordinated,
and person-centered approach to maximizing their health and life trajectory”.
In addition to fee-for-service cost-based reimbursements for inpatient hospital services, CalAIM
includes a wide range of patient centered care programs, including Enhanced Care Management,
Community Supports, and the renewal of the Global Payment Program (GPP) among other service
delivery and payment reform initiatives.
Payments received under CalAIM’s GPP are utilization based and not dependent on Certified Public
Expenditures (CPEs). However, GPP claims are subject to State and federal audit and final
reconciliation. SFGH has established reserves for the uncertainty of future financial impact of potential
audit and reconciliation adjustments.
Revenues recognized under current and previous Medi-Cal Waivers is approximately $87.4 million for
the year ended June 30, 2023.
In addition, SFGH is reimbursed by the State of California, under the Short-Doyle Program, for mental
health services provided to qualifying residents based on an established rate per unit of service not to
exceed an annual negotiated contract amount. During the year ended June 30, 2023, reimbursement
under the Short-Doyle Program amounted to approximately $6.4 million and is included in net patient
service revenue.
Unearned Revenues and Other Liabilities - As of June 30, 2023, SFGH recorded approximately
$312.3 million in unearned credits and other liabilities, which was comprised of $239.2 million in
unearned credits mainly related to receipts under DSH/Safety Net Care Pool, the Medicare Accelerated
payment program and AB915 programs, and $71.9 million in Third Party Settlements payable.
Medi-Cal Medicare Other Total
Gross Accounts Receivable............................ 301,645$ 192,116$ 112,401$ 606,162$
Less:
Provision for Contractual Allowances......... (266,716) (171,152) (72,728) (510,596)
Provision for Bad Debts............................ - - (13,317) (13,317)
Total, Net Accounts Receivable....................... 34,929$ 20,964$ 26,356$ 82,249$
Medi-Cal Medicare Other Total
Gross Patient Service Revenue....................... 2,197,579$ 1,202,046$ 971,995$ 4,371,620$
Less:
Provision for Contractual Allowances......... (1,847,279) (977,041) (487,211) (3,311,531)
Provision for Bad Debts............................ - - (84,414) (84,414)
Total, Net Patient Service Revenue.................. 350,300$ 225,005$ 400,370$ 975,675$
Patient Receivables, Net
Net Patient Service Revenue
CITY AND COUNTY OF SAN FRANCISCO
Notes to Basic Financial Statements (Continued)
June 30, 2023
(Dollars in Thousands)
166
Charity Care - SFGH provides care without charge or at amounts less than its established rates to
patients who meet certain criteria under its charity care policy. Charges foregone based on established
rates were $287.9 million and estimated costs and expenses to provide charity care were $74.3 million
in fiscal year 2022-23.
Other Nonoperating Revenues - SFGH recognized $67.9 million of realignment funding for the year
ended June 30, 2023.
With California electing to implement a state-run Medicaid Expansion afforded by the Affordable Care
Act, the State anticipates that counties’ costs and responsibilities for the health care services for the
indigent population will decrease as much of the population becomes eligible for coverage through
Medi-Cal or Covered California. Starting July 1, 2013, there is a mechanism that provides for the State
to redirect health realignment funds to fund social service programs. The redirected amount will be
determined according to a formula that takes into account a county's cost and revenue experience and
redirects 80% of the savings realized by the county. The State predetermined an amount of health
realignment to be redirected for the City and County of San Francisco and withheld those amounts from
health realignment remittances to the City. $0 was withheld in fiscal year 2020-21 and a final
reconciliation has been conducted for fiscal year 2020-21 showing $0 realignment to be redirected. A
final reconciliation will be conducted prior to June 30, 2024 for fiscal year 2021-22.
Contract with the University of California San Francisco - The City contracts on a year-to-year
basis on behalf of SFGH with the University of California (UC). Under the contract, SFGH serves as a
teaching facility for UC professional staff, medical students, residents, and interns who, in return,
provide medical and surgical specialty services to SFGH's patients. The total amount for services
rendered under the contract for the year ended June 30, 2023, was approximately $247.2 million.
SFGH Rebuild - The Rebuild projects have been completed and the General Obligation Bonds are
accounted for as governmental activity and transactions are accounted for in the City’s Governmental
Capital Project Funds.
Gift - From fiscal year 2014-15 through fiscal year 2015-16, SFGH received $62.4 million from the San
Francisco General Hospital Foundation for the acquisition of furniture, fixtures and equipment (FF&E)
for the new hospital. As of June 30, 2023, SFGH has spent $49.2 million from the gift on acquisition of
FF&E as stipulated by the donor and recorded the remaining $13.2 million as Restricted Net Position.
Commitments and Contingencies - As of June 30, 2023, SFGH had outstanding commitments with
third parties for capital projects totaling $13.4 million.
(h) San Francisco Wastewater Enterprise
The San Francisco Wastewater Enterprise (Wastewater Enterprise) was established in 1977, following
the transfer of all sewage-system-related assets and liabilities of the City to the Wastewater Enterprise
pursuant to bond resolution, to account for the City’s municipal sewage treatment and disposal system.
The Wastewater Enterprise collects, transmits, treats, and discharges sanitary and stormwater flows,
generated within the City, for the protection of public health and environmental safety. In addition, the
Wastewater Enterprise serves, on a contractual basis, certain municipal customers located outside of
the City limits, including the North San Mateo County Sanitation District No. 3, Bayshore Sanitary
District, and the City of Brisbane. The Wastewater Enterprise recovers cost of service through user
fees based on the volume and strength of sanitary flow. As of June 30, 2023, the Wastewater Enterprise
serves approximately 148,598 residential accounts, which discharge about 15.4 million units of sanitary
flow per year (measured in hundreds of cubic feet, or ccf) and approximately 27,082 non-residential
accounts, which discharge about 5.6 million units of sanitary flow per year.
CITY AND COUNTY OF SAN FRANCISCO
Notes to Basic Financial Statements (Continued)
June 30, 2023
(Dollars in Thousands)
167
Pledged Revenues – Wastewater Enterprise’s revenues, which consist mainly of sewer service
charges, are pledged for the payment of principal and interest on various revenue bonds, revenue
notes, State Revolving Fund (SRF) loans, and Water Infrastructure Finance and Innovation Act (WIFIA)
loans. Proceeds from the bonds, notes, SRF, and WIFIA loans provided financing for various capital
construction projects and to refund previously issued bonds. These bonds, notes, SRF, and WIFIA
loans are payable solely from net revenues of Wastewater Enterprise and are payable through fiscal
years ending June 30, 2052, 2027, 2056, and 2059, respectively.
The original amount of revenue bonds issued, notes issued, State Revolving Fund loans, and WIFIA
loans, total principal and interest remaining, principal and interest paid during fiscal year 2022-23
applicable net revenues, and funds available for bond debt service are as follows:
Bonds issued with revenue pledge ................................................................................ $ 3,029,385
Notes issued with revenue pledge .................................................................................. 347,465
Clean Water State Revolving Fund (CWSRF) loans with revenue pledge .................... 328,776
WIFIA loans with revenue pledge ................................................................................... 122,357
Principal and interest remaining due at end of the fiscal year ....................................... 4,872,238
Principal and interest paid in the fiscal year ................................................................... 98,811
Net revenues .................................................................................................................. 178,850
Funds available for revenue bond and loans debt service ............................................. 313,443
Commitments and Contingencies – As of June 30, 2023, the Wastewater Enterprise had outstanding
commitments, with third parties, for capital projects and for materials and services totaling $762.1
million.
Pollution Remediation Obligations – As of June 30, 2023, the Wastewater Enterprise recorded $7.8
million in pollution remediation liability, consisting of $7.8 million cleanup cost estimate at the Yosemite
Creek site. The pollution remediation obligation reported in the accompanying statement of net position
is based on estimated contractual costs.
Transactions with Other Funds – The Wastewater Enterprise purchased power from Hetch Hetchy
Power totaling $14.9 million for the year ended June 30, 2023. The Wastewater Enterprise purchased
water from Water Enterprise totaling $1.6 million for the year ended June 30, 2023. The Department of
Public Works provides certain engineering and other services to the Wastewater Enterprise and the
total charge was $9.2 million for the year ended June 30, 2023. A variety of other City departments
provide services such as engineering, purchasing, legal, data processing, telecommunications, and
human resources to the Wastewater Enterprise and charge amounts designed to recover those
departments’ costs. These charges total approximately $15.4 million for the year ended June 30, 2023
and have been included in services provided by other departments.

CITY AND COUNTY OF SAN FRANCISCO
Notes to Basic Financial Statements (Continued)
June 30, 2023
(Dollars in Thousands)
168
(14) SUCCESSOR AGENCY TO THE REDEVELOPMENT AGENCY OF THE CITY AND COUNTY OF SAN FRANCISCO
As discussed in Note 1, the financial statements present the Successor Agency and its component unit,
an entity for which the Successor Agency is considered to be financially accountable. The City and
County of San Francisco Redevelopment Financing Authority (Financing Authority) is a joint powers
authority formed between the former Agency and the City to facilitate the long-term financing of the
former Agency’s activities. The Financing Authority is included as a blended component unit in the
Successor Agency’s financial statements because the Financing Authority provides services entirely to
the Successor Agency.
Pursuant to the Dissolution Law, funds that would have been distributed to the former Agency as tax
increment, hereafter referred to as redevelopment property tax revenues, are deposited into the
Successor Agency’s Redevelopment Property Tax Trust Fund (Trust Fund) administered by the City’s
Controller for the benefit of holders of the former Agency’s enforceable obligations and the taxing
entities that receive pass-through payments. Any remaining funds in the Trust Fund, plus any
unencumbered redevelopment cash and funds from asset sales are distributed by the City to the local
agencies in the project area unless needed to pay enforceable obligations.
In September 2015, the State passed Senate Bill 107 (SB 107), which clarifies and updates existing
law governing the dissolution of redevelopment agencies. SB 107 includes specific language that
allows the Successor Agency to issue bonds or other indebtedness for the purposes of low and
moderate income housing and infrastructure in the City by allowing the pledge of revenues available in
the Trust Fund that are not otherwise pledged subject to the approval of the Oversight Board. SB 107
also declares that Mission Bay North, Mission Bay South, Hunters Point Shipyard Phase 1, Candlestick
Point - Hunters Point Shipyard Phase 2, and Transbay projects are finally and conclusively approved
as enforceable obligations.
(a) Summary of the Successor Agency’s Long-Term Obligations
Debt service payments are made from the following sources:
(a) Hotel occupancy tax revenues from the occupancy of guest rooms in the hotels within the City.
(b) Redevelopment property tax revenues from the Bayview Hunters Point, Western Addition, Rincon
Point South Beach, Yerba Buena Center, India Basin, South of Market, Golden Gateway, Mission
Bay South, Transbay, and Mission Bay North project areas.
Final
Maturity Remaining
Type of Obligation Date Interest Rate Amount
Hotel tax revenue bonds
(a)
…………………………………………………
2025 8,675$
Tax allocation revenue bonds
(b)
……………………………………………………..
2047 1.01%
-
8.41% 757,038
Total long-term bonds……………………..……………………..
765,713$
5.00%
CITY AND COUNTY OF SAN FRANCISCO
Notes to Basic Financial Statements (Continued)
June 30, 2023
(Dollars in Thousands)
169
Issuance of Successor Agency Bonds – Under the Dissolution Law, a successor agency is
authorized to issue bonds to satisfy its obligations under certain enforceable obligations entered into
by the former redevelopment agency prior to dissolution, subject to approval by the California
Department of Finance (DOF). On December 24, 2013, the DOF released its letter approving the
issuance of bonds by the Successor Agency.
Pledged Revenues for Bonds – The Tax Allocation Bonds are equally and ratably secured by the
pledge and lien of the redevelopment property tax revenues (i.e., the former tax increment). These
revenues have been pledged until the year 2047, the final maturity date of the bonds. The total principal
and interest remaining on these bonds is approximately $1.23 billion. The redevelopment property tax
revenues recognized during the year ended June 30, 2023, were $122.6 million against the total debt
service payment of $94.5 million.
The Hotel Tax Revenue Bonds are secured by the pledge and lien of the hotel tax revenue received by
the Successor Agency from the City. These revenues have been pledged until the year 2025, the final
maturity of the bonds. The total principal and interest remaining on the Hotel Tax Revenue Bonds is
approximately $9.3 million. The hotel tax revenue recognized during the year ended June 30, 2023,
was $4.5 million against the total debt service payment of $4.5 million.
Events of Default and Remedies – The Successor Agency shall be considered to be in default if it
fails to make any principal, interest, or redemption payment when due. For Tax Allocation Bonds, in the
event of default, the trustee may declare the principal and accrued interest to be due and payable
immediately. For Hotel Tax Bonds, in the event of default, the Successor Agency must immediately
transfer to the trustee all revenues held and thereafter received to be used for expenses necessary to
protect the bondholders and payment of interest and principal.
The changes in long-term obligations for the Successor Agency for the year ended June 30, 2023, are
as follows:
(1)
Amounts represent interest accretion on Capital Appreciation Bonds.
Additional
Obligations, Current
Interest Maturities,
Accretion Retirements,
July 1, and Net and Net June 30,
2022 Increases Decreases 2023
Bonds payable:
Tax revenue bonds ..................................…………....................................
806,046$ -$ (49,008)$ 757,038$
Hotel Tax Revenue Bonds…............................
12,540 - (3,865) 8,675
Less unamortized amounts:
For issuance premiums .....................................................................…………………………………
37,887 - (2,313) 35,574
For issuance discounts .....................................................................…………………………………
(2,521) - 142 (2,379)
Total bonds payable .........................................……………......…………………….
853,952 - (55,044) 798,908
Accreted interest payable……………………………………………...…….…….
80,746 8,653 (13,791) 75,608
(1)
Accrued vacation and sick leave pay……………………
1,842 940 (739) 2,043
Successor Agency - long-term obligations……………………
936,540$ 9,593$ (69,574)$ 876,559$

CITY AND COUNTY OF SAN FRANCISCO
Notes to Basic Financial Statements (Continued)
June 30, 2023
(Dollars in Thousands)
170
As of June 30, 2023, the debt service requirements to maturity for the Successor Agency, excluding
accrued vacation and sick leave, are as follows:
During the year ended June 30, 2010, the former Agency borrowed $16.5 million from the Low and
Moderate Income Housing Fund (LMIHF) to make a payment of $28.7 million to the Supplemental
Education Revenue Augmentation Funds (SERAF) to meet the State’s Proposition 98 obligations to
schools. Upon dissolution of the former Agency, the City elected to become the Housing Successor
Agency and retained the former Agency’s housing assets and functions, rights, powers, duties, and
obligations. The Successor Agency made payments in the amount of $1.1 million to the City during the
year ended June 30, 2023 to fully pay off the outstanding payable balance.
(b) Commitments and Contingencies Related to the Successor Agency
Encumbrances - At June 30, 2023, the Successor Agency had outstanding encumbrances totaling
approximately $7.2 million.
Risk Management - The Successor Agency obtained coverage for personal injury, automobile liability,
public official errors and omissions and employment practices liability with limits of $10.0 million per
occurrence ($5.0 million per occurrence for automobile liability and an annual aggregate limit of $5.0
million for employment practices liability) and a $25 deductible.
Notes and Mortgages Receivable – During the process of selling land to developers and issuing
mortgage revenue bonds, the Successor Agency may defer receipt of land sale proceeds and mortgage
revenue bond financing fees from various private developers in exchange for notes receivable, which
aid the developers’ financing arrangements. The Successor Agency recognizes all revenues and
interest on the above-described arrangements when earned, net of any amounts deemed to be
uncollectible. During the year ended June 30, 2023, the Successor Agency disbursed $37.1 million to
the developers through this arrangement and recorded an allowance against these receivables. At June
30, 2023, the gross value of the notes and mortgage receivable was $220.9 million and the allowance
for uncollectible amounts was $219.4 million.
June 30, Principal Interest * Principal Interest
2024 33,464$ 46,113$ 4,220$ 434$
2025 36,896 45,784 4,455 223
2026 41,859 34,102 - -
2027 42,547 32,850 - -
2028 43,625 31,749
2029-2033 240,136 135,895 - -
2034-2038 156,917 92,080 - -
2039-2043 116,144 42,394 - -
2044-2047 45,450 7,548 - -
Total 757,038$ 468,515$ 8,675$ 657$
* Including payment of accreted interest
Tax Revenue Bonds
Hotel Tax Revenue Bonds
CITY AND COUNTY OF SAN FRANCISCO
Notes to Basic Financial Statements (Continued)
June 30, 2023
(Dollars in Thousands)
171
Special Assessment Debt without Commitment - Various community facility district bonds have
been issued by the former Agency on behalf of various property owners who retain full responsibility
for the repayment of the debt. When these obligations are issued, they are secured by special
assessment taxes, and, in the opinion of management, are not considered obligations of the Successor
Agency or the City and are therefore not included in the financial statements. Debt service payments
will be made by the property owners. At June 30, 2023, the Successor Agency had outstanding
community facility district bonds totaling $141.5 million.
Transbay Transit Center Agreements - In July 2003, the City, the Transbay Joint Powers Authority
(TJPA), and the State of California acting through its Department of Transportation (Caltrans) entered
into the Transbay Transit Terminal Cooperative Agreement (Cooperative Agreement) in which Caltrans
agreed to transfer approximately 10 acres of State-owned property in and around the then-existing
Transbay Terminal to the City and the TJPA to help fund the development of the Transbay Transit
Center (TTC). The Cooperative Agreement requires that the TJPA sell certain State-owned parcels and
use the revenues from the sales and the net tax increments to finance the TTC.
In 2008, the City and the former Agency entered into a binding agreement with the TJPA that irrevocably
pledges all sales proceeds and net tax increments from the State-owned parcels to the TJPA for a
period of 45 years (Pledge Agreement). At the same time, the City, the TJPA and the former Agency
entered into an Option Agreement which grants options to the former Agency to acquire the State-
owned parcels, arrange for development of the parcels, and distribute the net tax increments to the
TJPA to use for the TTC. During the year ended June 30, 2023, the Successor Agency distributed
$27.3 million to the TJPA. The payment was recorded as a neighborhood development deduction on
the statement of changes in fiduciary net position.
CITY AND COUNTY OF SAN FRANCISCO
Notes to Basic Financial Statements (Continued)
June 30, 2023
(Dollars in Thousands)
172
(15) TREASURE ISLAND DEVELOPMENT AUTHORITY
The Treasure Island Development Authority (TIDA) is a nonprofit public benefit corporation. TIDA was
authorized in accordance with the Treasure Island Conversion Act of 1997. TIDA is governed by the seven
members of the TIDA Board of Directors who are appointed by the Mayor, subject to confirmation by the
City’s Board of Supervisors. The specific purpose of TIDA is to promote the planning, redevelopment,
reconstruction, rehabilitation, reuse and conversion of the property known as Naval Station Treasure Island
for the public interest, convenience, welfare and common benefit of the inhabitants of the City.
The services provided by TIDA include administering the acquisition of former Naval Station Treasure Island
from the U.S. Navy and implementing the Treasure Island Development Project; renting existing Treasure
Island facilities including commercial facilities and approximately 650 housing units to generate revenues
to cover operating costs; maintaining Treasure Island utilities, facilities and other infrastructure; and
overseeing the U.S. Navy’s remediation activities on the former naval base.
In early 2000, TIDA initiated a master developer selection process, culminating in the selection of Treasure
Island Community Development, LLC (TICD) in March 2003. TIDA and TICD entered into an Exclusive
Negotiating Agreement in 2003, and began work on the Development Plan and Term Sheet for the
Redevelopment of Naval Station Treasure Island (Development Plan). The Development Plan was
endorsed by the TIDA Board and the City’s Board of Supervisors in December 2006. In May 2010, the TIDA
Board and Board of Supervisors both unanimously endorsed a package of legislation that included an
Update to the Development Plan and Term Sheet, terms of an Economic Development Conveyance
Memorandum of Agreement (EDC MOA Term Sheet), and a Term Sheet between TIDA and the Treasure
Island Homeless Development Initiative (TIHDI) now called One Treasure Island.
In April 2011, the TIDA Board and the Planning Commission certified the environmental impact report for
the project and approved various project entitlements, including amendments to the Planning Code, Zoning
Maps and General Plan, as well as a Development Agreement, Disposition and Development Agreement
and Interagency Cooperation Agreement. These entitlements include detailed plans for land uses, phasing,
infrastructure, transportation, sustainability, housing – including affordable housing, jobs and equal
opportunity programs, community facilities and project financing. In June 2011, the Board of Supervisors
unanimously upheld the certification of the project’s environmental impact report and approved the project
entitlements. These project approvals established the framework and cleared the way for realization of a
new environmentally sustainable community on Treasure Island and the thousands of construction and
permanent jobs the construction will bring.
The development plan for the project anticipates a new San Francisco neighborhood consisting of up to
8,000 new residential housing units, new commercial and retail space, a hotel, and 290 acres of parks and
public open space, including shoreline access and cultural uses. Transportation amenities being built for
the project will enhance mobility on Yerba Buena Island and Treasure Island as well as link the islands to
mainland San Francisco. Some amenities include a combined police/fire emergency services building;
utility improvements including new water, sewer, storm, gas, electrical and communications infrastructure
with new water storage reservoirs and a wastewater treatment plant; new and upgraded streets, public
byways, bicycle, transit, and pedestrian facilities; and a new ferry terminal.
On May 29, 2015, the Navy made the first transfer of property to TIDA consisting of 275 acres on Yerba
Buena and Treasure Islands and the offshore submerged lands. This has been followed by four smaller
transfers from 2016 through 2019. The full conveyance of the former base is not anticipated prior to 2025,
as TIDA and the Navy are currently reviewing the future conveyance schedule.
Existing structures on Yerba Buena were demolished between February and August 2016, and structures
in the first area of development on Treasure Island were demolished between July 2016 and February
2017. The first infrastructure construction projects on Yerba Buena Island, including the new water
reservoirs and new roadways were completed in the third quarter of 2021, and utilities and street
improvements are complete.

CITY AND COUNTY OF SAN FRANCISCO
Notes to Basic Financial Statements (Continued)
June 30, 2023
(Dollars in Thousands)
173
The first residential project on Yerba Buena Island called the Bristol, a 124-unit condominium building,
began construction in June 2019, received its Temporary Certificate of Occupancy in spring 2022, and
move-ins began in June 2022. Two additional residential flats and townhome sites on Yerba Buena Island
broke ground in 2022 and are currently under construction anticipated to receive its Temporary Certificate
of Occupancy in 2025.
On Treasure Island, geotechnical improvement of soil conditions in the first subphase area on Treasure
Island were substantially completed in 2020, and new roadway, sewer, storm water, water, power, and
electrical infrastructure is nearly complete, and TICD is seeking acceptance of the new infrastructure from
the City. The developer has begun geotechnical improvement in the second subphase area. The
geotechnical improvement of the site of the new wastewater treatment plant and electrical switchyard on
Treasure Island is complete, the new electrical switchyard is operational, and the San Francisco Public
Utilities Commission (SFPUC) has approval from its Commission to negotiate with the top-ranked proposer
for a design-build contract. Construction of the new plant is anticipated to be complete in 2025.
The first residential project on Treasure Island, Maceo May Apartment, a 105-unit, 100% affordable building
developed by Chinatown Community Development Center in partnership with Swords to Plowshares broke
ground in the fall of 2020 and had its grand opening in May 2023. Four other residential sites on Treasure
Island broke ground in 2022, including Star View Court, a 100% affordable 138-unit building being
developed by Mercy Housing in partnership with Catholic Charities. Star View Court broke ground in fall
2022 and is scheduled for completion in mid-2024. Pre-development funding was approved for the next
affordable housing site on Treasure Island Parcel E1.2 where two separate buildings – a senior housing
site and a behavioral health program site – will be developed. A 2024 start of construction is targeted with
occupancy in 2026.
Several market rate housing projects on Treasure Island are under construction, including the Isle House
(250-unit building) expected for completion in fall 2024, Hawkins (178-unit building) expected for completion
in late 2024, and Portico (148-unit building) expected for completion in early 2025.
The first park on Yerba Buena Island, the Boulders Dog Park, has been completed. Construction is
underway for other first phase parks including Hilltop/Infinity Point Park on Yerba Buena Island, and
Causeway Park, Waterfront Plaza, and the Clipper Cove Beach Park located on Treasure Island. The first
installation under the Treasure Island Art Program, a sculpture called the Point of Infinity by artist Hiroshi
Sugimoto, was finished and installed at Hilltop Park in May 2023.
The complete build-out of the project is anticipated to occur over fifteen to twenty years.
As of June 30, 2023, TIDA has the following payable to other City departments:
As of June 30, 2023, TIDA has the following receivable from other City department:
Payable to Purpose Current Noncurrent Total
SFCTA YBI and mobility management expenses $ 5,871 $ - $ 5,871
General Fund Cash Coverage 3,603 - 3,603
Hetch Hetchy Energy efficiency project - 6,805 6,805
Hetch Hetchy Utility operations 372 - 372
$ 9,846 $ 6,805 $ 16,651
Receivable from
Purpose
Amount
SFCTA Vista Point and Pier management expenses
$ 38

CITY AND COUNTY OF SAN FRANCISCO
Notes to Basic Financial Statements (Continued)
June 30, 2023
(Dollars in Thousands)
174
(16) INTERFUND RECEIVABLES, PAYABLES, AND TRANSFERS
“Due to” and “due from” balances have primarily been recorded when funds overdraw their share of
pooled cash or when there are transactions between entities where one or both entities do not
participate in the City’s pooled cash or when there are short-term loans between funds. The composition
of interfund balances as of June 30, 2023, is as follows:
In addition to routine short-term loans, Hetch Hetchy serves as the City’s agency for energy efficiency
projects and maintains the Sustainable Energy Account (SEA) to sponsor and financially support such
projects at various City departments. In this role, Hetch Hetchy may secure low-interest financing to
supplement funds available in the SEA fund. At June 30, 2023, Hetch Hetchy loaned $3.6 million to
other City funds.
Due to/from other funds (in thousands):
Receivable Fund Payable Fund
Amount
General Fund Nonmajor Governmental Funds 7,309$
Nonmajor Governmental Funds Nonmajor Governmental Funds 14,625
Municipal Transportation Agency 594
15,219
General Hospital Medical Center Nonmajor Governmental Funds 17
San Francisco Water Enterprise Nonmajor Governmental Funds 115
Hetch Hetchy Water and Power Enterprise General Fund 210
Nonmajor Governmental Funds 3,581
San Francisco Wastewater Enterprise 518
4,309
Municipal Transportation Agency Nonmajor Governmental Funds 70,612
Hetch Hetchy Water and Power 1,946
San Francisco Water Enterprise 2,440
San Francisco Wastewater Enterprise 2,102
77,100
San Francisco Wastewater Enterprise Nonmajor Governmental Funds 128
Total 104,197$

CITY AND COUNTY OF SAN FRANCISCO
Notes to Basic Financial Statements (Continued)
June 30, 2023
(Dollars in Thousands)
175
The SFMTA has a receivable from nonmajor governmental funds of $52.2 million for capital and
operating grants.
Due from component units:
Receivable Entity
Payable Entity
Amount
General Fund
Component unit – TIDA
$ 3,603
(1)
Nonmajor Governmental Funds
Component unit – TIDA
5,871
(1)
Hetch Hetchy Water and Power Enterprise
Component unit – TIDA
372
(1)
Nonmajor Governmental Funds
Successor Agency
3,622
Advance to component units:
Receivable Entity
Payable Entity
Amount
Hetch Hetchy Water and Power Enterprise
Component unit – TIDA
$ 6,805
(1)
(1)
See discussion at Note 15.
The $1.32 billion General Fund transfer out includes a total of $788.7 million in operating subsidies to
SFMTA, SFGH, and Laguna Honda Hospital (see Note 13). The transfer of $501.0 million from the
General Fund to the nonmajor governmental funds is to provide support to various City programs such
as the Public Library and Children and Families Fund, as well as to provide resources for the payment
of debt service. The transfers between the nonmajor governmental funds are mainly to provide support
for various City programs and to provide resources for the payment of debt service.
San Francisco International Airport transferred $48.7 million to the General Fund, representing a portion
of concession revenues (see Note 13(a)). General Fund received $128 from Laguna Honda Hospital,
$105 for project management services and $23 for fiscal year 2022-23 shortfall, and $700 from SFGH
to reappropriate funds. General Fund also received $8.6 million from SFGH for interest earned by the
General Fund but credited to SFGH.
Laguna Honda Hospital received from SFGH $2.0 million for a shared project, $500 for fiscal year 2022-
23 shortfall and $381 from nonmajor governmental funds for relocation project.
SFMTA received $89.5 million transfers from nonmajor governmental funds, of which $61.8 million was
for capital activities, $27.7 million was for operating activities.
General
Fund
Nonmajor
Govern-
mental
Funds
Internal
Service
Funds
Water
Enterprise
Hetch
Hetchy
Water and
Power
Enterprise
Municipal
Transporta-
tion Agency
San
Francisco
General
Hospital
Medical
Center
Wastewater
Enterprise
Port of San
Francisco
Laguna
Honda
Hospital
Total
-$ 501,010$ 362$ 5$ -$ 556,423$ 137,399$ 75$ 500$ 120,300$ 1,316,074$
Nonmajor
governmental funds....... 61,134 81,731 - - - 89,504 - - 38,733 381 271,483
141 - - - - - - - - - 141
San Francisco
International Airport........ 48,701 - - - - - - - - - 48,701
- 32 - - 20,000 - - - - - 20,032
Hetch Hetchy
Water and Power
Enterprise........................ - 32 - - - - - - - - 32
San Francisco
General Hospital
Medical Center................ 9,257 - - - - - - - - 2,484 11,741
- 32 - - - - - - - - 32
- 32 - - - - - - - - 32
128 - - - - - - - - - 128
Total transfers out 119,361$ 582,869$ 362$ 5$ 20,000$ 645,927$ 137,399$ 75$ 39,233$ 123,165$ 1,668,396$
Transfers In: Funds (in thousands)
Transfers Out:
Funds
General Fund....................
Internal Service Funds.....
Water Enterprise...............
Wastewater Enterprise....
Port of San Francisco......
Laguna Honda Hospital..
CITY AND COUNTY OF SAN FRANCISCO
Notes to Basic Financial Statements (Continued)
June 30, 2023
(Dollars in Thousands)
176
The Water Enterprise transferred $20.0 million to Hetch Hetchy Water and Power Enterprise to fund
various Mountain Tunnel Improvement projects, and $32 to nonmajor governmental funds for the
Surety Bond Program. In turn, the Water Enterprise received $5 from General Fund for Mayor’s Office’s
minimum compensation ordinance.
The Wastewater Enterprise received $75 from General Fund for the Wastewater Add-backs Master
Project, and transferred $32 to the Office of the City Administrator for the Surety Bond Program.
The Hetch Hetchy Water and Power Enterprise transferred $32 to the Office of the City Administrator
for the Surety Bond Program and received $20.0 million from the Water Enterprise to fund various
Mountain Tunnel Improvement projects.
The Port of San Francisco received $500 from General Fund for the Add-backs Project and
$38.7 million from nonmajor governmental funds to support early projects, adaptation strategies, and
San Francisco Waterfront Coastal Flood Study general investigation. In turn, Port of San Francisco
transferred $32 to the Office of the City Administrator for the Surety Bond Program.
The Internal Service Funds received $300 from General Fund for the DT project and $62 for interest
earned by the Internal Service Funds but credited to the General Fund. Internal Service Funds
transferred $141 to General Fund for interest earned by the General Fund but credited to the Internal
Service Funds.

CITY AND COUNTY OF SAN FRANCISCO
Notes to Basic Financial Statements (Continued)
June 30, 2023
(Dollars in Thousands)
177
(17) LEASES, COMMITMENTS AND CONTINGENT LIABILITIES
Leases and Similar Subscription-Based Information Technology Arrangements
Primary Government
City as Lessee and Subscriber
The City has entered into long-term leases for land, office space, communication site, data processing,
machinery, and other equipment. The terms and conditions for theses leases varies, which ranges
between 1 – 80 years. The City also has noncancellable subscription arrangements (similar to a lease)
for the right to use various information technology hardware and software (SBITAs). The terms and
conditions for theses subscriptions varies, which ranges between 1 – 10 years.
A summary of intangible right-to-use assets during the year ended June 30, 2023, is as follows (in
thousands):
Balance Balance
July 1, June 30,
Governmental Activities: 2022, as restated Increases Decreases 2023
Right-to-use assets:
Land............................................................ 1,675$ -$ -$ 1,675$
Building/Facility........................................... 571,793 74,057 (30,627) 615,223
Equipment................................................... 2,141 - (976) 1,165
Others......................................................... 1,214 - - 1,214
Subscription assets.................................... 49,277 1,036 - 50,313
Total right-to-use assets........................... 626,100 75,093 (31,603) 669,590
Less accumulated amortization:
Right-to-use assets:
Land............................................................ 139 139 - 278
Building/Facility........................................... 72,349 73,116 (7,246) 138,219
Equipment................................................... 1,149 661 (976) 834
Others......................................................... 405 405 - 810
Subscription assets.................................... - 16,741 - 16,741
Total accumulated amortization............... 74,042 91,062 (8,222) 156,882
Governmental activities right-to-use
assets, net…............................................
552,058$ (15,969)$ (23,381)$ 512,708$
Balance Balance
July 1, June 30,
Business-Type Activities: 2022, as restated Increases Decreases 2023
Right-to-use assets:
Land............................................................ 24,029$ -$ -$ 24,029$
Building/Facility........................................... 214,728 8,099 (976) 221,851
Equipment................................................... 20,017 4,494 (9,483) 15,028
Others......................................................... - - - -
Subscription assets.................................... 5,456 2,697 - 8,153
Total lease assets.................................... 264,230 15,290 (10,459) 269,061
Less accumulated amortization:
Right-to-use assets:
Land............................................................ 722 536 - 1,258
Building/Facility........................................... 20,280 14,244 (976) 33,548
Equipment................................................... 9,269 6,563 (9,483) 6,349
Others......................................................... - - - -
Subscription assets.................................... 1,760 3,369 - 5,129
Total accumulated amortization............... 32,031 24,712 (10,459) 46,284
Business-type activities right-to-use
assets, net…............................................
232,199$ (9,422)$ -$ 222,777$

CITY AND COUNTY OF SAN FRANCISCO
Notes to Basic Financial Statements (Continued)
June 30, 2023
(Dollars in Thousands)
178
Future annual lease and subscription payments are as follows:
Governmental Activities
Business-type Activities
In fiscal year 2022-23, the City’s governmental activities and business-type activities recognized
$8.7 million and $4.9 million, respectively, in interest expense for the related leases and subscriptions.
Variable lease and subscription payments, other than those payments that depend on an index or rate
or are fixed in substance, are excluded from the measurement of the lease and subscription IT liability.
Such amounts are recognized as lease expense or subscription expense, respectively, in the period in
which the obligation for those payments is incurred.
Fiscal
Years Principal Interest Total
2024............ . 76,818$ 8,492$ 85,310$
2025............ . 65,701 7,433 73,134
2026............ . 55,986 6,472 62,458
2027............ . 47,940 5,604 53,544
2028............ . 42,825 4,781 47,606
2029-2033.... . 122,798 16,060 138,858
2034-2038.... . 102,183 5,948 108,131
2039-2043.... . 17,283 385 17,668
.
Total…………….
. 531,534$ 55,175$ 586,709$
Fiscal
Years Principal Interest Total Principal Interest Total Principal Interest Total Principal Interest Total
2024………………
. 816$ 25$ 841$ 1,555$ 1,598$ 3,153$ 2,659$ 56$ 2,715$ 6,430$ 2,648$ 9,078$
2025………………
. 346 5 351 1,574 1,561 3,135 1,522 38 1,560 6,774 2,536 9,310
2026………………
. - - - 1,777 1,521 3,298 1,037 25 1,062 5,925 2,417 8,342
2027………………
. - - - 2,052 1,474 3,526 977 11 988 6,166 2,321 8,487
2028………………
. - - - 2,102 1,424 3,526 440 2 442 5,550 2,224 7,774
2029-2033………………
. - - - 11,301 6,330 17,631 - - - 25,544 9,751 35,295
2034-2038………………
. - - - 12,740 4,888 17,628 - - - 31,483 7,177 38,660
2039-2043………………
. - - - 14,363 3,261 17,624 - - - 38,898 3,916 42,814
2044-2048………………
. - - - 16,192 1,428 17,620 - - - 725 2,154 2,879
2049-2053………………
. - - - 3,780 46 3,826 - - - - 2,495 2,495
2054-2058………………
. - - - - - - - - - - 2,893 2,893
2059-2063………………
. - - - - - - - - - - 3,354 3,354
2064-2068………………
. - - - - - - - - - - 3,888 3,888
2069-2073………………
. - - - - - - - - - - 4,507 4,507
Thereafter..... . - - - - - - - - - 23,207 11,824 35,031
.
Total……………..
. 1,162$ 30$ 1,192$ 67,436$ 23,531$ 90,967$ 6,635$ 132$ 6,767$ 150,702$ 64,105$ 214,807$
Fiscal
Years Principal Interest Total Principal Interest Total Principal Interest Total Principal Interest Total
2024………………
. 1,589$ 89$ 1,678$ 198$ 8$ 206$ 1,540$ 10$ 1,550$ 14,787$ 4,434$ 19,221$
2025………………
. 1,181 59 1,240 96 8 104 93 2 95 11,586 4,209 15,795
2026………………
. 701 34 735 98 5 103 93 1 94 9,631 4,003 13,634
2027………………
. 135 26 161 36 4 40 - - - 9,366 3,836 13,202
2028………………
. 122 23 145 37 3 40 - - - 8,251 3,676 11,927
2029-2033………………
. 416 86 502 68 9 77 - - - 37,329 16,176 53,505
2034-2038………………
. 445 39 484 42 4 46 - - - 44,710 12,108 56,818
2039-2043………………
. 129 3 132 18 - 18 - - - 53,408 7,180 60,588
2044-2048………………
. - - - - - - - - - 16,917 3,582 20,499
2049-2053………………
. - - - - - - - - - 3,780 2,541 6,321
2054-2058………………
. - - - - - - - - - - 2,893 2,893
2059-2063………………
. - - - - - - - - - - 3,354 3,354
2064-2068………………
. - - - - - - - - - - 3,888 3,888
2069-2073………………
. - - - - - - - - - - 4,507 4,507
Thereafter..... . - - - - - - - - - 23,207 11,824 35,031
.
Total……………..
. 4,718$ 359$ 5,077$ 593$ 41$ 634$ 1,726$ 13$ 1,739$ 232,972$ 88,211$ 321,183$
Airport
Port
General Hospital Medical Center
Municipal Transportation Agency
Hetch Hetchy Water and Power
San Francisco Wastewater Enterprise
San Francisco Water Enterprise
Total Business-type Activities

CITY AND COUNTY OF SAN FRANCISCO
Notes to Basic Financial Statements (Continued)
June 30, 2023
(Dollars in Thousands)
179
Certain equipment or facility rental leases require the City to make variable lease payments that based
on usage, index, and insurance payments made by the lessor, these amounts are generally determined
annually. The amounts recognized as expense for variable lease payments not included in the
measurement of the lease liability for governmental activities and business-type activities were $10.0
million and $1.6 million, respectively, during the year ended June 30, 2023.
As of June 30, 2023, no variable subscription payments were noted for the City’s subscription IT
arrangements.
City as Lessor
The City has leased facilities, easements, communication site and equipment to varies tenants. The
terms and conditions for these leases vary, which range between 1- 75 years.
The Airport leases terminal space (except for regulated leases), non-terminal buildings, and land to
tenants under various operating leases, a majority of which is non-cancellable and terminate at various
dates as late as 2053.
Principal and interest requirements to maturity for the lease receivable at June 30, 2023, are as follows:
Governmental Activities
Fiscal
Years Principal Interest Total
2024………………
. 4,678$ 1,653$ 6,331$
2025………………
. 4,779 1,573 6,352
2026………………
. 4,769 1,488 6,257
2027………………
. 4,306 1,405 5,711
2028………………
. 4,090 1,328 5,418
2029-2033………………
. 18,140 5,574 23,714
2034-2038………………
. 16,762 3,934 20,696
2039-2043………………
. 16,704 2,289 18,993
2044-2048………………
. 11,608 667 12,275
2049-2053………………
. 454 258 712
2054-2058………………
. 503 209 712
2059-2063………………
. 556 155 711
2064-2068………………
. 616 96 712
2069-2073………………
. 622 29 651
.
Total…………….
. 88,587$ 20,658$ 109,245$

CITY AND COUNTY OF SAN FRANCISCO
Notes to Basic Financial Statements (Continued)
June 30, 2023
(Dollars in Thousands)
180
Business-type Activities -excluded regulated leases
In fiscal year 2022-23, the City’s governmental activities recognized $5.4 million in lease revenue and
$1.7 million in interest income for the related leases and the City’s business-type activities recognized
$151.1 million in lease revenue and $27.4 million in interest income for the related leases.
Variable payments include percentage of sales or payments depended on an index made by the lessee;
these amounts are generally determined periodically. The City did not incur revenue related to residual
value guarantees or lease termination penalties. The amounts recognized as revenue for variable lease
payments not included in the measurement of the lease receivable for governmental activities and
business-type activities were $9.4 million and $13.4 million, respectively, during the year ended June
30, 2023.
Regulated Leases
Certain regulated leases are subject to external laws, regulations or legal rulings and are exempted
from the GASB 87 recognition, subject to the conditions that:
(a) Lease rates cannot exceed a reasonable amount.
(b) Lease rates should be similar for similar situated lessees, and
(c) The lessor cannot deny potential lessees if facilities are available.
Fiscal
Years Principal Interest Total Principal Interest Total Principal Interest Total Principal Interest Total
2024………………
. 114,523$ 26,454$ 140,977$ 41,963$ 10,687$ 52,650$ 375$ 144$ 519$ 110$ 20$ 130$
2025………………
. 113,953 23,350 137,303 35,510 10,022 45,532 353 141 494 116 17 133
2026………………
. 112,953 20,175 133,128 32,453 9,396 41,849 276 138 414 122 15 137
2027………………
. 112,262 16,974 129,236 28,400 8,804 37,204 161 136 297 128 13 141
2028………………
. 114,649 13,709 128,358 21,378 8,300 29,678 51 134 185 135 11 146
2029-2033………………
. 306,703 30,988 337,691 87,119 35,871 122,990 242 658 900 500 16 516
2034-2038………………
. 39,255 4,745 44,000 68,220 27,316 95,536 268 632 900 - - -
2039-2043………………
. 9,265 3,235 12,500 41,565 21,286 62,851 297 603 900 - - -
2044-2048………………
. 10,445 2,055 12,500 34,534 16,969 51,503 328 572 900 - - -
2049-2053………………
. 11,713 725 12,438 13,352 13,817 27,169 363 537 900 - - -
2054-2058………………
. - - - 15,064 12,203 27,267 402 498 900 - - -
2059-2063………………
. - - - 18,966 10,308 29,274 445 455 900 - - -
2064-2068………………
. - - - 22,063 7,280 29,343 493 407 900 - - -
2069-2073………………
. - - - 22,989 4,202 27,191 546 354 900 - - -
Thereafter..... . - - - 21,508 868 22,376 3,201 775 3,976 - - -
.
Total……………..
. 945,721$ 142,410$ 1,088,131$ 505,084$ 197,329$ 702,413$ 7,801$ 6,184$ 13,985$ 1,111$ 92$ 1,203$
Fiscal
Years Principal Interest Total Principal Interest Total Principal Interest Total Principal Interest Total
2024………………
. 7,437$ 2,026$ 9,463$ 3,521$ 869$ 4,390$ 212$ 38$ 250$ 168,141$ 40,238$ 208,379$
2025………………
. 8,079 1,866 9,945 3,610 821 4,431 226 32 258 161,847 36,249 198,096
2026………………
. 10,176 1,651 11,827 3,046 756 3,802 241 26 267 159,267 32,157 191,424
2027………………
. 9,506 1,392 10,898 2,721 698 3,419 257 19 276 153,435 28,036 181,471
2028………………
. 9,698 1,128 10,826 2,423 645 3,068 215 12 227 148,549 23,939 172,488
2029-2033………………
. 12,292 3,587 15,879 10,951 2,571 13,522 306 13 319 418,113 73,704 491,817
2034-2038………………
. 3,114 3,136 6,250 9,941 1,477 11,418 - - - 120,798 37,306 158,104
2039-2043………………
. 3,447 2,803 6,250 828 914 1,742 - - - 55,402 28,841 84,243
2044-2048………………
. 3,816 2,434 6,250 - 1,027 1,027 - - - 49,123 23,057 72,180
2049-2053………………
. 4,224 2,026 6,250 - 1,191 1,191 - - - 29,652 18,296 47,948
2054-2058………………
. 4,676 1,574 6,250 117 1,263 1,380 - - - 20,259 15,538 35,797
2059-2063………………
. 5,176 1,074 6,250 832 768 1,600 - - - 25,419 12,605 38,024
2064-2068………………
. 5,730 520 6,250 1,208 647 1,855 - - - 29,494 8,854 38,348
2069-2073………………
. 2,147 40 2,187 1,676 475 2,151 - - - 27,358 5,071 32,429
Thereafter..... . - - - 2,756 250 3,006 - - - 27,465 1,893 29,358
.
Total……………..
. 89,518$ 25,257$ 114,775$ 43,630$ 14,372$ 58,002$ 1,457$ 140$ 1,597$ 1,594,322$ 385,784$ 1,980,106$
Total Business-type Activities
Municipal Transportation Agency
San Francisco Water Enterprise
San Francisco Wastewater Enterprise
Airport
Port
General Hospital Medical Center
Laguna Honda Hospital

CITY AND COUNTY OF SAN FRANCISCO
Notes to Basic Financial Statements (Continued)
June 30, 2023
(Dollars in Thousands)
181
Such regulated leases at the Airport include:
(a) The Lease and Use Agreements with certain airlines regarding the use of terminal building and
equipment on an exclusive or preferential use basis, among other uses among other uses, which
expired on June 30, 2023.
(b) Non-terminal aeronautical buildings and land leases. Based on the airlines’ operation needs, an
airline may lease terminal space such as office space, ticket counter space, baggage makeup
space, baggage claim space, and other operation spaces on a combination of exclusive,
preferential, and common use basis. The Commission provides holdrooms on a preferential or
common use basis to the airlines and adjusts the preferential assignment from time to time
pursuant to the Lease and Use Agreements. For the year ended June 30, 2023, United Airlines
accounted for 46.7 percent of total enplaned passengers at the Airport, followed by Alaska
Airlines (12.3%), Delta Air Lines (7.9%), and American Airlines (6.3%), with no other airlines
accounting for more than 5 percent of enplaned passengers. Non-terminal buildings and lands
are leased on an exclusive basis. The Airport has entered new Lease and Use Agreements that
became effective on July 1, 2023 and expire on June 30, 2033.
The payments under the Lease and Use Agreements are recalculated at the end of each fiscal year
and therefore are variable payments. Total inflow of resources for regulated leases during year ended
June 30, 2023, was $215.6 million, including approximately $47.3 million of fixed payments and $168.3
million of variable payments. The additional exclusive and preferential use payments are the actual
billed amount during fiscal year 2022-23, which was adjusted down $14.5 million during the year-end
true-up process.
Below is a summary of the total number of regulated leases for fiscal year 2022-23, including which
assets are subject to preferential or exclusive use by counterparties:
Number
of Leases
AULA
(a)
Preferential and exclusive rental 7
Exclusive rental only 28
Non-space rental, only common use 3
Subtotal - AULA 38
Other Regulated
(b)
8
Total 46
Notes:
(a)
Airline-airport lease and use agreements.
(b)
Includes cargo, fuel, fixed-base facility leases, hangar leases,
and ground leases.

CITY AND COUNTY OF SAN FRANCISCO
Notes to Basic Financial Statements (Continued)
June 30, 2023
(Dollars in Thousands)
182
Lease revenues and interest revenues recognized during the year ended June 30, 2023, for regulated
leases is presented below:
Below is a schedule of expected future minimum payments under these agreements for each of the
subsequent five years and in five-year increments thereafter:
Expected Minimum Payments
(a)
$ 45,277
Additional Fixed Payments
(b)
2,024
Total Fixed Payments 47,301
Additional Exclusive Use Payments
(c)
127,086
Additional Preferential Use Payments
(d)
55,666
Year-end True-ups (14,465)
Total Regulated Lease Payments $ 215,588
Notes:
(a)
Does not include airline use and lease agreements, which are
recalculated annually and considered variable payments.
(b)
Includes additional rent above the expected minimum payments
after adjusmet by CPI and reappraisals.
(c)
Includes AULA exclusive use rental revenues, other regulated
leases that were charged by airport's rates and charges rate,
and percentage fee revenues above minimum annual guarantee.
(d)
Includes AULA preferential use rental revenues
Fiscal Expected Future
Years
Minimum Payments
(a)
2024................... . 19,286$
2025................... . 18,092
2026................... . 5,462
2027................... . 1,644
2028................... . 1,644
2029-2033........... . 8,221
2034-2038........... . 8,221
2039-2043........... . 8,221
2044-2048........... . 6,166
.
Total................... . 76,957$
Note:
(a)
Does not include airline use and lease agreements,
which are recalculated annually and considered
variable payments.

CITY AND COUNTY OF SAN FRANCISCO
Notes to Basic Financial Statements (Continued)
June 30, 2023
(Dollars in Thousands)
183
Sublease
City has a non-cancellable building lease at the 555-575 Polk Street location. The second floor is the
City’s community justice court/center and the ground floor is subleased to the State’s Administrative
Office of the Courts (State AOC) for use by the Superior Courts. The 15-year master lease and sublease
will both end in 2026. City’s rental payments in fiscal year 2022-23 were $0.6 million and received $0.4
million from State AOC.
The Port has a non-cancelable lease (sublease) for its offices at Pier 1 from the master tenant. The
master lease, as amended in fiscal year 2015-16, allows the master tenant an option to extend the
lease term for an additional 15 years. Among other things, the amended provisions include a grant to
the Port, as sub-lessee, a one-time early termination right in 2031, and if such termination is not
exercised, a 15-year extension option, for a term coterminous with the master lease if the master lease
is also extended. The Port has an option to purchase the leasehold premises at a price equal to the
present value of the remaining base rent due from the Port to the master tenant, effective through the
expiration date of the sublease. On February 1, 2021, the sublease adopted a market rate adjustment,
resulting in an increase in future minimum annual payments. The Port’s rental payments in fiscal year
2022-23 were $4.1 million.
Component Unit
Component Unit as Lessor
The component unit has leased facilities, easements, communication site and equipment to various
tenants. The terms and conditions for these leases varies, which ranges between 1- 75 years.
The total amount for lease revenue and interest income recognized during fiscal year 2022-23 were
$1.9 million and $0.3 million, respectively, related to these leases. Variable payments include
percentage of sales or payments depended on an index made by the lessee; these amounts are
generally determined periodically. The component unit did not incur revenue related to residual value
guarantees or lease termination penalties. As of June 30, 2023, no variable lease payments were noted.
Treasure Island Development Authority
Fiscal
Years Principal Interest
2024............... $ 2,365 $ 322 $ 2,687
2025............... 2,061 284 2,345
2026............... 1,090 257 1,347
2027............... 823 237 1,060
2028............... 600 225 825
2029-2033...... 3,097 964 4,061
2034-2038...... 3,307 691 3,998
2039-2043...... 2,200 419 2,619
2044-2048...... 194 353 547
2049-2053...... 234 323 557
2054-2058...... 275 290 565
2059-2063...... 316 260 576
2064-2068...... 362 226 588
2069-2073...... 413 186 599
Thereafter....... 1,616 264 1,880
Total............... $ 18,953 $ 5,301 $ 24,254
Total

CITY AND COUNTY OF SAN FRANCISCO
Notes to Basic Financial Statements (Continued)
June 30, 2023
(Dollars in Thousands)
184
Public-Private Partnership Arrangement for the Yerba Buena Gardens
As of June 30, 2023, capital improvements were completed on the Yerba Buena Gardens pursuant to
a public-private partnership arrangement with Yerba Buena Gardens Conservancy (Conservancy),
under which the Conservancy manages, operates, repairs, maintains, and improves the premises for
40 years. The Conservancy collects all revenues during the 40-year operations period. The City
reported the completed capital improvements as capital assets with a carrying amount of $5.9 million
and a related deferred inflow of resources of $5.9 million.
A summary of public-private partnership capital assets during the year ended June 30, 2023, is as
follows (in thousands):
Other Commitments
The Retirement System has unfunded commitments to contribute capital for real assets in the amount
of $1.87 billion, private equity in the amount of $3.52 billion, private credit in the amount of $2.41 billion,
and absolute return investments in the amount of $62.7 million, which totaled $7.86 billion as of June
30, 2023.
The Retiree Health Care Trust Fund has unfunded commitments to contribute capital for private equity
in the amount of $40.2 million as of June 30, 2023.
In February 2011, the Asian Art Museum Foundation (Foundation) entered into an agreement with JP
Morgan Chase Bank to refinance its obligations of $97.0 million. To facilitate the refinancing, the City
entered into an assurance agreement which, in the event of nonpayment by the Foundation, requires
the City to seek an appropriation to make debt payments as they become due. Since the City has not
legally guaranteed the debt, and the City believes that the likelihood of nonpayment by the Foundation
is remote, no amount is recorded in the City's financial statements related to this agreement.
.
Balance Balance
July 1, June 30,
Governmental Activities: 2022, as restated Increases Decreases 2023
Building/Facility........................................... 3,378$ 768$ -$ 4,146$
Equipment................................................... 277 - - 277
Infrastructure............................................... 1,046 596 - 1,642
Total public-private partnership assets.... 4,701 1,364 - 6,065
Less accumulated amortization:
Building/Facility........................................... - 122 - 122
Equipment................................................... - 20 - 20
Infrastructure............................................... - 43 - 43
Total accumulated amortization............... - 185 - 185
Governmental activities public-private
partnership, net….....................................
4,701$ 1,179$ -$ 5,880$
CITY AND COUNTY OF SAN FRANCISCO
Notes to Basic Financial Statements (Continued)
June 30, 2023
(Dollars in Thousands)
185
(18) RISK MANAGEMENT
Risk Retention Program Description
The City is exposed to various risks of losses related to torts, theft of, damage to, and destruction of
assets; business interruption; errors and omissions; automobile liability and accident claims (primarily
for SFMTA); medical malpractice; natural disasters; employee health benefit claim payments for direct
provider care (collectively referred to herein as estimated claims payable); and injuries to employees
(workers’ compensation). With certain exceptions, it is the policy of the City not to purchase commercial
insurance for the risks of losses to which it is exposed. Instead, the City believes it is more economical
to manage its risks internally and set aside funds as needed for estimated current claim settlements and
unfavorable judgments through annual appropriations and supplemental appropriations.
The Airport is not required to, nor does it carry insurance or self-insure against any risks due to land
movement or seismic activity. The Airport has an ongoing loss prevention program, a safety officer,
property loss control, and ongoing employee training programs. The Airport has instituted an Enterprise
Risk Management Program by implementing a comprehensive risk identification, assessment, and
treatment protocol to address key risks that may adversely affect the Airport’s ability to meet its business
goals and objectives. The Airport carries aviation liability insurance coverage of $1.0 billion with $250.0
million in War Perils Liability, subject to a deductible of $10 per occurrence. Immediately following the
events of September 11, 2001, insurers canceled the coverage for war, terrorism, and hijacking for all
airports, including the Airport. A number of insurers now provide this coverage through the Federal
Government Terrorism Risk Insurance Act. However, the scope of the coverage is limited, and the
premiums are high. Due to these factors, the Airport, in consultation with the City’s Director of Risk
Management, has elected not to secure such coverage but to purchase War Perils Liability Coverage as
part of its aviation liability program.
The Airport also carries commercial property insurance coverage for full replacement value on all
facilities at the Airport owned by the Airport, subject to a limit of $1.0 billion per occurrence subject to a
deductible of $500 per occurrence. This policy includes flood coverage up to a $10.0 million sub-limit.
The Airport also carries business interruption and extra expenses insurance up to a $100.0 million pooled
sub-limit.
Additionally, tenants and contractors on all contracts are required to carry commercial general and
automobile liability insurance in various amounts, naming the Airport as additionally insured. The Airport
carries public officials’ liability and employment practices liability coverage of $5.0 million, subject to a
deductible of $100 per occurrence for public officials’ and public entity liability matters, and $250 per
occurrence for each employment practices’ liability matters. The Airport also carries insurance for excess
auto, public employee dishonesty, fine arts, cyber liability, and watercraft liability for Airport fire and
rescue vessels, and target range liability for the San Francisco Police Department’s firearms range
located at the Airport.
The Port carries the following insurance (listed coverage limits and related deductible amounts are
effective July 1, 2023): 1) marine general liability coverage of $100.0 million, subject to a deductible of
$100 per occurrence, inclusive of hull protection and indemnity coverage of $1.0 million per occurrence;
2) machinery and equipment breakdown coverage, including business interruption, of $100.0 million,
subject to a deductible of $25; 3) commercial property insurance for Port facilities, subject to a maximum
coverage of $300.0 million and a deductible of $5.0 million per occurrence (increased from a maximum
of $140.0 million and a deductible of $10.0 million per occurrence before July 1, 2022); 4) public officials
and employee practices liability coverage of $5.0 million, subject to a deductible of $50 per occurrence;
and 5) special events for cruise terminals at Pier 27, 29 and 35 coverage of $1.0 million and no
deductible. The Port also carries insurance coverage for employee dishonesty, auto liability, property
damage for certain high value Port vehicles, water pollution, and data processing equipment. In addition
to the above, the Port requires most of its tenants, licensees, and contractors on all contracts to carry
commercial general liability insurance in various amounts naming the Port and the City as additional

CITY AND COUNTY OF SAN FRANCISCO
Notes to Basic Financial Statements (Continued)
June 30, 2023
(Dollars in Thousands)
186
insured parties. Tenants whose operations pose a significant environmental risk are also required to
post an environmental oversight deposit and an environmental performance deposit.
The SFMTA risk treatment program encompasses both self-insured and insured methods. Insurance
purchase is generally coordinated through the City’s Risk Management Division, and in some specific
cases, directly by the agency. Self-insurance is when the City manages the risks internally and
administers, adjusts, settles, defends, and pays claims from budgeted resources, i.e., pay-as-you-go.
SFMTA’s general policy is to first evaluate self-insurance for the risks of loss to which it is exposed.
When economically more viable or when required by debt financing covenants, SFMTA purchases
insurance as necessary or required.
Risks Coverage
a. General/Transit Liability Self-insured
b. Workers' Compensation Self-insured
c. Property Self-insured and purchase insurance
d. Employee (transit operators) Purchase insurance
e.
Directors and Officers
Purchase insurance
f. Active Assailant Purchase insurance
The SFMTA is self-insured on general liability. Through coordination with the Controller and City
Attorney’s Office, the SFMTA’s general liability payments are addressed through pay-as-you-go funding
as part of the budgetary process as well as a reserve that is increased each year by approximately $3.0
million. As of June 30, 2023, the reserve was $36.5 million. In addition, the annual budget for claims
was $8.6 million for fiscal year 2022-23. Claim liabilities are actuarially determined anticipated claims
and projected timing of disbursement, considering recent claim settlement trends, inflation, and other
economic social factors.
The SFMTA purchases property insurance on its facilities, light rail cars, and personal property. Also,
insurance is purchased for scheduled City parking garages covering blanket property and business
interruptions. Damages to facilities and property outside of the specified schedules are self-insured.
For SFMTA contractors, SFMTA requires each contractor to provide its own insurance, the traditional
insurance ensuring that the full scope of work be covered with satisfactory levels to limit the risk
exposure to City and SFMTA’s property. SFMTA has purchased group life insurance and a Group
Felonious Assault Coverage Insurance for transit operators per a Memorandum of Understanding with
the Transport Workers’ Union and has purchased insurance to cover errors and omissions of its board
members and senior management. SFMTA has purchased an active assailant insurance to cover third
party bodily injury, property damage, business interruption and crisis management.
Settlements have not exceeded insurance coverage during the past three years.
Estimated Claims Payable
Numerous lawsuits are pending or threatened against the City. The City’s liability as of June 30, 2023,
has been actuarially determined and includes an estimate of incurred but not reported losses and
allocated loss adjustment expenses.

CITY AND COUNTY OF SAN FRANCISCO
Notes to Basic Financial Statements (Continued)
June 30, 2023
(Dollars in Thousands)
187
Changes in the reported estimated claims payable since July 1, 2021, resulted from the following
activity:
Breakdown of the estimated claims payable on June 30, 2023, is follows:
Workers’ Compensation
The City self-insures for workers’ compensation coverage. The City’s liability as of June 30, 2023, has
been actuarially determined and includes an estimate of incurred but not reported losses. The total
amount estimated to be payable for claims incurred as of June 30, 2023, was $653.8 million, which is
reported in the appropriate individual funds in accordance with the City’s accounting policies.
Changes in the reported accrued workers’ compensation since July 1, 2021, resulted from the following
activity:
Breakdown of the accrued workers' compensation liability on June 30, 2023, is as follows:
Current
Beginning Year Claims Ending
Fiscal Year and Changes Claim Fiscal Year
Fiscal Year Liability in Estimates Payments Liability
2021-2022 390,355$ 168,306$ (94,625)$ 464,036$
2022-2023 464,036 219,401 (147,390) 536,047
Governmental activities:
Current portion of estimated claims payable………………………………..…
155,464$
Long-term portion of estimated claims payable………………………..……….
260,222
Total ………………………………………………………….………………..…
415,686$
Business-type activities:
Current portion of estimated claims payable……………………………...……
46,288$
Long-term portion of estimated claims payable………………………………...…
74,073
Total …………………………………………………………………….....
120,361$
Current
Beginning Year Claims Ending
Fiscal Year and Changes Claim Fiscal Year
Fiscal Year Liability in Estimates Payments Liability
2021-2022 536,939$ 195,741$ (119,551)$ 613,129$
2022-2023 613,129 169,773 (129,066) 653,836
Governmental activities:
Current portion of accrued workers' compensation liability…………….
72,304$
Long-term portion of accrued workers' compensation liability………………..
305,486
Total ………………………………………………………….…………..
377,790$
Business-type activities:
Current portion of accrued workers' compensation liability………………..
50,502$
Long-term portion of accrued workers' compensation liability………………….…
225,544
Total ………………………………………………………….……………..…
276,046$
CITY AND COUNTY OF SAN FRANCISCO
Notes to Basic Financial Statements (Continued)
June 30, 2023
(Dollars in Thousands)
188
(19) SUBSEQUENT EVENTS
(a) Debt Issuance
In July 2023, the Water Enterprise issued its San Francisco Water Revenue Bonds, 2023 Sub-Series
A (Regional and Local Water, Tax-exempt) and Sub-Series B (Hetch Hetchy Water, Tax-exempt) in the
aggregate principal amount of $414.0 million to (i) refund principal and interest on Commercial Paper
Notes issued to finance and refinance a portion of the design, acquisition and construction of various
capital projects of benefit to the SFPUC’s Water Enterprise, (ii) finance and refinance a portion of the
design, acquisition and construction of various capital projects of benefit to the SFPUC’s Water
Enterprise, and (iii) fund capitalized interest through May 1, 2025 and other financing costs.
In July 2023, the Water Enterprise entered into new CP dealer agreements with BofA Securities, Inc.,
J.P. Morgan Securities LLC and Wells Fargo Bank, National Association for the offering and sale, and
remarketing from time to time of water commercial paper program notes. The new CP dealer
agreements with BofA Securities, Inc., J.P. Morgan Securities LLC and Wells Fargo Bank, National
Association are scheduled to expire on July 10, 2028.
In August 2023, the Water Enterprise issued its San Francisco Water Revenue Bonds, 2023 Sub-
Series C (Tax-exempt Refunding – WSIP, Green Bonds), and Sub-Series D (Tax-exempt Refunding-
Local Water) an aggregate principal amount of $514.9 million to refund all or a portion of various series
of the SFPUC’s outstanding bonds.
In October 2023, Hetch Hetchy issued its San Francisco Power Revenue Bonds, 2023 Series A with a
principal of $123.9 million to finance or refinance Power Enterprise projects through the refunding and
retirement of CP issued as interim financing for such projects in furtherance of the Power Capital
Improvement Program.
In November 2023, the City issued Certificates of Participation Series 2023A (Affordable Housing and
Community Projects) (2023A Certificates) and Series 2023B (Multiple Capital Improvement Projects)
(2023B Certificates) with the principal amount of $103.4 million and $80.0 million, respectively. The
2023A certificates were issued to finance and refinance certain capital improvement, affordable
housing, and community facilities projects within the City and to pay the cost of issuance of the 2023A
Certificates. The 2023B Certificates, together with the 2023A Certificates were issued to finance and
refinance certain capital improvement projects within the City, including retirement of certain
commercial paper notes of the City issued for such purpose and to pay the cost of issuance of the
2023B Certificates. The 2023A Certificates bear interest rates ranging from 6.0% to 6.375% to mature
from October 2024 through October 2043. The 2023B Certificates bear interest rates ranging from 5.0%
to 4.5% to mature from October 2024 through October 2043.
In November 2023, the Airport issued $794.3 million of its Series 2023C and Series 2023D Bonds for
the purpose of refunding $497.8 million in outstanding CP notes, refunding $241.8 million in outstanding
Series 2013A bonds, funding deposits to a debt service reserve account, and paying costs of issuance.
The financial statements reflected the refunded amounts as noncurrent liabilities. Moody’s and Fitch
assigned credit ratings of “A1” and “A+” to these bonds.
In December 2023, the City, on behalf of the City and County of San Francisco Special Tax District No.
2020-1 (Mission Rock Facilities and Services) issued Special Tax Bonds, Series 2023A (Development
Special Tax Bonds), Series 2023B (Office Special Tax Bonds), and Series 2023C (Shoreline Tax Zone
1 Special Tax Bonds) (the 2023A Bonds, 2023B Bonds, and 2023C Bonds) in the original par amounts
of $8.8 million, $19.1 million, and $18.0 million, respectively. The 2023A Bonds, 2023B Bonds, and
2023C Bonds were issued to fund horizonal improvements for Phase 1A and 1B of the Mission Rock
Project. The 2023A Bonds bear interest rates ranging from 5.0% to 5.75%, with principal amortizing
from September 2024 through September 2050. The 2023B Bonds bear interest rates ranging from
5.0% to 5.75%, with principal amortizing from September 2024 through September 2053. The 2023C
CITY AND COUNTY OF SAN FRANCISCO
Notes to Basic Financial Statements (Continued)
June 30, 2023
(Dollars in Thousands)
189
Bonds bear interest rates ranging from 5.0% to 5.75%, with principal amortizing from September 2024
through September 2053.
The 2023A Bonds, 2023B Bonds, and 2023C Bonds are secured under provisions of their respective
Fiscal Agent Agreements, and will be payable solely from the revenues and funds pledged under those
agreements. The 2023A Bonds were issued on a parity basis to the outstanding City and County of
San Francisco Special Tax District No. 2020-1 (Mission Rock Facilities and Services) Development
Special Tax Bonds, Series 2021A and Development Special Tax Bonds, Series 2021B and
2021C. Revenues for the 2023A Bonds, 2023B Bonds, and 2023C Bonds generally consist of
Development Special Tax Revenues, Office Special Tax Revenues, and Shoreline (tax zone 1) Special
Tax Revenues, respectively. Additionally, the 2023A Bonds are secured by tax increment of the City’s
Infrastructure Financing District No. 2, Project Area I pledged to such obligations under a Pledge
Agreement (among the IFD, City on behalf the District, and the Fiscal Agent). The 2023A Bonds, 2023B
Bonds, and 2023C Bonds are not payable from any revenues or assets of the City. Neither the faith
and credit nor the taxing power of the City, the State, or any political subdivision thereof are pledged
for the payment of the principal or interest on the 2023A Bonds, 2023B Bonds, or the 2023C Bonds.
In December 2023, the City, on behalf of Improvement Area No. 2 of the City and County of San
Francisco Community Facilities District No. 2016-1 (Treasure Island) issued Special Tax Bonds, Series
2023A in the par amount of $17.0 million (2023A IA2 Bonds). The 2023A Bonds were issued to fund
the acquisition of certain public facilities and improvements for the Treasure Island/Yerba Buena Island
Development Project. The 2023A Bonds bear interest rates ranging from 5.0% to 5.5%, with principal
amortizing from September 2024 through September 2053.
The 2023A IA2 Bonds were issued on a parity basis to the outstanding of the City and County of San
Francisco Community Facilities District No. 2016-1 (Treasure Island) issued Special Tax Bonds, Series
2022A. The 2023A IA2 Bonds are secured under the provisions of a Fiscal Agent Agreement and will
be payable solely from Special Tax Revenues and funds pledged under that agreement. The 2023 IA2
Bonds are not payable from any revenues or assets of the City. Neither the faith and credit nor the
taxing power of the City, the State, or any political subdivision thereof are pledged for the payment of
the principal or interest on the 2023 IA2 Bonds.
In December 2023, the City, on behalf of the and County of San Francisco Infrastructure and
Revitalization Financing District No. 1 (Treasure Island) issued Tax Increment Revenue Bonds, Series
2023A (Facilities Increment) and Series 2023B (Housing Increment) (2023A IRFD Bonds and 2023B
IRFD Bonds) in the par amounts of $7.6 million and $1.6 million, respectively. The 2023A IRFD Bonds
were issued to fund the acquisition of certain public facilities and improvements for the Treasure
Island/Yerba Buena Island Development Project, and the 2023B IRFD Bonds were issued to finance
the acquisition and construction of affordable housing on Treasure Island. The 2023A IRFD Bonds bear
interest rates ranging from 5.0% to 5.5%, with principal amortizing from September 2024 through
September 2053. The 2023B IRFD Bonds bear an interest rate of 5.5%, with principal amortizing from
September 2024 through September 2053.
The 2023A IRFD Bonds and 2023B IRFD Bonds were issued on a parity basis to the outstanding City
and County of San Francisco Infrastructure and Revitalization Financing District No. 1 (Treasure Island)
Tax Increment Revenue Bonds, Series 2022A (Facilities Increment) and Series 2022B (Housing
Increment), respectively. The 2023A IRFD Bonds and 2023B IRFD Bonds are secured under provisions
of separate Indentures of Trust and are payable solely from Pledged Facilities Increment and Pledged
Housing Increment, respectively, pledged under those agreements. Revenues generally consist of tax
increment of the City’s Infrastructure Revitalization and Financing District No. 1, Project Areas A, B, C,
D, and E. The 2023A IRFD Bonds and 2023B IRFD Bonds are not payable from any revenues or assets
of the City. Neither the faith and credit nor the taxing power of the City, the State, or any political
subdivision thereof are pledged for the payment of the principal or interest on the 2023A IRFD Bonds
or 2023B IRFD Bonds.
CITY AND COUNTY OF SAN FRANCISCO
Notes to Basic Financial Statements (Continued)
June 30, 2023
(Dollars in Thousands)
190
(b) Others
Ratings Downgrade
In July 2023, Moody’s revised the rating outlook on the City’s long-term ratings from stable to negative
while concurrently affirming the “Aaa” ratings on the City’s issuer rating and on approximately $2.59
billion in outstanding general obligation bonds. Moody’s also affirmed the “Aa1” and “Aa2” rating on the
City’s approximately $1.4 billion in lease-backed obligations. The City also has approximately $19.5
billion in additional debt outstanding across its governmental and enterprise activities unaffected by this
rating action.
Laguna Honda Hospital Settlement Agreement
In November 2022, Laguna Honda Hospital (LHH) reached a settlement with the California Department
of Public Health (CDPH) and the federal Centers for Medicare and Medicaid Services (CMS) to allow
LHH to continue to receive funding through November 2023.
In August 2023, LHH was recertified, effective immediately, in the Medicaid Provider Program. In
September 2023, LHH applied for Medicare recertification and is anticipating completion of a CMS
survey by December 2023.
A new admission timeline and census projections cannot be developed until the facility is certified by
both Medi-Cal and Medicare, as a result revenue projections for fiscal year 2023-24 have not been
updated from fiscal year 2023-24 budget to reflect the recertification.
Airport New Lease and Use Agreement
A new ten-year 2023 Lease and Use Agreement became effective on July 1, 2023, and is set to expire
on June 30, 2033.

CITY AND COUNTY OF SAN FRANCISCO
Required Supplementary Information (Unaudited) –
Schedules of the City’s Proportionate Share of the Net Pension Liability/(Asset)
June 30, 2023
(Dollars in Thousands)
191

CITY AND COUNTY OF SAN FRANCISCO
Required Supplementary Information (Unaudited) –
Schedules of the City’s Proportionate Share of the Net Pension Liability/(Asset) (Continued)
June 30, 2023
(Dollars in Thousands)
192
City
SFERS Plan
City
Transportation
Authority
Classic &
PEPRA
Successor
Agency Classic
& PEPRA
Treasure
Island
Proportion of net pension liability 94.1288% -0.1541% 0.0230% 0.2908% 0.0002%
Proportionate share of the
net pension liability (asset) 4,213,809$ (15,793)$ 2,352$ 29,803$ 25$
Covered payroll 3,186,405$ 359$ 4,396$ 6,384$ -$
Proportionate share of the net pension liability
(asset) as a percentage of covered payroll 132.24% -4399.16% 53.50% 466.84% N/A
Plan fiduciary net position
as a percentage of total pension liability 85.30% 75.26% 75.26% 75.26% 75.26%
City
SFERS Plan
City
Transportation
Authority
Classic &
PEPRA
Successor
Agency Classic
& PEPRA
Treasure
Island
Proportion of net pension liability 94.1042% -0.1573% 0.0215% 0.2820% 0.0003%
Proportionate share of the
net pension liability (asset) 4,030,207$ (15,154)$ 2,069$ 27,178$ 28$
Covered payroll 3,045,153$ 390$ 4,039$ 5,742$ -$
Proportionate share of the net pension liability
(asset) as a percentage of covered payroll 132.35% -3885.64% 51.22% 473.32% N/A
Plan fiduciary net position
as a percentage of total pension liability 85.20% 75.26% 75.26% 75.26% 75.26%
City
SFERS Plan
City
Transportation
Authority
Classic &
PEPRA
Successor
Agency Classic
& PEPRA
Treasure
Island
Proportion of net pension liability 94.0674% -0.1388% 0.0216% 0.2751% 0.0003%
Proportionate share of the
net pension liability (asset) 4,697,131$ (13,766)$ 2,142$ 27,280$ 28$
Covered payroll 2,880,112$ 344$ 4,202$ 5,042$ -$
Proportionate share of the net pension liability
(asset) as a percentage of covered payroll 163.09% -4001.74% 50.97% 541.05% N/A
Plan fiduciary net position
as a percentage of total pension liability 81.78% 73.31% 73.31% 73.31% 73.31%
For the year ended June 30, 2020
CalPERS Miscellaneous Plans
For the year ended June 30, 2019
CalPERS Miscellaneous Plans
CalPERS Miscellaneous Plans
For the year ended June 30, 2018

CITY AND COUNTY OF SAN FRANCISCO
Required Supplementary Information (Unaudited) –
Schedules of the City’s Proportionate Share of the Net Pension Liability/(Asset) (Continued)
June 30, 2023*
(Dollars in Thousands)
193
City
SFERS Plan
City
Transportation
Authority
Classic &
PEPRA
Successor
Agency Classic
& PEPRA
Treasure
Island
Proportion of net pension liability 94.2175% -0.1469% 0.0204% 0.2691% 0.0003%
Proportionate share of the
net pension liability (asset) 5,476,654$ (12,711)$ 1,765$ 23,281$ 27$
Covered payroll 2,681,695$ 329$ 3,644$ 3,769$ -$
Proportionate share of the net pension liability
(asset) as a percentage of covered payroll 204.22% -3863.53% 48.44% 617.70% N/A
Plan fiduciary net position
as a percentage of total pension liability 77.61% 74.06% 74.06% 74.06% 74.06%
City
SFERS Plan
City
Transportation
Authority
Classic &
PEPRA
Successor
Agency Classic
& PEPRA
Treasure
Island
Proportion of net pension liability 93.9032% -0.2033% 0.0188% 0.2413% 0.0004%
Proportionate share of the
net pension liability (asset) 2,156,049$ (13,956)$ 1,288$ 16,563$ 24$
Covered payroll 2,529,879$ 319$ 3,684$ 3,427$ -$
Proportionate share of the net pension liability
(asset) as a percentage of covered payroll 85.22% -4374.92% 34.96% 483.31% 0.00%
Plan fiduciary net position
as a percentage of total pension liability 89.90% 78.40% 78.40% 78.40% 78.40%
City
SFERS Plan
City
Transportation
Authority
Classic &
PEPRA
Successor
Agency Classic
& PEPRA
Treasure
Island
Proportion of net pension liability 93.7829% -0.1829% 0.0208% 0.2550% N/A
Proportionate share of the
net pension liability (asset) 1,660,365$ (11,381)$ 1,299$ 15,870$ -$
Covered payroll 2,398,979$ 303$ 3,264$ 3,962$ -$
Proportionate share of the net pension liability
(asset) as a percentage of covered payroll 69.21% -3756.11% 39.80% 400.56% -
Plan fiduciary net position
as a percentage of total pension liability 91.84% 80.43% 80.43% 80.43% -
CalPERS Miscellaneous Plans
CalPERS Miscellaneous Plans
For the year ended June 30, 2016
CalPERS Miscellaneous Plans
For the year ended June 30, 2015
For the year ended June 30, 2017

CITY AND COUNTY OF SAN FRANCISCO
Required Supplementary Information (Unaudited) –
Schedules of the City’s Proportionate Share of the Net Pension Liability/(Asset) (Continued)
June 30, 2023*
(Dollars in Thousands)
194
Notes to Schedule:
SFERS Plan
Benefit Changes – There were no changes in benefits during the measurement period ended June 30,
2022, 2021, 2020, 2019 and 2018. The impact of benefit changes for the year ended June 30, 2017, which
was $1.22 billion, was recognized immediately as pension expense.
Changes of Assumptions – For the measurement period ended June 30, 2022, the discount rate was
decreased from 7.40% to 7.20%. There were no changes in the discount rate for the measurement period
ended June 30, 2021 and 2020. For the measurement period ended June 30, 2019, the discount rate was
decreased from 7.50% to 7.40% There were no changes in the discount rate for the measurement period
ended June 30, 2018. For the measurement ended June 30, 2017, the discount rate was increased from
7.46% to 7.50%.
CalPERS Miscellaneous Plans
Benefit Changes – There were no changes to benefit terms that applied to all members of the Public Agency
Pool. However, individual employers in the Plan may have provided a benefit improvement to their
employees by granting Two Years Additional Service Credit to members retiring during a specific time
period (a.k.a. Golden Handshakes).
Changes of Assumptions – For the measurement period ended June 30, 2022, the discount rate was
decreased from 7.15% to 6.90%. There were no changes in the discount rate for the measurement period
ended June 30, 2021.
* Fiscal year 2014-15 was the first year of implementation of GASB No. 68, therefore only nine years of
information is shown

CITY AND COUNTY OF SAN FRANCISCO
Required Supplementary Information (Unaudited) –
Schedules of Changes in Net Pension Liability and Related Ratios
June 30, 2023
(Dollars in Thousands)
195
City CalPERS Safety Plan
2023 2022 2021 2020
Total pension liability:
Service cost.......................................................................... 27,820$ 27,940$ 29,508$ 30,109$
Interest on the total pension liability................................ 109,898 107,607 102,990 98,555
Changes of assumptions.................................................. 45,696 - - -
Differences between expected and actual experience (19,162) 2,028 (1,465) (7,134)
Benefit payments, including refunds of
employee contributions................................................... (77,028) (71,533) (66,815) (62,934)
Net change in total pension liability................................. 87,224 66,042 64,218 58,596
Total pension liability, beginning...................................... 1,590,799 1,524,757 1,460,539 1,401,943
Total pension liability, ending........................................... 1,678,023$ 1,590,799$ 1,524,757$ 1,460,539$
Plan fiduciary net position:
Plan to plan resource movement..................................... -$ -$ -$ -$
Contributions from the employer...................................... 55,172 51,620 49,455 43,789
Contributions from employees......................................... 7,885 8,342 8,947 9,141
Net investment income/(loss)........................................... (109,224) 269,621 57,048 71,212
Benefit payments, including refunds of
employee contributions................................................... (77,028) (71,533) (66,815) (62,934)
Administrative expenses.................................................... (901) (1,188) (1,611) (772)
Other miscellaneous income/(expense)........................ - - - 2
Net change in plan fiduciary net position........................ (124,096) 256,862 47,024 60,438
Plan fiduciary net position, beginning............................. 1,446,527 1,189,665 1,142,641 1,082,203
Plan fiduciary net position, ending................................... 1,322,431$ 1,446,527$ 1,189,665$ 1,142,641$
355,592$ 144,272$ 335,092$ 317,898$
Plan fiduciary net position as a percentage of the
total pension liability........................................................... 78.81% 90.93% 78.02% 78.23%
Covered payroll....................................................................... 85,571$ 93,702$ 92,968$ 94,522$
Plan net pension liability as a percentage of the
covered payroll..................................................................... 415.55% 153.97% 360.44% 336.32%
Plan net pension liability, ending...........................................

CITY AND COUNTY OF SAN FRANCISCO
Required Supplementary Information (Unaudited) –
Schedules of Changes in Net Pension Liability and Related Ratios (Continued)
June 30, 2023*
(Dollars in Thousands)
196
Notes to Schedule:
Benefit Changes – The figures above do not include any liability impact that may have resulted from plan
changes which occurred on or after the June 30, 2021, valuation date. This applies for voluntary benefit
changes as well as any offers of Two Year Additional Service Credit (a.k.a. Golden Handshakes).
Changes of Assumptions – The discount rate decreased from 7.15% to 6.90% for the measurement period
ended June 30, 2022. None in 2019 - 2021. In 2018, demographic assumptions and inflation rate were
changed in accordance to the CalPERS Experience Study and Review of Actuarial Assumptions December
2017. There were no changes in the discount rate for the measurement period ended June 30, 2021. The
discount rate decreased from 7.65% to 7.15% for the measurement period ended June 30, 2017.
* Fiscal year 2014-15 was the first year of implementation of GASB No. 68, therefore only nine years of
information is shown
City CalPERS Safety Plan
2019 2018 2017 2016 2015
Total pension liability:
Service cost.......................................................................... 34,006$ 33,886$ 31,141$ 30,987$ 32,688$
Interest on the total pension liability................................ 94,305 88,729 85,094 80,057 76,177
Changes of assumptions.................................................. 2,492 75,057 - (19,949) -
Differences between expected and actual experience 6,909 (14,353) 950 (14,218) -
Benefit payments, including refunds of
employee contributions................................................... (56,625) (51,579) (47,774) (44,699) (41,387)
Net change in total pension liability................................. 81,087 131,740 69,411 32,178 67,478
Total pension liability, beginning...................................... 1,320,856 1,189,116 1,119,705 1,087,527 1,020,049
Total pension liability, ending........................................... 1,401,943$ 1,320,856$ 1,189,116$ 1,119,705$ 1,087,527$
Plan fiduciary net position:
Plan to plan resource movement..................................... (3)$ -$ -$ (4)$ -$
Contributions from the employer...................................... 31,189 30,575 23,640 20,718 20,613
Contributions from employees......................................... 9,359 10,307 14,310 15,061 15,216
Net investment income...................................................... 85,351 104,383 4,731 20,469 138,628
Benefit payments, including refunds of
employee contributions................................................... (56,625) (51,579) (47,774) (44,699) (41,387)
Administrative expenses.................................................... (1,585) (1,366) (567) (1,048) -
Other miscellaneous income/(expense)........................ (3,011) - - - -
Net change in plan fiduciary net position........................ 64,675 92,320 (5,660) 10,497 133,070
Plan fiduciary net position, beginning............................. 1,017,528 925,208 930,868 920,371 787,301
Plan fiduciary net position, ending................................... 1,082,203$ 1,017,528$ 925,208$ 930,868$ 920,371$
319,740$ 303,328$ 263,908$ 188,837$ 167,156$
Plan fiduciary net position as a percentage of the
total pension liability........................................................... 77.19% 77.04% 77.81% 83.14% 84.63%
Covered payroll....................................................................... 106,765$ 107,812$ 110,139$ 109,462$ 111,311$
Plan net pension liability as a percentage of the
covered payroll..................................................................... 299.48% 281.35% 239.61% 172.51% 150.17%
Plan net pension liability, ending...........................................

CITY AND COUNTY OF SAN FRANCISCO
Required Supplementary Information (Unaudited) –
Schedules of Changes in Total Pension Liability and Related Ratios
June 30, 2023*
(Dollars in Thousands)
197
Notes to Schedule:
No assets are accumulated in a trust that meet the criteria in GASB Statement No. 73 to pay related
benefits.
Benefit Changes – There were no changes to benefits terms for the measurement period ended June 30,
2022.
Changes of Assumptions – The discount rate was changed from 2.16% to 3.54% in the measurement
period ended June 30, 2022. No changes in discount rate for the measurement period ended June 30,
2021. The discount rate decreased from 2.21% in the measurement period ended June 30, 2020, to 2.16%
in the measurement period ended June 30, 2021. The discount rate was changed from 3.87% in the
measurement period ended June 30, 2018, to 3.50% in the measurement period ended June 30, 2019.
* Fiscal year 2016-17 was the first year of implementation of GASB Statement No. 73, therefore only seven
years of information is shown
City Replacement Benefits Plan
2023 2022 2021 2020 2019 2018 2017
Plan total pension liability:
Service cost............................................................................... 2,894$ 2,571$ 1,976$ 1,286$ 1,298$ 1,605$ 956$
Interest....................................................................................... 4,726 4,076 4,776 3,538 2,998 2,218 2,112
Changes of benefits................................................................ - - - - - - 10,310
Differences between expected and actual experience..... (24,639) 24,547 7,800 13,588 564 15,326 -
Changes of assumptions...................................................... (42,151) 7,274 37,013 29,565 5,540 (10,290) 11,516
Benefit payments..................................................................... (4,473) (4,097) (3,634) (2,958) (2,442) (3,164) (1,332)
Net change in total pension liability...................................... (63,643) 34,371 47,931 45,019 7,958 5,695 23,562
Total pension liability, beginning.......................................... 219,574 185,203 137,272 92,253 84,295 78,600 55,038
155,931$ 219,574$ 185,203$ 137,272$ 92,253$ 84,295$ 78,600$
Covered-employee payroll........................................................ 3,589,396$ 3,470,495$ 3,414,923$ 3,225,854$ 3,082,273$ 2,919,519$ 2,719,691$
Plan total pension liability as a percentage of the
covered-employee payroll...................................................... 4.34% 6.33% 5.42% 4.26% 2.99% 2.89% 2.89%
Plan total pension liability, ending: ...............................................

CITY AND COUNTY OF SAN FRANCISCO
Required Supplementary Information (Unaudited) –
Schedules of Employer Contributions – Pension Plans
June 30, 2023
(Dollars in Thousands)
198

CITY AND COUNTY OF SAN FRANCISCO
Required Supplementary Information (Unaudited) –
Schedules of Employer Contributions – Pension Plans (Continued)
June 30, 2023
(Dollars in Thousands)
199

CITY AND COUNTY OF SAN FRANCISCO
Required Supplementary Information (Unaudited) –
Schedules of Employer Contributions – Pension Plans (Continued)
June 30, 2023*
(Dollars in Thousands)
200
* Fiscal year 2014-15 was the first year of implementation of GASB No. 68, therefore only nine years of
information is shown.
** In fiscal year 2014-15, the actuarially determined contributions were based on an estimate. The City
made a $0.1 million adjustment to align the estimated employer contribution amount with the actual
employer contribution per the 2015 agent-multiple employer CalPERS report for the CalPERS Safety
Plan. Due to the early implementation of GASB Statement No. 82, the City decreased the actuarially
determined contributions for the City SFERS plan to deduct the employer pickup in the amount of $8.6
million.
City
SFERS Plan
City
Transportation
Authority
Successor
Agency
Treasure
Island
CalPERS
Safety Plan
Actuarially determined contributions
(1) **
556,511$ 31$ 400$ 598$ 2$ 20,718$
Contributions in relation to the
actuarially determined contributions
(1)
(556,511) (31) (400) (598) (2) (20,718)
Contribution deficiency (excess) -$ -$ -$ -$ -$ -$
Covered payroll 2,529,879$ 319$ 3,684$ 3,427$ -$ 109,462$
Contributions as a percentage of
covered payroll 22.00% 9.72% 10.86% 17.45% N/A 18.93%
(1)
Contractually required contributions is an actuarially determined contribution for all cost-sharing plans.
CalPERS Miscellaneous Plans
For the year ended June 30, 2015

CITY AND COUNTY OF SAN FRANCISCO
Required Supplementary Information (Unaudited) –
Schedules of Employer Contributions – Pension Plans (Continued)
June 30, 2023
(Dollars in Thousands)
201
Valuation date............................... July 1, 2020
Actuarial cost method....................
Entry-age normal cost method
Amortization method...................... Level annual percentage of payroll
Remaining amortization period........ Closed 15-year period
Asset valuation method.................. 5 year smoothed market
Investment rate of return.................
7.40% (net of investment expenses)
Inflation......................................... 2.50%
Projected salary increase...............
Wage inflation component: 3.25%
Valuation date............................... July 1, 2019
Actuarial cost method....................
Entry-age normal cost method
Amortization method...................... Level annual percentage of payroll
Remaining amortization period........ Closed 15-year period
Asset valuation method.................. 5 year smoothed market
Investment rate of return.................
7.40% (net of investment expenses)
Inflation......................................... 2.75%
Projected salary increase...............
Wage inflation component: 3.50%
Valuation date............................... July 1, 2018
Actuarial cost method....................
Entry-age normal cost method
Amortization method...................... Level annual percentage of payroll
Remaining amortization period........ Closed 15-year period
Asset valuation method.................. 5 year smoothed market
Investment rate of return.................
7.40% (net of investment expenses)
Inflation......................................... 3.00% compounded annually
Projected salary increase...............
Wage inflation component: 3.50%
Methods and assumptions used to determine FY 2022-23 contribution rates to SFERS Plan
Methods and assumptions used to determine FY 2021-22 contribution rates to SFERS Plan
Methods and assumptions used to determine FY 2020-21 contribution rates to SFERS Plan

CITY AND COUNTY OF SAN FRANCISCO
Required Supplementary Information (Unaudited) –
Schedules of Employer Contributions – Pension Plans (Continued)
June 30, 2023
(Dollars in Thousands)
202
Valuation date............................... July 1, 2017
Actuarial cost method....................
Entry-age normal cost method
Amortization method...................... Level annual percentage of payroll
Remaining amortization period........ Closed 15-year period
Asset valuation method.................. 5 year smoothed market
Investment rate of return.................
7.50% (net of investment expenses)
Inflation......................................... 3.00% compounded annually
Projected salary increase...............
Wage inflation component: 3.50%
Valuation date...............................
July 1, 2016
Actuarial cost method....................
Entry-age normal cost method
Amortization method......................
Level annual percentage of payroll
Remaining amortization period........ Closed 15-year period
Asset valuation method..................
5 year smoothed market
Investment rate of return.................
7.50% (net of investment expenses)
Inflation.........................................
3.25% compounded annually
Projected salary increase...............
Wage inflation component: 3.75%
Valuation date...............................
July 1, 2015
Actuarial cost method....................
Entry-age normal cost method
Amortization method......................
Level annual percentage of payroll
Remaining amortization period........ Closed 15-year period
Asset valuation method..................
5 year smoothed market
Investment rate of return.................
7.50% (net of investment expenses)
Inflation.........................................
3.25% compounded annually
Projected salary increase...............
Wage inflation component: 3.75%
Methods and assumptions used to determine FY 2019-20 contribution rates to SFERS Plan
Methods and assumptions used to determine FY 2018-19 contribution rates to SFERS Plan
Methods and assumptions used to determine FY 2017-18 contribution rates to SFERS Plan

CITY AND COUNTY OF SAN FRANCISCO
Required Supplementary Information (Unaudited) –
Schedules of Employer Contributions – Pension Plans (Continued)
June 30, 2023
(Dollars in Thousands)
203
Valuation date............................... July 1, 2014
Actuarial cost method....................
Entry-age normal cost method
Amortization method...................... Level annual percentage of payroll
Remaining amortization period........ Closed 15-year period
Asset valuation method.................. 5 year smoothed market
Investment rate of return.................
7.50% (net of investment expenses)
Inflation......................................... 3.25% compounded annually
Projected salary increase...............
Wage inflation component: 3.75%
Valuation date............................... July 1, 2013
Actuarial cost method....................
Entry-age normal cost method
Amortization method...................... Level annual percentage of payroll
Remaining amortization period........ Rolling 15-year period
Asset valuation method.................. 5 year smoothed market
Investment rate of return.................
7.58% (net of investment expenses)
Inflation......................................... 3.33% compounded annually
Projected salary increase...............
Wage inflation component: 3.83%
Valuation date............................... July 1, 2012
Actuarial cost method....................
Entry-age normal cost method
Amortization method...................... Level annual percentage of payroll
Remaining amortization period........ Rolling 15-year period
Asset valuation method.................. 5 year smoothed market
Investment rate of return.................
7.58% (net of investment expenses)
Inflation......................................... 3.33% compounded annually
Projected salary increase...............
Wage inflation component: 3.83%
Methods and assumptions used to determine FY 2014-15 contribution rates to SFERS Plan
Methods and assumptions used to determine FY 2015-16 contribution rates to SFERS Plan
Methods and assumptions used to determine FY 2016-17 contribution rates to SFERS Plan

CITY AND COUNTY OF SAN FRANCISCO
Required Supplementary Information (Unaudited) –
Schedules of Employer Contributions – Pension Plans (Continued)
June 30, 2023
(Dollars in Thousands)
204
Valuation date............................... June 30, 2020
Actuarial cost method....................
Entry-age normal cost method
Amortization method...................... Level percent of payroll
Amortization period........................ Gains and losses over a fixed 30-year period with increases or decreases
in the rate spread directly over a 5-year period (Miscellaneous)
Experience gains and losses over a fixed 30-year period and spread rate
increases or decreases over a 5-year period (Safety)
Asset valuation method.................. Actuarial Value of Assets
Investment rate of return.................
7.00%, net of pension plan investment and administrative expenses, includes
inflation
Projected salary increase...............
Varies by Entry-Age and Service
Inflation......................................... 2.500%
Payroll growth............................... 2.750%
Valuation date............................... June 30, 2019
Actuarial cost method....................
Entry-age normal cost method
Amortization method...................... Level percent of payroll
Amortization period........................ Gains and losses over a fixed 30-year period with increases or decreases
in the rate spread directly over a 5-year period (Miscellaneous)
Experience gains and losses over a fixed 30-year period and spread rate
increases or decreases over a 5-year period (Safety)
Asset valuation method.................. Actuarial Value of Assets
Investment rate of return.................
7.00%, net of pension plan investment and administrative expenses, includes
inflation
Projected salary increase...............
Varies by Entry-Age and Service
Inflation......................................... 2.500%
Payroll growth............................... 2.750%
Valuation date............................... June 30, 2018
Actuarial cost method....................
Entry-age normal cost method
Amortization method...................... Level percent of payroll
Amortization period........................ Gains and losses over a fixed 30-year period with increases or decreases
in the rate spread directly over a 5-year period (Miscellaneous)
Experience gains and losses over a fixed 30-year period and spread rate
increases or decreases over a 5-year period (Safety)
Asset valuation method.................. Actuarial Value of Assets
Investment rate of return.................
7.00%, net of pension plan investment and administrative expenses, includes
inflation
Projected salary increase...............
Varies by Entry-Age and Service
Inflation......................................... 2.500%
Payroll growth............................... 2.750%
Methods and assumptions used to determine FY 2022-23 contribution rates to CalPERS plans
Methods and assumptions used to determine FY 2021-22 contribution rates to CalPERS plans
Methods and assumptions used to determine FY 2020-21 contribution rates to CalPERS plans

CITY AND COUNTY OF SAN FRANCISCO
Required Supplementary Information (Unaudited) –
Schedules of Employer Contributions – Pension Plans (Continued)
June 30, 2023
(Dollars in Thousands)
205
Valuation date............................... June 30, 2017
Actuarial cost method....................
Entry-age normal cost method
Amortization method...................... Level percent of payroll
Amortization period........................ Gains and losses over a fixed 30-year period with increases or decreases
in the rate spread directly over a 5-year period (Miscellaneous)
Experience gains and losses over a fixed 30-year period and spread rate
increases or decreases over a 5-year period (Safety)
Asset valuation method.................. Actuarial Value of Assets
Investment rate of return.................
7.25%, net of pension plan investment and administrative expenses, includes
inflation
Projected salary increase...............
Varies by Entry-Age and Service
Inflation......................................... 2.625%
Payroll growth............................... 2.875%
Valuation date............................... June 30, 2016
Actuarial cost method....................
Entry-age normal cost method
Amortization method...................... Level percent of payroll
Amortization period........................ Gains and losses over a fixed 30-year period with increases or decreases
in the rate spread directly over a 5-year period (Miscellaneous)
Experience gains and losses over a fixed 30-year period and spread rate
increases or decreases over a 5-year period (Safety)
Asset valuation method.................. Actuarial Value of Assets
Investment rate of return.................
7.375%, net of pension plan investment and administrative expenses,
includes inflation
Projected salary increase...............
Varies by Entry-Age and Service
Inflation......................................... 2.75%
Payroll growth............................... 3.00%
Valuation date............................... June 30, 2015
Actuarial cost method....................
Entry-age normal cost method
Amortization method...................... Level percent of payroll
Amortization period........................ Gains and losses over a fixed 30-year period with increases or decreases
in the rate spread directly over a 5-year period (Miscellaneous)
Experience gains and losses over a fixed 30-year period and spread rate
increases or decreases over a 5-year period (Safety)
Asset valuation method.................. Actuarial Value of Assets
Investment rate of return.................
7.50%, net of pension plan investment and administrative expenses, includes
inflation
Projected salary increase...............
Varies by Entry-Age and Service
Inflation......................................... 2.75%
Payroll growth............................... 3.00%
Methods and assumptions used to determine FY 2019-20 contribution rates to CalPERS plans
Methods and assumptions used to determine FY 2018-19 contribution rates to CalPERS plans
Methods and assumptions used to determine FY 2017-18 contribution rates to CalPERS plans

CITY AND COUNTY OF SAN FRANCISCO
Required Supplementary Information (Unaudited) –
Schedules of Employer Contributions – Pension Plans (Continued)
June 30, 2023
(Dollars in Thousands)
206
Valuation date...............................
June 30, 2014
Actuarial cost method....................
Entry-age normal cost method
Amortization method......................
Level percent of payroll
Amortization period........................
Gains and losses over a fixed 30-year period with increases or decreases
in the rate spread directly over a 5-year period (Miscellaneous)
Experience gains and losses over a fixed 30-year period and spread rate
increases or decreases over a 5-year period (Safety)
Asset valuation method..................
Actuarial Value of Assets
Investment rate of return.................
7.50%, net of pension plan investment and administrative expenses, includes
inflation
Projected salary increase...............
Varies by Entry-Age and Service
Inflation.........................................
2.75%
Payroll growth...............................
3.00%
Valuation date............................... June 30, 2013
Actuarial cost method....................
Entry-age normal cost method
Amortization method...................... Level percent of payroll
Amortization period........................ Gains and losses over a fixed 30-year period with increases or decreases
in the rate spread directly over a 5-year period (Miscellaneous)
Experience gains and losses over a fixed 30-year period and spread rate
increases or decreases over a 5-year period (Safety)
Asset valuation method.................. Market Value
Investment rate of return.................
7.50%, net of pension plan investment and administrative expenses, includes
inflation
Projected salary increase...............
3.30% to 14.20% depending on age, service, and type of employment
Inflation......................................... 2.75%
Payroll growth............................... 3.00%
Individual salary growth................... A merit scale varying by duration of employment coupled with an
assumed annual inflation growth of 2.75% and an annual
production growth of 0.25%.
Valuation date............................... June 30, 2012
Actuarial cost method....................
Entry-age normal cost method
Amortization method...................... Level percent of payroll
Amortization period........................ 7 years as of the valuation date (Miscellaneous)
25 years as of the valuation date (Safety)
Asset valuation method.................. 15-year smoothed market
Investment rate of return.................
7.50%, net of pension plan investment and administrative expenses, includes
inflation
Projected salary increase...............
3.30% to 14.20% depending on age, service, and type of employment
Inflation......................................... 2.75%
Payroll growth............................... 3.00%
Individual salary growth................... A merit scale varying by duration of employment coupled with an
assumed annual inflation growth of 2.75% and an annual
production growth of 0.25%.
Methods and assumptions used to determine FY 2014-15 contribution rates to CalPERS plans
Methods and assumptions used to determine FY 2016-17 contribution rates to CalPERS plans
Methods and assumptions used to determine FY 2015-16 contribution rates to CalPERS plans

CITY AND COUNTY OF SAN FRANCISCO
Required Supplementary Information (Unaudited) –
Schedule of Changes in Net Other Postemployment Benefits Liability and Related Ratios
Other Postemployment Healthcare Benefits Plan
June 30, 2023
(Dollars in Thousands)
207
City Plan
Successor
Agency
Transportation
Authority
Total OPEB Liability
Service cost (BOY)
154,800$ 314$ 123$
Interest (includes interest on service cost)
306,758 694 150
Changes of benefit terms
- - -
Differences between expected and actual
experience
(224,065) - (3)
Changes of assumptions
49,784 - (99)
Benefit payments, including refunds of
member contributions
(211,025) (854) (70)
Net change in total OPEB liability
76,252 154 101
Total OPEB liability - beginning
4,409,899 11,217 1,956
Total OPEB liability - ending
4,486,151$ 11,371$ 2,057$
Plan fiduciary net position
Contributions - employer
252,866$ 1,689$ 70$
Contributions - member
66,455 - -
Net investment loss
(87,003) (2,080) (334)
Benefit payments, including refunds of
member contributions
(211,025) (854) (70)
Administrative expense
(190) (6) (1)
Net change in plan fiduciary net position
21,103 (1,251) (335)
Plan fiduciary net position - beginning
718,778 14,740 2,493
Plan fiduciary net position - ending
739,881 13,489 2,158
Net OPEB liability/(asset) - ending
3,746,270$ (2,118)$ (101)$
Plan fiduciary net position as a
percentage of the total OPEB liability
16.5% 118.6% 104.9%
Covered payroll
4,184,087$ 6,633$ 5,032$
Net OPEB liability/(asset) as a percentage
of covered payroll
89.5% -31.9% -2.0%
2023

CITY AND COUNTY OF SAN FRANCISCO
Required Supplementary Information (Unaudited) –
Schedule of Changes in Net Other Postemployment Benefits Liability and Related Ratios
Other Postemployment Healthcare Benefits Plan (Continued)
June 30, 2023
(Dollars in Thousands)
208
City Plan
Successor
Agency
Transportation
Authority
Total OPEB Liability
Service cost (BOY)
155,840$ 348$ 90$
Interest (includes interest on service cost)
300,122 831 124
Changes of benefit terms
- - -
Differences between expected and actual
experience
(151,949) (1,337) 183
Changes of assumptions
- (164) -
Benefit payments, including refunds of
member contributions
(206,439) (880) (63)
Net change in total OPEB liability
97,574 (1,202) 334
Total OPEB liability - beginning
4,312,325 12,419 1,622
Total OPEB liability - ending
4,409,899$ 11,217$ 1,956$
Plan fiduciary net position
Contributions - employer
245,994$ 2,259$ 63$
Contributions - member
61,582 - -
Net investment income
128,916 3,039 538
Benefit payments, including refunds of
member contributions
(206,439) (880) (63)
Administrative expense
(265) (6) (1)
Net change in plan fiduciary net position
229,788 4,412 537
Plan fiduciary net position - beginning
488,990 10,328 1,956
Plan fiduciary net position - ending
718,778 14,740 2,493
Net OPEB liability/(asset) - ending
3,691,121$ (3,523)$ (537)$
Plan fiduciary net position as a
percentage of the total OPEB liability
16.3% 131.4% 127.5%
Covered payroll
3,955,498$ 7,430$ 4,420$
Net OPEB liability/(asset) as a percentage
of covered payroll
93.3% -47.4% -12.1%
2022

CITY AND COUNTY OF SAN FRANCISCO
Required Supplementary Information (Unaudited) –
Schedule of Changes in Net Other Postemployment Benefits Liability and Related Ratios
Other Postemployment Healthcare Benefits Plan (Continued)
June 30, 2023
(Dollars in Thousands)
209
City Plan
Successor
Agency
Transportation
Authority
Total OPEB Liability
Service cost (BOY)
141,642$ 344$ 92$
Interest (includes interest on service cost)
314,907 830 114
Changes of benefit terms
- - -
Differences between expected and actual
experience
(381,922) - (1)
Changes of assumptions
151,725 (248) -
Benefit payments, including refunds of
member contributions
(196,445) (902) (61)
Net change in total OPEB liability
29,907 24 144
Total OPEB liability - beginning
4,282,418 12,395 1,478
Total OPEB liability - ending
4,312,325$ 12,419$ 1,622$
Plan fiduciary net position
Contributions - employer
235,963$ 2,901$ 61$
Contributions - member
60,236 - -
Net investment income
22,746 285 67
Benefit payments, including refunds of
member contributions
(196,445) (902) (61)
Administrative expense
(113) (7) (1)
Net change in plan fiduciary net position
122,387 2,277 66
Plan fiduciary net position - beginning
366,603 8,051 1,890
Plan fiduciary net position - ending
488,990 10,328 1,956
Net OPEB liability/(asset) - ending
3,823,335$ 2,091$ (334)$
Plan fiduciary net position as a
percentage of the total OPEB liability
11.3% 83.2% 120.6%
Covered payroll
3,951,792$ 6,745$ 4,355$
Net OPEB liability/(asset) as a percentage
of covered payroll
96.7% 31.0% -7.7%
2021

CITY AND COUNTY OF SAN FRANCISCO
Required Supplementary Information (Unaudited) –
Schedule of Changes in Net Other Postemployment Benefits Liability and Related Ratios
Other Postemployment Healthcare Benefits Plan (Continued)
June 30, 2023
(Dollars in Thousands)
210
City Plan
Successor
Agency
Transportation
Authority
Total OPEB Liability
Service cost (BOY)
133,736$ 335$ 118$
Interest (includes interest on service cost)
283,520 812 143
Changes of benefit terms
- - -
Differences between expected and actual
experience
194,068 - (596)
Changes of assumptions
- - (63)
Benefit payments, including refunds of
member contributions
(185,839) (906) (60)
Net change in total OPEB liability/(asset)
425,485 241 (458)
Total OPEB liability - beginning
3,856,933 12,154 1,936
Total OPEB liability - ending
4,282,418$ 12,395$ 1,478$
Plan fiduciary net position
Contributions - employer
218,625$ 2,967$ 138$
Contributions - member
51,024 - -
Net investment income
26,959 407 106
Benefit payments, including refunds of
member contributions
(185,839) (906) (60)
Administrative expense
(132) (3) (1)
Net change in plan fiduciary net position
110,637 2,465 183
Plan fiduciary net position - beginning
255,966 5,586 1,707
Plan fiduciary net position - ending
366,603 8,051 1,890
Net OPEB liability/(asset) - ending
3,915,815$ 4,344$ (412)$
Plan fiduciary net position as a
percentage of the total OPEB liability
8.6% 65.0% 127.9%
Covered payroll
3,763,446$ 6,384$ 4,039$
Net OPEB liability/(asset) as a percentage
of covered payroll
104.0% 68.1% -10.2%
2020

CITY AND COUNTY OF SAN FRANCISCO
Required Supplementary Information (Unaudited) –
Schedule of Changes in Net Other Postemployment Benefits Liability and Related Ratios
Other Postemployment Healthcare Benefits Plan (Continued)
June 30, 2023
(Dollars in Thousands)
211
City Plan
Successor
Agency
Transportation
Authority
Total OPEB Liability
Service cost (BOY)
127,850$ 164$ 122$
Interest (includes interest on service cost)
290,029 701 129
Changes of benefit terms
- - (5)
Differences between expected and actual
experience
(385,732) 267 -
Changes of assumptions
111,119 1,572 -
Benefit payments, including refunds of
member contributions
(178,019) (812) (58)
Net change in total OPEB liability
(34,753) 1,892 188
Total OPEB liability - beginning
3,891,686 10,262 1,748
Total OPEB liability - ending
3,856,933$ 12,154$ 1,936$
Plan fiduciary net position
Contributions - employer
203,858$ 2,145$ 144$
Contributions - member
41,682 - -
Net investment income
14,105 339 119
Benefit payments, including refunds of
member contributions
(178,019) (812) (58)
Administrative expense
(137) (11) (1)
Net change in plan fiduciary net position
81,489 1,661 204
Plan fiduciary net position - beginning
174,477 3,925 1,503
Plan fiduciary net position - ending
255,966 5,586 1,707
Net OPEB liability - ending
3,600,967$ 6,568$ 229$
Plan fiduciary net position as a
percentage of the total OPEB liability
6.6% 46.0% 88.2%
Covered payroll
3,583,448$ 5,742$ 4,045$
Net OPEB liability as a percentage of
covered payroll
100.5% 114.4% 5.7%
2019

CITY AND COUNTY OF SAN FRANCISCO
Required Supplementary Information (Unaudited) –
Schedule of Changes in Net Other Postemployment Benefits Liability and Related Ratios
Other Postemployment Healthcare Benefits Plan (Continued)
June 30, 2023*
(Dollars in Thousands)
212
* Fiscal year 2017-18 was the first year of implementation of GASB No. 75, therefore only six years of information
is shown.
City Plan
Successor
Agency
Transportation
Authority
Total OPEB Liability
Service cost (BOY)
125,195$ 159$ 122$
Interest (includes interest on service cost)
272,942 692 117
Benefit payments, including refunds of
member contributions
(165,470) (797) (64)
Net change in total OPEB liability
232,667 54 175
Total OPEB liability - beginning
3,659,019 10,208 1,573
Total OPEB liability - ending
3,891,686$ 10,262$ 1,748$
Plan fiduciary net position
Contributions - employer
183,898$ 1,097$ 166$
Contributions - member
31,686 - -
Net investment income
17,368 353 134
Benefit payments, including refunds of
member contributions
(165,470) (797) (64)
Administrative expense
(109) (3) (1)
Net change in plan fiduciary net position
67,373 650 235
Plan fiduciary net position - beginning
107,104 3,275 1,268
Plan fiduciary net position - ending
174,477 3,925 1,503
Net OPEB liability - ending
3,717,209$ 6,337$ 245$
Plan fiduciary net position as a
percentage of the total OPEB liability
4.5% 38.2% 86.0%
Covered payroll
3,393,658$ 5,042$ 3,946$
Net OPEB liability as a percentage of
covered payroll
109.5% 125.7% 6.2%
2018

CITY AND COUNTY OF SAN FRANCISCO
Required Supplementary Information (Unaudited) –
Schedules of Employer Contributions
Other Postemployment Healthcare Benefits Plan
Year Ended June 30, 2023
(Dollars in Thousands)
213
City Plan
Successor
Agency
Transportation
Authority
Charter required or actuarially determined contributions (ADC) 260,649$ 116$ 64$
Contributions in relation to the charter required contribution or ADC (260,649) (2,429) (105)
Contribution deficiency/(excess)
-$ (2,313)$ (41)$
Covered payroll 4,600,228$ 6,405$ 4,854$
Contributions as a percentage of covered payroll 5.67% 37.92% 2.16%
City Plan
Successor
Agency
Transportation
Authority
Charter required or actuarially determined contributions (ADC) 252,866$ 824$ 55$
Contributions in relation to the charter required contribution or ADC (252,866) (1,689) (64)
Contribution deficiency/(excess)
-$ (865)$ (9)$
Covered payroll 4,184,087$ 6,633$ 5,032$
Contributions as a percentage of covered payroll 6.04% 25.46% 1.27%
City Plan
Successor
Agency
Transportation
Authority
Charter required or actuarially determined contributions (ADC) 245,994$ 813$ 51$
Contributions in relation to the charter required contribution or ADC (245,994) (2,259) (63)
Contribution deficiency/(excess)
-$ (1,446)$ (12)$
Covered payroll 3,955,498$ 7,430$ 4,420$
Contributions as a percentage of covered payroll 6.22% 30.40% 1.43%
City Plan
Successor
Agency
Transportation
Authority
Charter required or actuarially determined contributions (ADC) 235,962$ 802$ 138$
Contributions in relation to the charter required contribution or ADC (235,962) (2,901) (61)
Contribution deficiency/(excess)
-$ (2,099)$ 77$
Covered payroll 3,951,792$ 6,745$ 4,355$
Contributions as a percentage of covered payroll 5.97% 43.01% 1.40%
City Plan
Successor
Agency
Transportation
Authority
Charter required or actuarially determined contributions (ADC) 218,625$ 812$ 138$
Contributions in relation to the charter required contribution or ADC (218,625) (2,967) (138)
Contribution deficiency/(excess)
-$ (2,155)$ -$
Covered payroll 3,763,446$ 6,384$ 4,039$
Contributions as a percentage of covered payroll 5.81% 46.48% 3.42%
For the year ended June 30, 2021
For the year ended June 30, 2023
For the year ended June 30, 2022
For the year ended June 30, 2020
For the year ended June 30, 2019

CITY AND COUNTY OF SAN FRANCISCO
Required Supplementary Information (Unaudited) –
Schedules of Employer Contributions
Other Postemployment Healthcare Benefits Plans (Continued)
Year Ended June 30, 2023*
(In Thousands)
214
* Fiscal year 2017-18 was the first year of implementation of GASB No. 75, and only seven years of information is
available for the City plan, Successor Agency plan and the Transportation Authority plan.
City Plan
Successor
Agency
Transportation
Authority
Charter required or actuarially determined contributions (ADC) 203,858$ 813$ 143$
Contributions in relation to the charter required contribution or ADC (203,858) (2,145) (143)
Contribution deficiency/(excess)
-$ (1,332)$ -$
Covered payroll 3,583,448$ 5,742$ 4,045$
Contributions as a percentage of covered payroll 5.69% 37.36% 3.54%
City Plan
Successor
Agency
Transportation
Authority
Charter required or actuarially determined contributions (ADC) 183,898$ 804$ 165$
Contributions in relation to the charter required contribution or ADC (183,898) (1,097) (165)
Contribution deficiency/(excess)
-$ (293)$ -$
Covered payroll 3,393,658$ 5,042$ 3,946$
Contributions as a percentage of covered payroll 5.42% 21.76% 4.18%
For the year ended June 30, 2017
For the year ended June 30, 2018

CITY AND COUNTY OF SAN FRANCISCO
Required Supplementary Information (Unaudited) –
Schedules of Employer Contributions
Other Postemployment Healthcare Benefits Plans (Continued)
Year Ended June 30, 2023
(In Thousands)
215
Notes to Schedule:
The City Plan, Transportation Authority and Successor Agency calculate the annual required contributions on an
actuarially determined basis. The methods and assumptions used to determine the fiscal year 2022-23 contribution
rates for the plans are as follows:
Actuarial Assumptions
Valuation Date June 30, 2022
Measurement Date June 30, 2022
Actuarial Cost Method The Entry Age Actuarial Cost Method is used to measure the Plan's Total OPEB Liability
Healthcare Cost Trend Rates Pre-Medicare trend starts at 7.74% trending down to ultimate rate of 3.93% in 2076
Medicare trend starts at 7.74% trending down to ultimate rate of 3.94% in 2076
10-County average trend starts at 5.00% trending down to ultimate rate of 3.94% in 2076
Vision and expenses trend remains a flat 3.0% for all years
Expected Rate of Return on Plan Assets 7.00%
Discount Rate 7.00%
Salary Increase Rate Wage Inflation Component: 3.25%
Additional Merit Component (dependent on years of service):
Police: 0.50% - 7.50%
Fire: 0.50% - 14.00%
Muni Drivers: 0.00% - 16.00%
Craft: 0.50% - 3.75%
Misc: 0.30% - 5.50%
Inflation Rate Wage Inflation: 3.25% compounded annually
Consumer Price Inflation: 2.50% compounded annually
Mortality Tables
Non-Annuitants
Published Table Male Female
Miscellaneous PubG-2010 Employee 0.834 0.866
Safety PubS-2010 Employee 1.011 0.979
Healthy Retirees
Published Table Male Female
Miscellaneous PubG-2010 Employee 1.031 0.977
Safety PubS-2010 Employee 0.947 1.044
Disabled Retirees
Published Table Male Female
Miscellaneous PubG-2010 Employee 1.045 1.003
Safety PubS-2010 Employee 0.916 0.995
Beneficiaries
Published Table Male Female
Miscellaneous PubG-2010 Employee 1.031 0.977
Safety PubG-2010 Employee 1.031 0.977
Adjustment Factor
Adjustment Factor
City Plan for the year ended June 30, 2022
Base mortality tables are developed by multiplying a published table by an adjustment factor developed in SFERS
experience study for the period ended June 30, 2019.
Adjustment Factor
Adjustment Factor

CITY AND COUNTY OF SAN FRANCISCO
Required Supplementary Information (Unaudited) –
Schedules of Employer Contributions
Other Postemployment Healthcare Benefits Plans (Continued)
Year Ended June 30, 2023
(In Thousands)
216
Actuarial Assumptions Transportation Authority Successor Agency
Actuarial Valuation Date
June 30, 2021 June 30, 2021
Actuarial Cost Method
Entry age normal cost method Entry age normal cost method
Asset Valuation Method
Actuarial value of assets
General Inflation
2.75% per annum 2.50%
Salary Increases
2.75% per annum, in aggregate
2.75%; Merit based on 2017 CalPERS Experience
Study
Investment Rate of Return
7.59% 6.25%
Mortality, Turnover, Disability, and
Retirement
CalPERS Experience Study for the
period from 1997 to 2015
CalPERS 2017 Experience Study for the period
from 1997 to 2015
Post-retirement mortality projected fully
generational with Scale MP-2020
Healthcare Cost Trend Rate
Initial 14% for non-medicare eligibles,
24.25% for spouse/domestic partner
medicare eligibles and 6.5% medicare
eligibles, all grading down to 4.0%
Non-Medicare - 6.75% for 2022, decreasing to an
ultimate rate of 3.75% in 2076;
Medicare (non-Kaiser)- 5.85% for 2022, decreasing
to an ultimate rate of 3.75% in 2076;
Medicare (Kaiser) - 4.75% for 2022, decreasing to
an ultimate rate of 3.75% in 2076

CITY AND COUNTY OF SAN FRANCISCO
Required Supplementary Information (Unaudited) –
Budgetary Comparison Schedule - General Fund
Year Ended June 30, 2023
(In Thousands)
217
Original
Budget
Final Budget
Actual
Budgetary
Basis
Variance
Positive
(Negative)
Budgetary Fund Balance, July 1 395,409$ 3,214,031$ 3,214,031$ -$
Resources (Inflows):
Property taxes........................................................................................ 2,379,530 2,379,530 2,466,863 87,333
Business taxes...................................................................................... 902,300 902,246 850,593 (51,653)
Other local taxes:
Sales and use tax................................................................................ 182,870 182,870 197,911 15,041
Hotel room tax...................................................................................... 188,880 188,880 252,898 64,018
Utility users tax..................................................................................... 82,630 82,630 110,661 28,031
Parking tax........................................................................................... 80,180 80,180 82,716 2,536
Real property transfer tax.................................................................... 390,480 390,480 186,248 (204,232)
Other local taxes.................................................................................. 125,780 125,780 278,112 152,332
Licenses, permits and franchises:
Licenses and permits.......................................................................... 12,476 12,407 11,881 (526)
Franchise tax....................................................................................... 14,342 14,342 17,074 2,732
Fines, forfeitures, and penalties............................................................. 3,088 3,088 3,177 89
Interest and investment income............................................................. 44,467 38,660 104,967 66,307
Rents and concessions:
Garages - Recreation and Park........................................................... 6,684 6,684 6,807 123
Rents and concessions - Recreation and Park.................................. 5,497 5,497 5,130 (367)
Other rents and concessions.............................................................. 950 732 554 (178)
Intergovernmental:
Federal grants and subventions.......................................................... 560,424 565,341 303,124 (262,217)
State subventions:
Social service subventions................................................................ 159,518 148,414 140,722 (7,692)
Health / mental health subventions................................................... 249,475 267,489 279,568 12,079
Health and welfare realignment......................................................... 350,314 350,314 398,123 47,809
Public safety sales tax....................................................................... 89,740 89,740 94,897 5,157
Other grants and subventions........................................................... 98,763 111,750 115,722 3,972
Other.................................................................................................... 3,051 3,179 1,582 (1,597)
Charges for services:
General government service charges................................................. 91,221 96,489 80,730 (15,759)
Public safety service charges............................................................. 39,194 39,078 43,262 4,184
Recreation charges - Recreation and Park......................................... 28,313 28,422 25,079 (3,343)
MediCal, Medicare and health service charges................................... 78,196 79,309 93,802 14,493
Other financing sources:
Transfers from other funds.................................................................. 203,001 194,984 194,388 (596)
Other resources (inflows)...................................................................... 19,420 23,307 14,969 (8,338)
Subtotal - Resources (Inflows) 6,390,784 6,411,822 6,361,560 (50,262)
Total amounts available for appropriation....................................... 6,786,193 9,625,853 9,575,591 (50,262)

CITY AND COUNTY OF SAN FRANCISCO
Required Supplementary Information (Unaudited) –
Budgetary Comparison Schedule - General Fund (Continued)
Year Ended June 30, 2023
(In Thousands)
218
Original
Budget
Final Budget
Actual
Budgetary
Basis
Variance
Positive
(Negative)
Budgetary Fund Balance, July 1 395,409$ 3,214,031$ 3,214,031$ -$
Charges to Appropriations (Outflows):
Public Protection
Adult Probation..................................................................................... 51,180$ 50,984$ 44,389$ 6,595$
District Attorney................................................................................... 75,175 74,722 74,301 421
Emergency Management.................................................................... 85,768 72,763 69,003 3,760
Fire Department................................................................................... 451,951 465,445 465,296 149
Juvenile Probation................................................................................ 32,703 29,704 28,389 1,315
Police Accountability............................................................................ 9,648 9,945 9,945 -
Police Department............................................................................... 621,723 646,033 645,980 53
Public Defender................................................................................... 48,309 48,306 47,989 317
Sheriff................................................................................................... 257,648 248,124 244,027 4,097
Sheriff Accountability........................................................................... 2,472 2,110 1,015 1,095
Superior Court..................................................................................... 33,363 33,353 33,239 114
Subtotal - Public Protection 1,669,940 1,681,489 1,663,573 17,916
Public Works, Transportation and Commerce
Appeals Board..................................................................................... 1,195 1,210 1,210 -
Building Inspection............................................................................... - 450 200 250
Economic and Workforce Development............................................. 148,462 154,445 145,560 8,885
Municipal Transportation Agency......................................................... - 421 421 -
Port...................................................................................................... - 105 105 -
Public Utilities Commission................................................................. - 635 635 -
Public Works....................................................................................... 113,076 118,675 117,671 1,004
Subtotal - Public Works, Transportation and Commerce 262,733 275,941 265,802 10,139
Human Welfare and Neighborhood Development
Children, Youth and Their Families..................................................... 90,850 89,688 87,642 2,046
Early Childhood.................................................................................... 39,059 35,032 34,620 412
Environment......................................................................................... - 2 2 -
Homelessness and Supportive Housing............................................. 313,138 309,626 303,764 5,862
Human Rights Commission................................................................ 15,021 18,868 18,698 170
Human Services.................................................................................. 1,000,811 1,009,182 996,038 13,144
Rent Arbitration Board......................................................................... 1,000 122 122 -
Mayor's Office...................................................................................... 100,393 144,927 140,813 4,114
Status of Women................................................................................. 14,534 14,534 14,140 394
Subtotal - Human Welfare and Neighborhood Development 1,574,806 1,621,981 1,595,839 26,142
Community Health
Public Health........................................................................................ 1,162,956 1,118,010 1,077,922 40,088
Culture and Recreation
Academy of Sciences.......................................................................... 7,422 7,377 6,812 565
Arts Commission................................................................................. 13,951 11,784 11,784 -
Asian Art Museum................................................................................ 10,703 10,727 10,723 4
Fine Arts Museums.............................................................................. 19,903 20,531 20,528 3
Law Library.......................................................................................... 2,132 2,142 1,883 259
Library.................................................................................................. - 73 73 -
Recreation and Park Commission...................................................... 133,965 127,447 122,852 4,595
War Memorial...................................................................................... 424 394 394 -
Subtotal - Culture and Recreation 188,500 180,475 175,049 5,426

CITY AND COUNTY OF SAN FRANCISCO
Required Supplementary Information (Unaudited) –
Budgetary Comparison Schedule - General Fund (Continued)
Year Ended June 30, 2023
(In Thousands)
219
Original
Budget
Final Budget
Actual
Budgetary
Basis
Variance
Positive
(Negative)
Budgetary Fund Balance, July 1 395,409$ 3,214,031$ 3,214,031$ -$
General Administration and Finance
Assessor/Recorder............................................................................. 30,324$ 37,159$ 36,295$ 864$
Board of Supervisors........................................................................... 21,934 22,376 22,021 355
City Attorney......................................................................................... 29,339 29,623 28,863 760
Civil Service......................................................................................... 1,017 1,039 852 187
Controller............................................................................................. 13,733 14,512 13,641 871
Elections.............................................................................................. 23,236 26,508 23,527 2,981
Ethics................................................................................................... 7,587 8,236 6,809 1,427
General Services Agency - Administrative Services........................... 78,711 81,578 75,946 5,632
Health Service System........................................................................ 459 565 - 565
Human Resources.............................................................................. 18,615 21,414 18,842 2,572
Mayor's Office...................................................................................... 7,934 7,608 6,712 896
Planning............................................................................................... 52,615 47,452 44,434 3,018
Retirement System.............................................................................. 1,598 1,280 1,280 -
Telecommunications and Information Services.................................. 6,301 12,410 12,410 -
Treasurer/Tax Collector....................................................................... 35,944 39,978 36,911 3,067
Subtotal - General Administration and Finance 329,347 351,738 328,543 23,195
General City Responsibilities
General City Responsibilities............................................................... 194,477 201,727 189,544 12,183
Other financing uses:
Debt service......................................................................................... 25,270 232 12 220
Transfers to other funds...................................................................... 1,279,970 1,315,702 1,315,702 -
Budgetary reserves and designations................................................. 98,194 46,496 - 46,496
Total charges to appropriations...................................................... 6,786,193 6,793,791 6,611,986 181,805
Total Sources less Current Year Uses........................................... -$ 2,832,062$ 2,963,605$ 131,543$
2,963,605$
(1,787,521)
Reserve for Litigation and Contingencies and General Reserve (323,937)
852,147$
9,575,591$
(3,214,031)
(7,811)
(2,456)
(35,808)
15,571
6,299
83
(194,388)
6,143,050$
6,611,986$
2,795
(95,736)
72,033
(1,315,702)
5,275,376$
Actual amounts (budgetary basis) "available for appropriation"...........................................................
Budgetary fund balance, June 30 before reserves and designations
Reserves and designations made from budgetary fund balance not available for appropriation
Net Available Budgetary Fund Balance, June 30
Sources/inflows of resources
Difference - budget to GAAP:
Total revenues as reported on the statement of revenues, expenditures and changes
Difference - budget to GAAP:
The fund balance at the beginning of the year is a budgetary resource but is not
a current year revenue for financial reporting purposes................................................................
Property tax revenue - Teeter Plan net change from prior year.......................................................
Change in unrealized gain/(loss) on investments............................................................................
Interest earnings / charges from other funds assigned to General Fund as interest adjustment...
Interest earnings from other funds assigned to General Fund as other revenues..........................
Grants, subventions and other receivables received after 60-day recognition period.....................
Change in prepaid lease revenue, leases receivable, and deferred inflows related to leases........
Transfers from other funds are inflows of budgetary resources, but are not
revenues for financial reporting purposes......................................................................................
in fund balance - General Fund...........................................................................................................
Uses/outflows of resources
Actual amounts (budgetary basis) "total charges to appropriations"....................................................
Transfers to other funds are outflows of budgetary resources but are not
Total expenditures as reported on the statement of revenues, expenditures and changes
in fund balance - General Fund...........................................................................................................
Recognition of expenditures for advances and imprest cash and capital asset acquisition
for internal service fund..................................................................................................................
expenditures for financial reporting purposes................................................................................
Intergovernmental expense offset....................................................................................................
Recognition of expenditures at lease initiation.................................................................................
CITY AND COUNTY OF SAN FRANCISCO
Required Supplementary Information (Unaudited) –
Budgetary Comparison Schedule - General Fund (Continued)
Year Ended June 30, 2023
(In Thousands)
220
Notes to Budgetary Schedule:
(a) Budgetary Data
The City adopts two-year rolling budgets annually for all governmental funds on a substantially modified
accrual basis of accounting except for capital project funds and certificates of participation and other debt
service funds, which substantially adopt project length budgets.
The budget of the City is a detailed operating plan, which identifies estimated costs and results in relation
to estimated revenues. The budget includes (1) the programs, projects, services, and activities to be
provided during the fiscal year, (2) the estimated resources (inflows) available for appropriation, and (3) the
estimated charges to appropriations. The budget represents a process through which policy decisions are
deliberated, implemented, and controlled. The City Charter prohibits expending funds for which there is no
legal appropriation.
The Administrative Code Chapter 3 outlines the City’s general budgetary procedures, with Section 3.3
detailing the budget timeline. A summary of the key budgetary steps is summarized as follows:
Original Budget
(1) Departments and Commissions conduct hearings to obtain public comment on their proposed annual
budgets beginning in December and submit their budget proposals to the Controller’s Office no later
than February 21.
(2) The Controller’s Office consolidates the budget estimates and transmits them to the Mayor’s Office no
later than the first working day of March. Staff of the Mayor’s Office analyze, review and refine the
budget estimates before transmitting the Mayor’s Proposed Budget to the Board of Supervisors.
(3) By the first working day of May, the Mayor submits the Proposed Budget for selected departments to
the Board of Supervisors. The selected departments are determined by the Controller in consultation
with the Board President and the Mayor’s Budget Director. Criteria for selecting the departments include
(1) that they are not supported by the City’s General Fund or (2) that they do not rely on the State’s
budget submission in May for their revenue sources.
(4) By the first working day of June, the Mayor submits the complete Proposed Budget to the Board of
Supervisors along with a draft of the Annual Appropriation Ordinance prepared by the Controller’s
Office.
(5) Within five working days of the Mayor’s proposed budget transmission to the Board of Supervisors, the
Controller reviews the estimated revenues and assumptions in the Mayor’s Proposed Budget and
provides an opinion as to their accuracy and reasonableness. The Controller also may make a
recommendation regarding prudent reserves given the Mayor’s proposed resources and expenditures.
(6) The designated Committee (usually the Budget Committee) of the Board of Supervisors conducts
hearings, hears public comment, and reviews the Mayor’s Proposed Budget. The Committee
recommends an interim budget reflecting the Mayor’s budget transmittal and, by June 30, the Board of
Supervisors passes interim appropriation and salary ordinances.
(7) Not later than the last working day of July, the Board of Supervisors adopts the budget through passage
of the Annual Appropriation Ordinance, the legal authority for enactment of the budget.
CITY AND COUNTY OF SAN FRANCISCO
Required Supplementary Information (Unaudited) –
Budgetary Comparison Schedule - General Fund (Continued)
Year Ended June 30, 2023
(In Thousands)
221
Final Budget
The final budgetary data presented in the budgetary comparison schedule reflects the following changes
to the original budget:
(1) Certain annual appropriations are budgeted on a project or program basis. If such projects or programs
are not completed at the end of the fiscal year, unexpended appropriations, including encumbered
funds, are carried forward to the following year. In certain circumstances, other programs and regular
annual appropriations may be carried forward after appropriate approval. Annually appropriated funds,
not authorized to be carried forward, lapse at the end of the fiscal year. Appropriations carried forward
from the prior year are included in the final budgetary data.
(2) Appropriations may be adjusted during the year with the approval of the Mayor and the Board of
Supervisors, e.g. supplemental appropriations. Additionally, the Controller is authorized to make certain
transfers of surplus appropriations within a department. Such adjustments are reflected in the final
budgetary data.
The Annual Appropriation Ordinance adopts the budget at the character level of expenditure within
departments. As described above, the Controller is authorized to make certain transfers of
appropriations within departments. Accordingly, the legal level of budgetary control by the Board of
Supervisors is the department level.
Budgetary data, as revised, is presented as required supplementary information for the General Fund.
Final budgetary data excludes the amount reserved for encumbrances for appropriate comparison to
actual expenditures.
(b) Budgetary Results Reconciled to Results in Accordance with Generally Accepted Accounting
Principles
The budgetary process is based upon accounting for certain transactions on a basis other than GAAP. The
results of operations are presented in the budget-to-actual comparison schedule in accordance with the
budgetary process (Budget basis) to provide a meaningful comparison with the budget.
The major differences between the Budget basis “actual” and GAAP basis are timing differences. Timing
differences represent transactions that are accounted for in different periods for Budget basis and GAAP
basis reporting. Certain revenues accrued on a Budget basis have been deferred for GAAP reporting.
These primarily relate to the accounting for property tax revenues under the Teeter Plan (Note 6), revenues
not meeting the 60-day availability period and other assets not available for budgetary appropriation.

CITY AND COUNTY OF SAN FRANCISCO
Required Supplementary Information (Unaudited) –
Budgetary Comparison Schedule - General Fund (Continued)
Year Ended June 30, 2023
(In Thousands)
222
The fund balance of the General Fund as of June 30, 2023, on a Budget basis is reconciled to the fund
balance on a GAAP basis as follows:
Fund Balance - Budget Basis………………………………………………………………………………...…………..
2,963,605$
Unrealized Gains/ (Losses) on Investments………………………………………………………………………………….
(158,859)
Cumulative Excess Property Tax Revenues Recognized on a Budget Basis………………………………………………..
(40,685)
Cumulative Excess Health, Human Services, Franchise and Other Revenues
Recognized on a Budget Basis………………………………………………………………………………………......
(111,163)
Pre-paid Lease Revenue, Lease Receivables, and Deferred Inflows (net)……………………………………………………………………………………………………………………………………………………………………………..
(5,935)
Nonspendable Fund Balance (Assets Reserved for Not Available for Appropriation)………………………………………………………………………….
1,174
Fund Balance - GAAP basis…………………………………………………………………………………………………………………..
2,648,137$
Not available for appropriations:
Restricted Fund Balance:
Rainy Day - Economic Stabilization Reserve………………………………………………………
114,539$
Committed Fund Balance:
Budget Stabilization Reserves………………………………………………………
330,010
Assigned for Encumbrances……………………………………………………………
424,301
Assigned for Appropriation Carryforward……………………………………………………
840,748
Assigned for Self-Insurance….........................................................
46,496
Assigned for Hotel Tax Loss Contingency…....................................
3,500
Assigned for Subsequent Years' Budgets:
Salaries and Benefits Costs (MOU)……………………………………………
27,927
Subtotal………………………………………………………………
1,787,521$
Available for appropriations:
Assigned for Litigation and Contingences………………………………………
259,230
Assigned balance subsequently appropriated as part of
the General Fund budget for use in fiscal year 2023-24……………..
122,701
Unassigned - General Reserve…………………………………….............
64,707
Unassigned - Federal & State Emergency Revenue Reserve…................
81,300
Unassigned - Fiscal Cliff Reserve….................................................
220,432
Unassigned - Business Tax Stabilization Reserve….........................
29,454
Unassigned - For Public Health use in fiscal year 2023-24…............. 21,213
Unassigned - Other Reserves….......................................................
1,021
Unassigned - Budgeted for use in fiscal year 2024-25….………………...
291,710
Unassigned - For balancing future budget shortfalls in
fiscal year 2024-25 and later……………….........................................
81,190
Unassigned - Available for future appropriations……………………………….
3,126
Subtotal…………………………………………………………………
1,176,084
Fund Balance, June 30, 2023 - Budget basis……………………………………………
2,963,605$
General Fund budget basis fund balance as of June 30, 2023 is composed of the following:
CITY AND COUNTY OF SAN FRANCISCO
NONMAJOR GOVERNMENTAL FUNDS
223
SPECIAL REVENUE FUNDS
Special Revenue Funds are used to account for the proceeds of specific revenue sources that are restricted
or committed to expenditures for specified purposes other than debt service or capital projects.
Building Inspection Fund – Accounts for the revenues and expenditures of the Bureau of Building Inspection
which provides enforcement and implementation of laws regulating the use, occupancy, location and
maintenance of buildings. This fund shall be used by the Department of Building Inspection to defray
the costs of the Bureau of Building Inspection in processing and reviewing permits applications and
plans, filed inspections, code enforcement and reproduction of documents.
Children and Families Fund – Accounts for property tax revenues, tobacco tax funding from Proposition 10
and interest earnings designated by Charter provision. Monies in this fund are used as specified in the
Charter and Proposition 10 to provide services to children less than eighteen years old, and to promote,
support and improve the early development of children from the prenatal stage to five years of age.
Community/Neighborhood Development Fund – Accounts for various grants primarily from the Department
of Housing and Urban Development including federal grants administered by the former
Redevelopment Agency to provide for community development of rundown areas; to promote new
housing, child care centers and public recreation areas; to provide a variety of social programs for the
underprivileged and provide loans for various community development activities. This fund also
includes proceeds from a bond issuance to benefit the Seismic Safety Loan Program which provides
loans for seismic strengthening of privately-owned unreinforced masonry buildings in the City.
Community Health Services Fund – Accounts for state and federal grants used to promote public health
and mental health programs.
Convention Facilities Fund – Accounts for operating revenues of the convention facilities: Moscone Center,
Brooks Hall and Civic Auditorium. In addition to transfers for lease payments of the Moscone Center,
this fund provides for operating costs of the various convention facilities and the San Francisco
Convention and Visitors Bureau.
Culture and Recreation Fund – Accounts for revenues received from a variety of cultural and recreational
funds such as Public Arts, Youth Arts and Yacht Harbor with revenues used for certain specified
operating costs.
Environmental Protection Fund – Accounts for revenues received from state, federal and other sources for
the preservation of the environment, recycling, and reduction of toxic waste from the City’s waste
stream.
Gasoline Tax Fund – Accounts for the subventions received from state gas taxes under the provision of the
Streets and Highways Code and for operating transfers from other funds which are used for the same
purposes. State subventions are restricted to uses related to local streets and highways, acquisitions
of real property, construction and improvements, and maintenance and repairs.
General Services Fund – Accounts for the activities of several non-grant activities, generally established by
administrative action.
Gift and Other Expendable Trusts Fund – Accounts for certain cash gifts which have been accepted by the
Board of Supervisors on behalf of the City and the operations of two smaller funds that cannot properly
be grouped into the Gift Fund because of their specific terms. Disbursements are made by departments,
boards and commissions in accordance with the purposes, if any, specified by the donor. Activities are
controlled by project accounting procedures maintained by the Controller.
Golf Fund – Accounts for the revenue and expenditures related to the City’s six golf courses.
Human Welfare Fund – Accounts for state and federal grants used to promote education and discourage
domestic violence.
CITY AND COUNTY OF SAN FRANCISCO
NONMAJOR GOVERNMENTAL FUNDS
224
SPECIAL REVENUE FUNDS (Continued)
Low and Moderate Income Housing Asset Fund – Accounts for the former Redevelopment Agency’s
affordable housing assets upon its dissolution on January 31, 2012.
Open Space and Park Fund – Accounts for property tax revenues designated by Charter provision,
interest earnings and miscellaneous service charges and gifts. Monies in this fund are used as
specified in the Charter for acquisition and development of parks and open space parcels, for
renovation of existing parks and recreation facilities, for maintenance of properties acquired and for
after-school recreation programs.
Our City Our Home Fund – Accounts for revenue from City's homelessness gross receipts tax, dedicated
for homelessness services and affordable housing, which was authorized by voters through November
2018 Proposition C.
Public Library Fund – Accounts for property tax revenues and interest earnings designated by Charter
provision. Monies in this fund are to be expended or used exclusively by the library department to
provide library services and materials and to operate library facilities.
Public Protection Fund – Accounts for grants received and revenues and expenditures of 21 special
revenue funds including fingerprinting, vehicle theft crimes, peace officer training and other activities
related to public protection.
Public Works, Transportation and Commerce Fund – Accounts for the revenues and expenditures of 13
special revenue funds including construction inspection, engineering inspection and other activities
related to public works projects. In addition, the fund accounts for various grants from federal and
state agencies expended for specific purposes, activities or facilities related to transportation and
commerce.
Real Property Fund – Accounts for the lease revenue from real property purchased with the proceeds
from certificates of participation. The lease revenue is used for operations and to pay for debt service
of the certificates of participation. Sales and disposals of real property are also accounted for in this
fund.
San Francisco County Transportation Authority Fund – Accounts for the proceeds of a one-half of one
percent increase in local sales tax authorized by the voters for mass transit and other traffic and
transportation purposes.
Senior Citizens Program Fund – Accounts for grant revenues from the federal and state government to
be used to promote the well-being of San Francisco senior citizens.
Tax Increment Financing Districts Fund – Accounts for the activities of various Infrastructure Financing
Districts and Infrastructure and Revitalization Districts which have been established for the purpose of
financing public infrastructure and affordable housing. In addition, the fund accounts for the activities
of Special Tax District or Community Facilities District to which the City has pledged certain tax
increment revenues for debt service purposes.
War Memorial Fund – Accounts for the costs of maintaining, operating and caring for the War Memorial
buildings and grounds.
CITY AND COUNTY OF SAN FRANCISCO
NONMAJOR GOVERNMENTAL FUNDS
225
DEBT SERVICE FUNDS
The Debt Service Funds account for the accumulation of property taxes and other revenues for periodic
payment of interest and principal on general obligation and certain lease revenue bonds, certificates
of participation, and related authorized costs.
General Obligation Bond Fund – Accounts for property taxes and other revenues, (including the tobacco
settlement revenues in excess of the $100 million required to fund the Laguna Honda Hospital
construction project) for periodic payment of interest and principal of general obligation bonds and
related costs. Provisions are made in the general property tax levy for monies sufficient to meet these
requirements in accordance with Article XIII of the State Constitution (Proposition 13).
Certificates of Participation (COP) Funds – Accounts for Base Rental payments from the various Special
Revenue Funds and General Fund which provide for periodic payments of interest and principal. The
COPs are being sold to provide funds to finance the acquisition of existing office buildings and certain
improvements thereto, or the construction of City buildings such as the Courthouse, to be leased to
the City for use of certain City departments as office space.
Other Bond Funds – Accounts for funds and debt service for the revolving fund loans operated and
managed by the Mayor's Office of Community Development to assist with economic development
efforts in low income neighborhoods (Facade Improvement Program) and for the interim financing of
revolving credit facility for the Transbay Joint Powers Authority on the Transbay Transit Center project.
CAPITAL PROJECTS FUNDS
Capital Projects Funds are used to account for financial resources that are restricted, committed or
assigned to expenditures for the acquisition of land or acquisition and construction of major facilities
other than those financed in the proprietary fund types.
City Facilities Improvement Fund – Accounts for bond proceeds, capital lease financing, federal and local
funds and transfers from other funds which are designated for various buildings and general
improvements. Expenditures for acquisition and construction of public buildings and improvements
are made in accordance with bond requirements and appropriation ordinances. Also accounts for
activities reported in the Moscone Convention Center Fund in the prior year.
Recreation and Park Projects Fund – Accounts for bond proceeds, federal and state grants, gifts and
transfers from other funds which are designated for various recreation and park additions and
development. Expenditures for acquisition and construction of recreation and park facilities are made
in accordance with bond requirements and appropriation ordinances.
Street Improvement Fund – Accounts for gas tax subventions, bond fund proceeds and other revenues
which are designated for general street improvements. Expenditures for land acquisition and
construction of designated improvements are made in accordance with applicable state codes, City
charter provisions and bond requirements.
PERMANENT FUND
Permanent funds are used to report resources that are legally restricted to the extent that only earnings,
not principal, may be used for purposes that support the reporting government’s programs.
Bequest Fund – Accounts for income and disbursements of bequests accepted by the City. Disbursements
are made in accordance with terms of the bequests.

CITY AND COUNTY OF SAN FRANCISCO
Combining Balance Sheet
Nonmajor Governmental Funds
June 30, 2023
(In Thousands)
226
Permanent
Fund
Bequest
Fund
Assets:
Deposits and investments with City Treasury........... 3,531,490$ 188,052$ 430,033$ 3,562$ 4,153,137$
Deposits and investments outside City Treasury...... 81,670 73,836 91,501 - 247,007
Receivables:
Property taxes and penalties................................... 3,761 4,877 - - 8,638
Other local taxes...................................................... 110,058 - - - 110,058
Federal and state grants and subventions.............. 178,893 - 27,249 - 206,142
Charges for services............................................... 21,757 - 4 - 21,761
Interest and other..................................................... 24,358 2,543 2,794 19 29,714
Due from other funds................................................. 623 - 14,596 - 15,219
Due from component units........................................ 9,493 - - - 9,493
Loans receivable (net of allowance for uncollectible
amounts).................................................................. 205,461 - - - 205,461
Other assets.............................................................. 16,448 - - - 16,448
Total assets....................................................... 4,184,012$ 269,308$ 566,177$ 3,581$ 5,023,078$
Liabilities:
Accounts payable....................................................... 229,083$ -$ 23,180$ 4$ 252,267$
Accrued payroll........................................................... 33,398 - 1,070 - 34,468
Unearned grant and subvention revenues................. 173,192 - 1,854 10 175,056
Due to other funds...................................................... 88,200 - 8,187 - 96,387
Due to component units............................................. 38 - - - 38
Unearned revenues and other liabilities..................... 198,255 30,079 11,310 - 239,644
Bonds, loans, leases, and other payables................. 20,756 - 18,034 - 38,790
Total liabilities.................................................... 742,922 30,079 63,635 14 836,650
Deferred inflows of resources...................................... 311,257 4,250 15,596 - 331,103
Fund balances:
Nonspendable............................................................ 356 - - - 356
Restricted................................................................... 2,839,933 234,979 487,364 3,567 3,565,843
Assigned..................................................................... 291,062 - - - 291,062
Unassigned................................................................ (1,518) - (418) - (1,936)
Total fund balances........................................... 3,129,833 234,979 486,946 3,567 3,855,325
Total liabilities, deferred inflows of resources
and fund balances........................................... 4,184,012$ 269,308$ 566,177$ 3,581$ 5,023,078$
Special
Revenue
Funds
Debt Service
Funds
Capital
Projects Funds
Total
Nonmajor
Governmental
Funds

CITY AND COUNTY OF SAN FRANCISCO
Combining Statement of Revenues, Expenditures, and Changes
in Fund Balances - Nonmajor Governmental Funds
Year Ended June 30, 2023
(In Thousands)
227
Permanent
Fund
Bequest
Fund
Revenues:
Property taxes................................................................................... 344,341$ 353,645$ -$ -$ 697,986$
Business taxes.................................................................................. 440,325 - - - 440,325
Sales and use tax.............................................................................. 111,474 - - - 111,474
Hotel room tax................................................................................... 26,063 - - - 26,063
Other local taxes............................................................................... 17,678 - - - 17,678
Licenses, permits, and franchises.................................................... 14,203 - - - 14,203
Fines, forfeitures, and penalties........................................................ 22,891 18,240 - - 41,131
Interest and investment income........................................................ 67,902 9,605 10,995 66 88,568
Rents and concessions.................................................................... 172,214 - 219 - 172,433
Intergovernmental:
Federal............................................................................................ 324,727 - 4,280 - 329,007
State................................................................................................ 246,573 625 15,250 - 262,448
Other............................................................................................... 6,616 - 740 - 7,356
Charges for services......................................................................... 144,319 - - - 144,319
Other................................................................................................. 137,723 9,637 30,231 78 177,669
Total revenues.......................................................................... 2,077,049 391,752 61,715 144 2,530,660
Expenditures:
Current:
Public protection............................................................................. 94,234 - - - 94,234
Public works, transportation and commerce.................................. 240,402 - - - 240,402
Human welfare and neighborhood development............................ 1,421,281 - - 2 1,421,283
Community health........................................................................... 201,222 - - - 201,222
Culture and recreation.................................................................... 340,154 - - 141 340,295
General administration and finance................................................ 138,019 - - - 138,019
Distributions to other governments................................................. 49,113 - - - 49,113
Debt service:
Principal retirement......................................................................... 15,543 318,710 - - 334,253
Interest and other fiscal charges.................................................... 15,659 156,314 1,520 - 173,493
Bond issuance costs...................................................................... 5,265 1 481 - 5,747
Capital outlay..................................................................................... - - 148,884 - 148,884
Total expenditures.................................................................... 2,520,892 475,025 150,885 143 3,146,945
Excess (deficiency) of revenues
over (under) expenditures...................................................... (443,843) (83,273) (89,170) 1 (616,285)
Other financing sources (uses):
Transfers in....................................................................................... 479,384 94,250 9,235 - 582,869
Transfers out..................................................................................... (228,015) - (43,459) (9) (271,483)
Issuance of bonds:
Face value of bonds issued............................................................ 200,170 - 67,805 - 267,975
Premium on issuance of bonds...................................................... 3,414 - 2,950 - 6,364
Total other financing sources (uses)....................................... 454,953 94,250 36,531 (9) 585,725
Net changes in fund balances.................................................. 11,110 10,977 (52,639) (8) (30,560)
Fund balances at beginning of year, as previously reported............... 3,107,365 224,002 539,585 3,575 3,874,527
Cumulative effect of accounting change............................................. 11,358 - - - 11,358
Fund balances at beginning of year, as restated................................ 3,118,723 224,002 539,585 3,575 3,885,885
Fund balances at end of year.............................................................. 3,129,833$ 234,979$ 486,946$ 3,567$ 3,855,325$
Special
Revenue
Funds
Debt Service
Funds
Capital
Projects Funds
Total Nonmajor
Governmental
Funds

CITY AND COUNTY OF SAN FRANCISCO
Combining Balance Sheet
Nonmajor Governmental Funds – Special Revenue Funds
June 30, 2023
(In Thousands)
228
Building
Inspection
Fund
Children and
Families Fund
Community /
Neighborhood
Development
Fund
Community
Health Services
Fund
Convention
Facilities
Fund
Culture and
Recreation
Fund
Assets:
Deposits and investments with City Treasury..................... 87,662$ 680,075$ 1,026,646$ 95,097$ 54,863$ 50,821$
Deposits and investments outside City Treasury................ 5 - 4,796 - - 2,777
Receivables:
Property taxes and penalties.......................................... - 1,625 - - - -
Other local taxes.......................................................... - 37,003 - - - -
Federal and state grants and subventions........................ - 3,505 28,846 39,659 - 139
Charges for services...................................................... 276 364 339 11 8,833 434
Interest and other.......................................................... 548 4,299 5,695 589 19 96
Due from other funds....................................................... - - - - - -
Due from component units............................................... - - - - - -
Loans receivable (net of allowance for uncollectible
amounts)...................................................................... 146 - 204,869 - - -
Other assets................................................................... - - 14,612 - - -
Total assets........................................................... 88,637$ 726,871$ 1,285,803$ 135,356$ 63,715$ 54,267$
Liabilities:
Accounts payable........................................................... 1,726$ 39,061$ 30,259$ 35,470$ 8,220$ 5,800$
Accrued payroll............................................................... 3,039 1,306 1,716 2,998 85 363
Unearned grant and subvention revenues........................... - 2,295 46,419 3,491 - 22
Due to other funds........................................................... - - - 356 - -
Due from component units............................................... - - - - - -
Unearned revenues and other liabilities.............................. 9,454 12,963 1,176 - 7,056 819
Bonds, loans, leases, and other payables......................... - - 20,075 - - -
Total liabilities........................................................ 14,219 55,625 99,645 42,315 15,361 7,004
Deferred inflows of resources.............................................. 146 5,018 215,045 20,941 - 102
Fund balances:
Nonspendable................................................................. - - - - - -
Restricted....................................................................... 74,272 666,228 816,276 72,100 48,354 36,522
Assigned........................................................................ - - 154,837 - - 10,639
Unassigned.................................................................... - - - - - -
Total fund balances................................................ 74,272 666,228 971,113 72,100 48,354 47,161
Total liabilities, deferred inflows of resources
and fund balances................................................ 88,637$ 726,871$ 1,285,803$ 135,356$ 63,715$ 54,267$
(Continued)

CITY AND COUNTY OF SAN FRANCISCO
Combining Balance Sheet
Nonmajor Governmental Funds – Special Revenue Funds (Continued)
June 30, 2023
(In Thousands)
229
Environmental
Protection
Fund
Gasoline Tax
Fund
General
Services Fund
Gift and Other
Expendable
Trusts Fund
Golf Fund
Human
Welfare Fund
Assets:
Deposits and investments with City Treasury..................... 3,308$ 101,290$ 37,897$ 22,826$ 11,511$ 95,550$
Deposits and investments outside City Treasury................ - - - 3 - -
Receivables:
Property taxes and penalties.......................................... - - - - - -
Other local taxes.......................................................... - - - - - -
Federal and state grants and subventions........................ 1,278 8,273 1,041 - - 10,456
Charges for services...................................................... 9 668 833 248 185 -
Interest and other.......................................................... - 392 591 45 77 218
Due from other funds....................................................... 29 - - - - -
Due from component units............................................... - - - - - -
Loans receivable (net of allowance for uncollectible
amounts)...................................................................... - - - - - -
Other assets................................................................... - - - - - 825
Total assets........................................................... 4,624$ 110,623$ 40,362$ 23,122$ 11,773$ 107,049$
Liabilities:
Accounts payable........................................................... 524$ 6,195$ 2,813$ 850$ 1,701$ 21,003$
Accrued payroll............................................................... 234 728 926 34 389 507
Unearned grant and subvention revenues........................... 1,694 - 7,054 367 - 66,014
Due to other funds........................................................... - - - - - -
Due from component units............................................... - - - - - -
Unearned revenues and other liabilities.............................. - 6 44 - - 21
Bonds, loans, leases, and other payables......................... - - - - - -
Total liabilities........................................................ 2,452 6,929 10,837 1,251 2,090 87,545
Deferred inflows of resources.............................................. 710 666 322 242 - 2,228
Fund balances:
Nonspendable................................................................. - - - - - -
Restricted....................................................................... 1,462 103,028 7,594 21,629 - 16,972
Assigned........................................................................ - - 21,609 - 9,683 304
Unassigned.................................................................... - - - - - -
Total fund balances................................................ 1,462 103,028 29,203 21,629 9,683 17,276
Total liabilities, deferred inflows of resources
and fund balances................................................ 4,624$ 110,623$ 40,362$ 23,122$ 11,773$ 107,049$
(Continued)

CITY AND COUNTY OF SAN FRANCISCO
Combining Balance Sheet
Nonmajor Governmental Funds – Special Revenue Funds (Continued)
June 30, 2023
(In Thousands)
230
Low and
Moderate
Income
Housing Asset
Fund
Open Space
and Park Fund
Our City Our
Home Fund
Public Library
Fund
Public
Protection
Fund
Public Works,
Transportation
and Commerce
Fund
Assets:
Deposits and investments with City Treasury..................... 70,352$ 81,081$ 630,143$ 159,706$ 77,915$ 115,293$
Deposits and investments outside City Treasury................ - - - - 822 2
Receivables:
Property taxes and penalties.......................................... - 1,068 - 1,068 - -
Other local taxes.......................................................... - - 51,806 - - 1,366
Federal and state grants and subventions........................ - - - 6,605 42,250 -
Charges for services...................................................... - - 238 8 2,805 5,207
Interest and other.......................................................... 443 477 3,781 438 68 246
Due from other funds....................................................... - - - - - -
Due from component units............................................... - - - - - 3,622
Loans receivable (net of allowance for uncollectible
amounts)...................................................................... 446 - - - - -
Other assets................................................................... - 491 164 - - -
Total assets........................................................... 71,241$ 83,117$ 686,132$ 167,825$ 123,860$ 125,736$
Liabilities:
Accounts payable........................................................... 5,506$ 636$ 30,482$ 4,718$ 5,512$ 2,662$
Accrued payroll............................................................... 76 1,524 1,077 5,778 2,692 6,636
Unearned grant and subvention revenues........................... - - - 7,892 36,387 1,500
Due to other funds........................................................... - - - - - 281
Due from component units............................................... - - - - - -
Unearned revenues and other liabilities.............................. 896 6,630 144,657 6,628 19 6,086
Bonds, loans, leases, and other payables......................... - - - - 681 -
Total liabilities........................................................ 6,478 8,790 176,216 25,016 45,291 17,165
Deferred inflows of resources.............................................. 446 941 215 944 18,730 4,290
Fund balances:
Nonspendable................................................................. - - - - - -
Restricted....................................................................... 64,317 73,386 509,701 140,852 55,282 15,861
Assigned........................................................................ - - - 1,013 4,557 88,420
Unassigned.................................................................... - - - - - -
Total fund balances................................................ 64,317 73,386 509,701 141,865 59,839 104,281
Total liabilities, deferred inflows of resources
and fund balances................................................ 71,241$ 83,117$ 686,132$ 167,825$ 123,860$ 125,736$
(Continued)

CITY AND COUNTY OF SAN FRANCISCO
Combining Balance Sheet
Nonmajor Governmental Funds – Special Revenue Funds (Continued)
June 30, 2023
(In Thousands)
231
Real Property
Fund
San Francisco
County
Transportation
Authority Fund
Senior Citizens
Program Fund
Tax Increment
Financing
Districts Fund
War Memorial
Fund
Total
Assets:
Deposits and investments with City Treasury..................... 45,801$ 70,490$ -$ 3,883$ 9,280$ 3,531,490$
Deposits and investments outside City Treasury................ 204 51,149 - 21,912 - 81,670
Receivables:
Property taxes and penalties.......................................... - - - - - 3,761
Other local taxes.......................................................... - 19,883 - - - 110,058
Federal and state grants and subventions........................ - 34,054 2,787 - - 178,893
Charges for services...................................................... 1,078 - - - 221 21,757
Interest and other.......................................................... 682 5,494 - 103 57 24,358
Due from other funds....................................................... - 594 - - - 623
Due from component units............................................... - 5,871 - - - 9,493
Loans receivable (net of allowance for uncollectible
amounts)...................................................................... - - - - - 205,461
Other assets................................................................... - 356 - - - 16,448
Total assets........................................................... 47,765$ 187,891$ 2,787$ 25,898$ 9,558$ 4,184,012$
Liabilities:
Accounts payable........................................................... 5,001$ 19,637$ 978$ 214$ 115$ 229,083$
Accrued payroll............................................................... 2,336 367 - - 587 33,398
Unearned grant and subvention revenues........................... - 57 - - - 173,192
Due to other funds........................................................... - 85,251 1,809 503 - 88,200
Due from component units............................................... - 38 - - - 38
Unearned revenues and other liabilities.............................. 1,800 - - - - 198,255
Bonds, loans, leases, and other payables......................... - - - - - 20,756
Total liabilities........................................................ 9,137 105,350 2,787 717 702 742,922
Deferred inflows of resources.............................................. 31 38,722 1,518 - - 311,257
Fund balances:
Nonspendable................................................................. - 356 - - - 356
Restricted....................................................................... 38,597 43,463 - 25,181 8,856 2,839,933
Assigned........................................................................ - - - - - 291,062
Unassigned.................................................................... - - (1,518) - - (1,518)
Total fund balances................................................ 38,597 43,819 (1,518) 25,181 8,856 3,129,833
Total liabilities, deferred inflows of resources
and fund balances................................................ 47,765$ 187,891$ 2,787$ 25,898$ 9,558$ 4,184,012$

CITY AND COUNTY OF SAN FRANCISCO
Combining Statement of Revenues, Expenditures,
and Changes in Fund Balances
Nonmajor Governmental Funds – Special Revenue Funds
Year Ended June 30, 2023
(In Thousands)
232
Building
Inspection
Fund
Children and
Families Fund
Community /
Neighborhood
Development
Fund
Community
Health
Services
Fund
Convention
Facilities
Fund
Culture and
Recreation
Fund
Revenues:
Property taxes..................................................... -$ 174,221$ -$ -$ -$ -$
Business taxes................................................... - 190,009 2,561 - - -
Sales and use tax............................................... - - - - - -
Hotel room tax..................................................... - - - - - 26,063
Other local taxes................................................. - - 697 - - -
Licenses, permits, and franchises..................... 6,907 - - - - -
Fines, forfeitures, and penalties.......................... - - 730 11,679 - -
Interest and investment income.......................... 2,634 10,650 24,236 1,708 483 785
Rents and concessions...................................... - - 774 - 46,884 560
Intergovernmental:
Federal.............................................................. - 8,794 69,564 77,525 - 100
State.................................................................. - 11,849 31,906 56,653 - 108
Other................................................................. - - - - - 64
Charges for services.......................................... 45,779 106 14,735 2,754 - 7,547
Other................................................................... 15 22,228 95,177 1,290 15 2,537
Total revenues........................................... 55,335 417,857 240,380 151,609 47,382 37,764
Expenditures:
Current:
Public protection............................................... - - - 45 - -
Public works, transportation and commerce... 82,559 170 17,800 2,093 - 375
Human welfare and neighborhood
development................................................... - 437,712 471,086 489 - 3,030
Community health............................................. - - 153 144,513 - -
Culture and recreation...................................... - - 673 - 55,555 18,029
General administration and finance.................. - 127 6,362 - - 16,812
Distributions to other governments.................. - 49,113 - - - -
Debt service:
Principal retirement........................................... - - - - - 518
Interest and other fiscal charges...................... - - 1,471 - - 941
Bond issuance costs........................................ - - 4,003 - - -
Total expenditures...................................... 82,559 487,122 501,548 147,140 55,555 39,705
Excess (deficiency) of revenues
over (under) expenditures........................ (27,224) (69,265) (261,168) 4,469 (8,173) (1,941)
Other financing sources (uses):
Transfers in......................................................... 325 144,685 50,151 126 51,323 3,798
Transfers out....................................................... (121) (28,674) (11,443) - (30,855) (494)
Issuance of bonds:
Face value of bonds issued.............................. - - 170,780 - - -
Premium on issuance of bonds....................... - - 2,471 - - -
Total other financing sources (uses)......... 204 116,011 211,959 126 20,468 3,304
Net changes in fund balances................... (27,020) 46,746 (49,209) 4,595 12,295 1,363
Fund balances at beginning of year
as previously reported......................................... 101,292 619,482 1,020,322 67,505 36,059 45,798
Cumulative effect of accounting change............... - - - - - -
Fund balances at beginning of year, as restated.. 101,292 619,482 1,020,322 67,505 36,059 45,798
Fund balances at end of year................................ 74,272$ 666,228$ 971,113$ 72,100$ 48,354$ 47,161$
(Continued)

CITY AND COUNTY OF SAN FRANCISCO
Combining Statement of Revenues, Expenditures,
and Changes in Fund Balances
Nonmajor Governmental Funds – Special Revenue Funds (Continued)
Year Ended June 30, 2023
(In Thousands)
233
Environmental
Protection
Fund
Gasoline
Tax Fund
General
Services
Fund
Gift and
Other
Expendable
Trusts Fund
Golf Fund
Human
Welfare Fund
Revenues:
Property taxes..................................................... -$ -$ -$ -$ -$ -$
Business taxes................................................... - - - - - -
Sales and use tax............................................... - - - - - -
Hotel room tax..................................................... - - - - - -
Other local taxes................................................. - - - - - -
Licenses, permits, and franchises..................... - - 1,903 - - 260
Fines, forfeitures, and penalties.......................... - - - 1,164 - 7
Interest and investment income.......................... - 1,164 419 374 265 1,068
Rents and concessions...................................... - - 1,080 - 4,718 -
Intergovernmental:
Federal.............................................................. 77 - 221 - - 112,549
State.................................................................. 3,263 61,150 6,640 - - 43,705
Other................................................................. 57 - - - - -
Charges for services.......................................... 971 - 1,187 23 9,649 164
Other................................................................... 50 39 1,809 1,806 - 199
Total revenues........................................... 4,418 62,353 13,259 3,367 14,632 157,952
Expenditures:
Current:
Public protection............................................... - - 195 131 - -
Public works, transportation and commerce... - 41,453 - 1,268 - 1,067
Human welfare and neighborhood
development................................................... 6,379 - - 93 - 224,146
Community health............................................. - - - 132 - -
Culture and recreation...................................... - - 1,025 917 19,431 -
General administration and finance.................. - 4 12,283 31 - 62
Distributions to other governments.................. - - - - - -
Debt service:
Principal retirement........................................... - - - - - -
Interest and other fiscal charges...................... - - - - - -
Bond issuance costs........................................ - - - - - -
Total expenditures...................................... 6,379 41,457 13,503 2,572 19,431 225,275
Excess (deficiency) of revenues
over (under) expenditures........................ (1,961) 20,896 (244) 795 (4,799) (67,323)
Other financing sources (uses):
Transfers in......................................................... 3,004 - 127 - 5,453 70,558
Transfers out....................................................... - (3,253) (74) (254) (1,180) (518)
Issuance of bonds:
Face value of bonds issued.............................. - - - - - -
Premium on issuance of bonds....................... - - - - - -
Total other financing sources (uses)......... 3,004 (3,253) 53 (254) 4,273 70,040
Net changes in fund balances................... 1,043 17,643 (191) 541 (526) 2,717
Fund balances at beginning of year
as previously reported......................................... 419 85,385 29,394 21,088 10,209 14,559
Cumulative effect of accounting change............... - - - - - -
Fund balances at beginning of year, as restated.. 419 85,385 29,394 21,088 10,209 14,559
Fund balances at end of year................................ 1,462$ 103,028$ 29,203$ 21,629$ 9,683$ 17,276$
(Continued)

CITY AND COUNTY OF SAN FRANCISCO
Combining Statement of Revenues, Expenditures,
and Changes in Fund Balances
Nonmajor Governmental Funds – Special Revenue Funds (Continued)
Year Ended June 30, 2023
(In Thousands)
234
Low and
Moderate
Income
Housing
Asset Fund
Open Space
and Park
Fund
Our City Our
Home Fund
Public Library
Fund
Public
Protection
Fund
Public Works,
Transportation
and Commerce
Fund
Revenues:
Property taxes..................................................... -$ 78,261$ -$ 78,261$ -$ -$
Business taxes................................................... - - 247,755 - - -
Sales and use tax............................................... - - - - - -
Hotel room tax..................................................... - - - - - -
Other local taxes................................................. - - - - - 16,981
Licenses, permits, and franchises..................... - - - - 481 -
Fines, forfeitures, and penalties.......................... - - - - 9,265 46
Interest and investment income.......................... 6,422 1,099 8,915 2,014 1,693 1,771
Rents and concessions...................................... 6,681 - 1,184 - - -
Intergovernmental:
Federal.............................................................. - - - - 47,397 -
State.................................................................. - 139 - 202 26,380 51
Other................................................................. 1,124 - - - 45 3,332
Charges for services.......................................... - - - 147 18,074 41,967
Other................................................................... 3,489 - 217 598 2,520 176
Total revenues........................................... 17,716 79,499 258,071 81,222 105,855 64,324
Expenditures:
Current:
Public protection............................................... - - 911 - 92,952 -
Public works, transportation and commerce... - 1,875 3,089 3,942 15 40,547
Human welfare and neighborhood
development................................................... 11,538 - 233,944 - 6,636 15,245
Community health............................................. - - 56,424 - - -
Culture and recreation...................................... - 62,237 - 160,568 - 97
General administration and finance.................. - - 1,404 28 2,760 239
Distributions to other governments.................. - - - - - -
Debt service:
Principal retirement........................................... - - - - - -
Interest and other fiscal charges...................... - - - - 192 -
Bond issuance costs........................................ - - - - - -
Total expenditures...................................... 11,538 64,112 295,772 164,538 102,555 56,128
Excess (deficiency) of revenues
over (under) expenditures........................ 6,178 15,387 (37,701) (83,316) 3,300 8,196
Other financing sources (uses):
Transfers in......................................................... - 1,180 - 102,120 569 23,021
Transfers out....................................................... (1) (13,334) - (3,277) (2,993) (20,233)
Issuance of bonds:
Face value of bonds issued.............................. - - - - - -
Premium on issuance of bonds....................... - - - - - -
Total other financing sources (uses)......... (1) (12,154) - 98,843 (2,424) 2,788
Net changes in fund balances................... 6,177 3,233 (37,701) 15,527 876 10,984
Fund balances at beginning of year
as previously reported......................................... 58,140 70,153 547,402 126,338 58,963 93,297
Cumulative effect of accounting change............... - - - - - -
Fund balances at beginning of year, as restated.. 58,140 70,153 547,402 126,338 58,963 93,297
Fund balances at end of year................................ 64,317$ 73,386$ 509,701$ 141,865$ 59,839$ 104,281$
(Continued)

CITY AND COUNTY OF SAN FRANCISCO
Combining Statement of Revenues, Expenditures,
and Changes in Fund Balances
Nonmajor Governmental Funds – Special Revenue Funds (Continued)
Year Ended June 30, 2023
(In Thousands)
235
Real
Property
Fund
San Francisco
County
Transportation
Authority Fund
Senior
Citizens
Program
Fund
Tax
Increment
Financing
Districts
Fund
War Memorial
Fund
Total
Revenues:
Property taxes..................................................... -$ -$ -$ 13,598 -$ 344,341$
Business taxes................................................... - - - - - 440,325
Sales and use tax............................................... - 111,474 - - - 111,474
Hotel room tax..................................................... - - - - - 26,063
Other local taxes................................................. - - - - - 17,678
Licenses, permits, and franchises..................... - 4,652 - - - 14,203
Fines, forfeitures, and penalties.......................... - - - - - 22,891
Interest and investment income.......................... 213 971 - 728 290 67,902
Rents and concessions...................................... 106,536 - - - 3,797 172,214
Intergovernmental:
Federal.............................................................. - 2,009 6,491 - - 324,727
State.................................................................. - 551 3,976 - - 246,573
Other................................................................. 859 1,135 - - - 6,616
Charges for services.......................................... 574 - - - 642 144,319
Other................................................................... 5,558 - - - - 137,723
Total revenues........................................... 113,740 120,792 10,467 14,326 4,729 2,077,049
Expenditures:
Current:
Public protection............................................... - - - - - 94,234
Public works, transportation and commerce... 667 43,360 - 91 31 240,402
Human welfare and neighborhood
development................................................... - - 10,983 - - 1,421,281
Community health............................................. - - - - - 201,222
Culture and recreation...................................... 423 - - - 21,199 340,154
General administration and finance.................. 75,320 - - 22,587 - 138,019
Distributions to other governments.................. - - - - - 49,113
Debt service:
Principal retirement........................................... - 15,025 - - - 15,543
Interest and other fiscal charges...................... 5 7,502 - 5,548 - 15,659
Bond issuance costs........................................ - - - 1,262 - 5,265
Total expenditures...................................... 76,415 65,887 10,983 29,488 21,230 2,520,892
Excess (deficiency) of revenues
over (under) expenditures........................ 37,325 54,905 (516) (15,162) (16,501) (443,843)
Other financing sources (uses):
Transfers in......................................................... - 8,372 39 - 14,533 479,384
Transfers out....................................................... (26,125) (80,433) - (4,711) (42) (228,015)
Issuance of bonds:
Face value of bonds issued.............................. - - - 29,390 - 200,170
Premium on issuance of bonds....................... - - - 943 - 3,414
Total other financing sources (uses)......... (26,125) (72,061) 39 25,622 14,491 454,953
Net changes in fund balances................... 11,200 (17,156) (477) 10,460 (2,010) 11,110
Fund balances at beginning of year
as previously reported......................................... 27,397 60,975 (1,041) 3,363 10,866 3,107,365
Cumulative effect of accounting change............... - - - 11,358 - 11,358
Fund balances at beginning of year, as restated.. 27,397 60,975 (1,041) 14,721 10,866 3,118,723
Fund balances at end of year................................ 38,597$ 43,819$ (1,518)$ 25,181 8,856$ 3,129,833$

CITY AND COUNTY OF SAN FRANCISCO
Combining Schedule of Revenues, Expenditures, and Changes
in Fund Balances – Budget and Actual – Budget Basis
Nonmajor Governmental Funds – Special Revenue Funds
Year Ended June 30, 2023
(In Thousands)
236
Building Inspection Fund Children and Families Fund
Original
Budget
Final Budget Actual
Variance
Positive
(Negative)
Original
Budget
Final Budget Actual
Variance
Positive
(Negative)
Revenues:
Property taxes......................................................... -$ -$ -$ -$ 121,210$ 170,283$ 174,221$ 3,938$
Business taxes....................................................... - - - - 226,300 190,009 190,009 -
Sales and use tax................................................... - - - - - - - -
Hotel room tax......................................................... - - - - - - - -
Other local taxes..................................................... - - - - - - - -
Licenses, permits, and franchises......................... 6,938 6,938 6,907 (31) - - - -
Fines, forfeitures, and penalties.............................. - - - - - - - -
Interest and investment income.............................. 1,422 1,422 1,924 502 830 12,531 13,794 1,263
Rents and concessions.......................................... - - - - - - - -
Intergovernmental:
Federal.................................................................. - - - - 8,790 8,900 8,908 8
State...................................................................... - - - - 13,668 12,732 12,716 (16)
Other..................................................................... - - - - - - - -
Charges for services.............................................. 49,436 49,480 45,779 (3,701) 2,000 228 228 -
Other....................................................................... - - 15 15 1,168 22,658 22,228 (430)
Total revenues............................................... 57,796 57,840 54,625 (3,215) 373,966 417,341 422,104 4,763
Expenditures:
Current:
Public protection................................................... - - - - - - - -
Public works, transportation and commerce....... 92,642 86,664 82,559 4,105 - 170 170 -
Human welfare and neighborhood development.. - - - - 493,249 450,523 437,712 12,811
Community health................................................. - - - - - - - -
Culture and recreation.......................................... - - - - - - - -
General administration and finance...................... - - - - - 127 127 -
Distributions to other governments...................... - - - - - 49,113 49,113 -
Debt service:
Principal retirement............................................... - - - - - - - -
Interest and other fiscal charges.......................... - - - - - - - -
Bond issuance costs............................................ - - - - - - - -
Total expenditures.......................................... 92,642 86,664 82,559 4,105 493,249 499,933 487,122 12,811
Excess (deficiency) of revenues
over (under) expenditures............................ (34,846) (28,824) (27,934) 890 (119,283) (82,592) (65,018) 17,574
Other financing sources (uses):
Transfers in............................................................. 325 325 325 - 140,290 144,685 144,685 -
Transfers out........................................................... - - - - (34,000) (28,501) (28,501) -
Issuance of commercial paper............................... - - - - - - - -
Issuance of bonds................................................... - - - - - - - -
Premium on issuance of bonds.............................. - - - - - - - -
Budget reserves and designations......................... - - - - - - - -
Total other financing sources (uses)............. 325 325 325 - 106,290 116,184 116,184 -
Net changes in fund balances....................... (34,521) (28,499) (27,609) 890 (12,993) 33,592 51,166 17,574
Budgetary fund balances, July 1,
as previously reported............................................. 34,521 104,444 104,444 - 12,993 640,114 640,114 -
Cumulative effect of accounting change................... - - - - - - - -
Budgetary fund balances, July 1, as restated........... 34,521 104,444 104,444 - 12,993 640,114 640,114 -
Budgetary fund balances, June 30............................ -$ 75,945$ 76,835$ 890$ -$ 673,706$ 691,280$ 17,574$
(Continued)

CITY AND COUNTY OF SAN FRANCISCO
Combining Schedule of Revenues, Expenditures, and Changes
in Fund Balances – Budget and Actual – Budget Basis
Nonmajor Governmental Funds – Special Revenue Funds (Continued)
Year Ended June 30, 2023
(In Thousands)
237
Community Health Services Fund Convention Facilities Fund
Original
Budget
Final Budget Actual
Variance
Positive
(Negative)
Original
Budget
Final Budget Actual
Variance
Positive
(Negative)
Revenues:
Property taxes......................................................... -$ -$ -$ -$ -$ -$ -$ -$
Business taxes....................................................... 2,500 2,561 2,561 - - - - -
Sales and use tax................................................... - - - - - - - -
Hotel room tax......................................................... - - - - - - - -
Other local taxes..................................................... 2,500 697 697 - - - - -
Licenses, permits, and franchises......................... - - - - - - - -
Fines, forfeitures, and penalties.............................. - 730 730 - 5,017 11,679 11,679 -
Interest and investment income.............................. - 25,261 25,261 - 228 2,038 2,038 -
Rents and concessions.......................................... 30 774 774 - - - - -
Intergovernmental:
Federal.................................................................. 7,139 72,565 72,565 - 89,287 72,706 72,706 -
State...................................................................... 2,106 34,997 34,997 - 89,352 57,466 57,466 -
Other..................................................................... - - - - - - - -
Charges for services.............................................. 15,376 14,434 14,735 301 130 2,754 2,754 -
Other....................................................................... 24,819 95,177 95,177 - 853 1,688 1,339 (349)
Total revenues............................................... 54,470 247,196 247,497 301 184,867 148,331 147,982 (349)
Expenditures:
Current:
Public protection................................................... - - - - - 45 45 -
Public works, transportation and commerce....... 9,501 17,800 17,800 - - 2,093 2,093 -
Human welfare and neighborhood development.. 86,590 474,399 469,519 4,880 609 489 489 -
Community health................................................. - 153 153 - 184,258 144,390 144,390 -
Culture and recreation.......................................... 1,336 673 673 - - - - -
General administration and finance...................... 10,685 6,362 6,362 - - - - -
Distributions to other governments...................... - - - - - - - -
Debt service:
Principal retirement............................................... - 2,250 2,250 - - - - -
Interest and other fiscal charges.......................... - 1,471 1,471 - - - - -
Bond issuance costs............................................ - 749 749 - - - - -
Total expenditures.......................................... 108,112 503,857 498,977 4,880 184,867 147,017 147,017 -
Excess (deficiency) of revenues
over (under) expenditures............................ (53,642) (256,661) (251,480) 5,181 - 1,314 965 (349)
Other financing sources (uses):
Transfers in............................................................. 46,989 50,151 50,151 - - 2 2 -
Transfers out........................................................... (3,250) (7,382) (7,382) - - - - -
Issuance of commercial paper............................... - 4,573 4,573 - - - - -
Issuance of bonds................................................... - 169,997 169,997 - - - - -
Premium on issuance of bonds.............................. - - - - - - - -
Budget reserves and designations......................... (10) - - - - - - -
Total other financing sources (uses)............. 43,729 217,339 217,339 - - 2 2 -
Net changes in fund balances....................... (9,913) (39,322) (34,141) 5,181 - 1,316 967 (349)
Budgetary fund balances, July 1,
as previously reported............................................. 9,913 1,058,178 1,058,178 - - 95,077 95,077 -
Cumulative effect of accounting change................... - - - - - - - -
Budgetary fund balances, July 1, as restated........... 9,913 1,058,178 1,058,178 - - 95,077 95,077 -
Budgetary fund balances, June 30............................ -$ 1,018,856$ 1,024,037$ 5,181$ -$ 96,393$ 96,044$ (349)$
(Continued)
Community / Neighborhood Development Fund

CITY AND COUNTY OF SAN FRANCISCO
Combining Schedule of Revenues, Expenditures, and Changes
in Fund Balances – Budget and Actual – Budget Basis
Nonmajor Governmental Funds – Special Revenue Funds (Continued)
Year Ended June 30, 2023
(In Thousands)
238
Convention Facilities Fund Culture and Recreation Fund Environmental Protection Fund
Original
Budget
Final Budget Actual
Variance
Positive
(Negative)
Original
Budget
Final
Budget
Actual
Variance
Positive
(Negative)
Revenues:
Property taxes......................................................... -$ -$ -$ -$ -$ -$ -$ -$
Business taxes....................................................... - - - - - - - -
Sales and use tax................................................... - - - - - - - -
Hotel room tax......................................................... - - - - 23,170 26,063 26,063 -
Other local taxes..................................................... - - - - - - - -
Licenses, permits, and franchises......................... - - - - - - - -
Fines, forfeitures, and penalties.............................. - - - - - - - -
Interest and investment income.............................. - 113 113 - - 321 321 -
Rents and concessions.......................................... 41,139 44,329 46,884 2,555 575 583 562 (21)
Intergovernmental:
Federal.................................................................. - - - - - 100 100 -
State...................................................................... - - - - - 95 95 -
Other..................................................................... - - - - - 63 63 -
Charges for services.............................................. - - - - 6,619 7,258 7,547 289
Other....................................................................... - 15 15 - 1,818 2,537 2,537 -
Total revenues............................................... 41,139 44,457 47,012 2,555 32,182 37,020 37,288 268
Expenditures:
Current:
Public protection................................................... - - - - - - - -
Public works, transportation and commerce....... - - - - 825 375 375 -
Human welfare and neighborhood development.. - - - - 2,940 3,030 3,030 -
Community health................................................. - - - - - - - -
Culture and recreation.......................................... 69,308 66,660 55,555 11,105 20,373 18,264 18,029 235
General administration and finance...................... - - - - 15,977 16,812 16,812 -
Distributions to other governments...................... - - - - - - - -
Debt service:
Principal retirement............................................... 27,713 506 506 - 831 656 518 138
Interest and other fiscal charges.......................... - - - - 1,049 1,225 1,225 -
Bond issuance costs............................................ - - - - - - - -
Total expenditures.......................................... 97,021 67,166 56,061 11,105 41,995 40,362 39,989 373
Excess (deficiency) of revenues
over (under) expenditures............................ (55,882) (22,709) (9,049) 13,660 (9,813) (3,342) (2,701) 641
Other financing sources (uses):
Transfers in............................................................. 53,764 51,323 51,323 - 4,388 3,798 3,798 -
Transfers out........................................................... - (29,985) (29,985) - - - - -
Issuance of commercial paper............................... - - - - - - - -
Issuance of bonds................................................... - - - - - - - -
Premium on issuance of bonds.............................. - - - - - - - -
Budget reserves and designations......................... (230) (230) - 230 - - - -
Total other financing sources (uses)............. 53,534 21,108 21,338 230 4,388 3,798 3,798 -
Net changes in fund balances....................... (2,348) (1,601) 12,289 13,890 (5,425) 456 1,097 641
Budgetary fund balances, July 1,
as previously reported............................................. 2,348 40,944 40,944 - 5,425 48,769 48,769 -
Cumulative effect of accounting change................... - - - - - - - -
Budgetary fund balances, July 1, as restated........... 2,348 40,944 40,944 - 5,425 48,769 48,769 -
Budgetary fund balances, June 30............................ -$ 39,343$ 53,233$ 13,890$ -$ 49,225$ 49,866$ 641$
(Continued)

CITY AND COUNTY OF SAN FRANCISCO
Combining Schedule of Revenues, Expenditures, and Changes
in Fund Balances – Budget and Actual – Budget Basis
Nonmajor Governmental Funds – Special Revenue Funds (Continued)
Year Ended June 30, 2023
(In Thousands)
239
Environmental Protection Fund Gasoline Tax Fund General Services Fund
Original
Budget
Final
Budget
Actual
Variance
Positive
(Negative)
Original
Budget
Final Budget Actual
Variance
Positive
(Negative)
Revenues:
Property taxes......................................................... -$ -$ -$ -$ -$ -$ -$ -$
Business taxes....................................................... - - - - - - - -
Sales and use tax................................................... - - - - - - - -
Hotel room tax......................................................... - - - - - - - -
Other local taxes..................................................... - - - - - - - -
Licenses, permits, and franchises......................... - - - - - - - -
Fines, forfeitures, and penalties.............................. - - - - - - - -
Interest and investment income.............................. - - - - 42 746 1,284 538
Rents and concessions.......................................... - - - - - - - -
Intergovernmental:
Federal.................................................................. - 77 77 - - - - -
State...................................................................... 5,922 3,528 3,528 - 62,967 61,897 61,150 (747)
Other..................................................................... - 53 53 - - - - -
Charges for services.............................................. 1,118 988 976 (12) 666 666 353 (313)
Other....................................................................... 2,276 2,326 50 (2,276) 1 - 39 39
Total revenues............................................... 9,316 6,972 4,684 (2,288) 63,676 63,309 62,826 (483)
Expenditures:
Current:
Public protection................................................... - - - - - - - -
Public works, transportation and commerce....... - - - - 63,072 48,942 41,453 7,489
Human welfare and neighborhood development.. 12,245 8,713 6,338 2,375 - - - -
Community health................................................. - - - - - - - -
Culture and recreation.......................................... - - - - - - - -
General administration and finance...................... - - - - - 4 4 -
Distributions to other governments...................... - - - - - - - -
Debt service:
Principal retirement............................................... - - - - - - - -
Interest and other fiscal charges.......................... - - - - - - - -
Bond issuance costs............................................ - - - - - - - -
Total expenditures.......................................... 12,245 8,713 6,338 2,375 63,072 48,946 41,457 7,489
Excess (deficiency) of revenues
over (under) expenditures............................ (2,929) (1,741) (1,654) 87 604 14,363 21,369 7,006
Other financing sources (uses):
Transfers in............................................................. 2,929 2,962 2,962 - - - - -
Transfers out........................................................... - - - - (3,099) (3,099) (2,992) 107
Issuance of commercial paper............................... - - - - - - - -
Issuance of bonds................................................... - - - - - - - -
Premium on issuance of bonds.............................. - - - - - - - -
Budget reserves and designations......................... - - - - - - - -
Total other financing sources (uses)............. 2,929 2,962 2,962 - (3,099) (3,099) (2,992) 107
Net changes in fund balances....................... - 1,221 1,308 87 (2,495) 11,264 18,377 7,113
Budgetary fund balances, July 1,
as previously reported............................................. - 865 865 - 2,495 87,418 87,418 -
Cumulative effect of accounting change................... - - - - - - - -
Budgetary fund balances, July 1, as restated........... - 865 865 - 2,495 87,418 87,418 -
Budgetary fund balances, June 30............................ -$ 2,086$ 2,173$ 87$ -$ 98,682$ 105,795$ 7,113$
(Continued)

CITY AND COUNTY OF SAN FRANCISCO
Combining Schedule of Revenues, Expenditures, and Changes
in Fund Balances – Budget and Actual – Budget Basis
Nonmajor Governmental Funds – Special Revenue Funds (Continued)
Year Ended June 30, 2023
(In Thousands)
240
General Services Fund Gift and Other Expendable Trusts Fund Golf Fund
Original
Budget
Final
Budget
Actual
Variance
Positive
(Negative)
Original
Budget
Final Budget Actual
Variance
Positive
(Negative)
Revenues:
Property taxes......................................................... -$ -$ -$ -$ -$ -$ -$ -$
Business taxes....................................................... - - - - - - - -
Sales and use tax................................................... - - - - - - - -
Hotel room tax......................................................... - - - - - - - -
Other local taxes..................................................... - - - - - - - -
Licenses, permits, and franchises......................... 1,828 1,903 1,903 - - - - -
Fines, forfeitures, and penalties.............................. - - - - - 1,224 1,224 -
Interest and investment income.............................. 90 416 416 - - 153 153 -
Rents and concessions.......................................... - 1,080 1,080 - - - - -
Intergovernmental:
Federal.................................................................. - 178 178 - - - - -
State...................................................................... 324 6,778 6,778 - - - - -
Other..................................................................... - - - - - - - -
Charges for services.............................................. 2,113 1,187 1,187 - - 23 23 -
Other....................................................................... 1,928 1,796 1,796 - 1,005 1,806 1,806 -
Total revenues............................................... 6,283 13,338 13,338 - 1,005 3,206 3,206 -
Expenditures:
Current:
Public protection................................................... 310 195 195 - - 131 131 -
Public works, transportation and commerce....... - - - - - 1,268 1,268 -
Human welfare and neighborhood development.. - - - - 255 92 92 -
Community health................................................. - - - - - 132 132 -
Culture and recreation.......................................... - 1,025 1,025 - 750 917 917 -
General administration and finance...................... 6,930 12,252 12,252 - - 31 31 -
Distributions to other governments...................... - - - - - - - -
Debt service:
Principal retirement............................................... - - - - - - - -
Interest and other fiscal charges.......................... - - - - - - - -
Bond issuance costs............................................ - - - - - - - -
Total expenditures.......................................... 7,240 13,472 13,472 - 1,005 2,571 2,571 -
Excess (deficiency) of revenues
over (under) expenditures............................ (957) (134) (134) - - 635 635 -
Other financing sources (uses):
Transfers in............................................................. 159 127 127 - - - - -
Transfers out........................................................... - - - - - - - -
Issuance of commercial paper............................... - - - - - - - -
Issuance of bonds................................................... - - - - - - - -
Premium on issuance of bonds.............................. - - - - - - - -
Budget reserves and designations......................... - - - - - - - -
Total other financing sources (uses)............. 159 127 127 - - - - -
Net changes in fund balances....................... (798) (7) (7) - - 635 635 -
Budgetary fund balances, July 1,
as previously reported............................................. 798 30,172
30,172 - - 21,475 21,475 -
Cumulative effect of accounting change................... - - - - - - - -
Budgetary fund balances, July 1, as restated........... 798 30,172 30,172 - - 21,475 21,475 -
Budgetary fund balances, June 30............................ -$ 30,165$ 30,165$ -$ -$ 22,110$ 22,110$ -$
(Continued)

CITY AND COUNTY OF SAN FRANCISCO
Combining Schedule of Revenues, Expenditures, and Changes
in Fund Balances – Budget and Actual – Budget Basis
Nonmajor Governmental Funds – Special Revenue Funds (Continued)
Year Ended June 30, 2023
(In Thousands)
241
Golf Fund Human Welfare Fund Low and Moderate Income Housing Asset Fund
Original
Budget
Final
Budget
Actual
Variance
Positive
(Negative)
Original
Budget
Final Budget Actual
Variance
Positive
(Negative)
Revenues:
Property taxes......................................................... -$ -$ -$ -$ -$ -$ -$ -$
Business taxes....................................................... - - - - - - - -
Sales and use tax................................................... - - - - - - - -
Hotel room tax......................................................... - - - - - - - -
Other local taxes..................................................... - - - - - - - -
Licenses, permits, and franchises......................... - - - - 220 220 260 40
Fines, forfeitures, and penalties.............................. - - - - - - 7 7
Interest and investment income.............................. - 87 271 184 300 671 671 -
Rents and concessions.......................................... 4,558 4,558 4,718 160 - - - -
Intergovernmental:
Federal.................................................................. - - - - 66,503 112,794 112,794 -
State...................................................................... - - - - 48,425 44,303 44,303 -
Other..................................................................... - - - - - - - -
Charges for services.............................................. 9,268 9,061 9,649 588 140 163 164 1
Other....................................................................... - - - - 2,000 199 199 -
Total revenues............................................... 13,826 13,706 14,638 932 117,588 158,350 158,398 48
Expenditures:
Current:
Public protection................................................... - - - - - - - -
Public works, transportation and commerce....... - - - - - 1,067 1,067 -
Human welfare and neighborhood development.. - - - - 188,146 224,366 224,146 220
Community health................................................. - - - - - - - -
Culture and recreation.......................................... 20,629 19,992 19,431 561 - - - -
General administration and finance...................... - - - - - 62 62 -
Distributions to other governments...................... - - - - - - - -
Debt service:
Principal retirement............................................... - - - - - - - -
Interest and other fiscal charges.......................... - - - - - - - -
Bond issuance costs............................................ - - - - - - - -
Total expenditures.......................................... 20,629 19,992 19,431 561 188,146 225,495 225,275 220
Excess (deficiency) of revenues
over (under) expenditures............................ (6,803) (6,286) (4,793) 1,493 (70,558) (67,145) (66,877) 268
Other financing sources (uses):
Transfers in............................................................. 5,453 5,453 5,453 - 70,558 70,558 70,558 -
Transfers out........................................................... (1,180) (1,180) (1,180) - - - - -
Issuance of commercial paper............................... - - - - - - - -
Issuance of bonds................................................... - - - - - - - -
Premium on issuance of bonds.............................. - - - - - - - -
Budget reserves and designations......................... - - - - - - - -
Total other financing sources (uses)............. 4,273 4,273 4,273 - 70,558 70,558 70,558 -
Net changes in fund balances....................... (2,530) (2,013) (520) 1,493 - 3,413 3,681 268
Budgetary fund balances, July 1,
as previously reported............................................. 2,530 10,571 10,571 - - 16,720 16,720 -
Cumulative effect of accounting change................... - - - - - - - -
Budgetary fund balances, July 1, as restated........... 2,530 10,571 10,571 - - 16,720 16,720 -
Budgetary fund balances, June 30............................ -$ 8,558$ 10,051$ 1,493$ -$ 20,133$ 20,401$ 268$
(Continued)

CITY AND COUNTY OF SAN FRANCISCO
Combining Schedule of Revenues, Expenditures, and Changes
in Fund Balances – Budget and Actual – Budget Basis
Nonmajor Governmental Funds – Special Revenue Funds (Continued)
Year Ended June 30, 2023
(In Thousands)
242
Low and Moderate Income Housing Asset Fund
Original
Budget
Final
Budget
Actual
Variance
Positive
(Negative)
Original
Budget
Final Budget Actual
Variance
Positive
(Negative)
Revenues:
Property taxes......................................................... -$ -$ -$ -$ 75,620$ 75,620$ 78,261$ 2,641$
Business taxes....................................................... - - - - - - - -
Sales and use tax................................................... - - - - - - - -
Hotel room tax......................................................... - - - - - - - -
Other local taxes..................................................... - - - - - - - -
Licenses, permits, and franchises......................... - - - - - - - -
Fines, forfeitures, and penalties.............................. - - - - - - - -
Interest and investment income.............................. - 6,886 6,886 - - 193 1,443 1,250
Rents and concessions.......................................... 5,000 6,681 6,681 - - - - -
Intergovernmental:
Federal.................................................................. - - - - - - - -
State...................................................................... - - - - 145 145 139 (6)
Other..................................................................... 1,124 1,124 1,124 - - - - -
Charges for services.............................................. - - - - - - - -
Other....................................................................... - 3,489 3,489 - - - - -
Total revenues............................................... 6,124 18,180 18,180 - 75,765 75,958 79,843 3,885
Expenditures:
Current:
Public protection................................................... - - - - - - - -
Public works, transportation and commerce....... - - - - - 1,875 1,875 -
Human welfare and neighborhood development.. 5,000 11,538 11,538 - - - - -
Community health................................................. - - - - - - - -
Culture and recreation.......................................... - - - - 71,092 66,986 61,954 5,032
General administration and finance...................... - - - - - - - -
Distributions to other governments...................... - - - - - - - -
Debt service:
Principal retirement............................................... 1,124 - - - - - - -
Interest and other fiscal charges.......................... - - - - - - - -
Bond issuance costs............................................ - - - - - - - -
Total expenditures.......................................... 6,124 11,538 11,538 - 71,092 68,861 63,829 5,032
Excess (deficiency) of revenues
over (under) expenditures............................ - 6,642 6,642 - 4,673 7,097 16,014 8,917
Other financing sources (uses):
Transfers in............................................................. - - - - 1,180 1,180 1,180 -
Transfers out........................................................... - - - - (13,334) (13,334) (13,334) -
Issuance of commercial paper............................... - - - - - - - -
Issuance of bonds................................................... - - - - - - - -
Premium on issuance of bonds.............................. - - - - - - - -
Budget reserves and designations......................... - - - - - - - -
Total other financing sources (uses)............. - - - - (12,154) (12,154) (12,154) -
Net changes in fund balances....................... - 6,642 6,642 - (7,481) (5,057) 3,860 8,917
Budgetary fund balances, July 1,
as previously reported............................................. - 64,975 64,975 - 7,481 72,212 72,212 -
Cumulative effect of accounting change................... - - - - - - - -
Budgetary fund balances, July 1, as restated........... - 64,975 64,975 - 7,481 72,212 72,212 -
Budgetary fund balances, June 30............................ -$ 71,617$ 71,617$ -$ -$ 67,155$ 76,072$ 8,917$
(Continued)
Open Space and Park Fund

CITY AND COUNTY OF SAN FRANCISCO
Combining Schedule of Revenues, Expenditures, and Changes
in Fund Balances – Budget and Actual – Budget Basis
Nonmajor Governmental Funds – Special Revenue Funds (Continued)
Year Ended June 30, 2023
(In Thousands)
243
Public Library Fund Public Protection Fund
Original
Budget
Final
Budget
Actual
Variance
Positive
(Negative)
Original
Budget
Final Budget Actual
Variance
Positive
(Negative)
Revenues:
Property taxes......................................................... -$ -$ -$ -$ 75,620$ 75,620$ 78,261$ 2,641$
Business taxes....................................................... 313,400 247,755 247,755 - - - - -
Sales and use tax................................................... - - - - - - - -
Hotel room tax......................................................... - - - - - - - -
Other local taxes..................................................... - - - - - - - -
Licenses, permits, and franchises......................... - - - - - - - -
Fines, forfeitures, and penalties.............................. - - - - - - - -
Interest and investment income.............................. - 11,951 11,951 - 222 275 1,258 983
Rents and concessions.......................................... - 1,300 1,300 - 4 4 - (4)
Intergovernmental:
Federal.................................................................. - - - - - - - -
State...................................................................... - - - - 205 208 202 (6)
Other..................................................................... - - - - - - - -
Charges for services.............................................. - - - - 175 178 147 (31)
Other....................................................................... - 217 217 - - 598 598 -
Total revenues............................................... 313,400 261,223 261,223 - 76,226 76,883 80,466 3,583
Expenditures:
Current:
Public protection................................................... - 911 911 - - - - -
Public works, transportation and commerce....... - 3,089 3,089 - - 3,942 3,942 -
Human welfare and neighborhood development.. 233,381 233,944 233,944 - - - - -
Community health................................................. 83,714 56,424 56,424 - - - - -
Culture and recreation.......................................... - - - - 185,502 162,299 160,568 1,731
General administration and finance...................... 2,225 1,404 1,404 - - 28 28 -
Distributions to other governments...................... - - - - - - - -
Debt service:
Principal retirement............................................... - - - - - - - -
Interest and other fiscal charges.......................... - - - - - - - -
Bond issuance costs............................................ - - - - - - - -
Total expenditures.......................................... 319,320 295,772 295,772 - 185,502 166,269 164,538 1,731
Excess (deficiency) of revenues
over (under) expenditures............................ (5,920) (34,549) (34,549) - (109,276) (89,386) (84,072) 5,314
Other financing sources (uses):
Transfers in............................................................. - - - - 98,980 102,120 102,120 -
Transfers out........................................................... - - - - - (2,306) (2,306) -
Issuance of commercial paper............................... - - - - - - - -
Issuance of bonds................................................... - - - - - - - -
Premium on issuance of bonds.............................. - - - - - - - -
Budget reserves and designations......................... - - - - - - - -
Total other financing sources (uses)............. - - - - 98,980 99,814 99,814 -
Net changes in fund balances....................... (5,920) (34,549) (34,549) - (10,296) 10,428 15,742 5,314
Budgetary fund balances, July 1,
as previously reported............................................. 5,920 564,520 564,520 - 10,296 130,977 130,977 -
Cumulative effect of accounting change................... - - - - - - - -
Budgetary fund balances, July 1, as restated........... 5,920 564,520 564,520 - 10,296 130,977 130,977 -
Budgetary fund balances, June 30............................ -$ 529,971$ 529,971$ -$ -$ 141,405$ 146,719$ 5,314$
(Continued)
Our City Our Home Fund

CITY AND COUNTY OF SAN FRANCISCO
Combining Schedule of Revenues, Expenditures, and Changes
in Fund Balances – Budget and Actual – Budget Basis
Nonmajor Governmental Funds – Special Revenue Funds (Continued)
Year Ended June 30, 2023
(In Thousands)
244
Public Protection Fund Public Works, Transportation and Commerce Fund Real Property Fund
Original
Budget
Final Budget Actual
Variance
Positive
(Negative)
Original
Budget
Final Budget Actual
Variance
Positive
(Negative)
Revenues:
Property taxes......................................................... -$ -$ -$ -$ -$ -$ -$ -$
Business taxes....................................................... - - - - - - - -
Sales and use tax................................................... - - - - - - - -
Hotel room tax......................................................... - - - - - - - -
Other local taxes..................................................... - - - - 15,950 16,981 16,981 -
Licenses, permits, and franchises......................... 995 481 481 - - - - -
Fines, forfeitures, and penalties.............................. 5,643 9,265 9,265 - - 102 102 -
Interest and investment income.............................. - 334 334 - - 781 781 -
Rents and concessions.......................................... - - - - - - - -
Intergovernmental:
Federal.................................................................. 48,475 50,148 50,148 - - - - -
State...................................................................... 38,666 25,713 25,713 - - 51 51 -
Other..................................................................... - 45 45 - 200 2,521 2,521 -
Charges for services.............................................. 3,404 18,032 18,032 - 30,628 42,230 41,942 (288)
Other....................................................................... 532 2,520 2,520 - - 186 189 3
Total revenues............................................... 97,715 106,538 106,538 - 46,778 62,852 62,567 (285)
Expenditures:
Current:
Public protection................................................... 88,553 92,952 92,952 - - - - -
Public works, transportation and commerce....... - 15 15 - 45,430 53,162 40,547 12,615
Human welfare and neighborhood development.. 5,060 6,636 6,636 - 16,577 17,075 15,245 1,830
Community health................................................. - - - - - - - -
Culture and recreation.......................................... - - - - - 97 97 -
General administration and finance...................... 4,679 2,760 2,760 - 454 239 239 -
Distributions to other governments...................... - - - - - - - -
Debt service:
Principal retirement............................................... - 250 250 - - - - -
Interest and other fiscal charges.......................... - 192 192 - - - - -
Bond issuance costs............................................ - - - - - - - -
Total expenditures.......................................... 98,292 102,805 102,805 - 62,461 70,573 56,128 14,445
Excess (deficiency) of revenues
over (under) expenditures............................ (577) 3,733 3,733 - (15,683) (7,721) 6,439 14,160
Other financing sources (uses):
Transfers in............................................................. - 569 569 - 22,311 23,021 23,021 -
Transfers out........................................................... (1,322) (1,593) (1,593) - (17,926) (19,054) (19,054) -
Issuance of commercial paper............................... - (1,473) (1,473) - - - - -
Issuance of bonds................................................... - - - - - - - -
Premium on issuance of bonds.............................. - - - - - - - -
Budget reserves and designations......................... - - - - (1,323) (2,682) - 2,682
Total other financing sources (uses)............. (1,322) (2,497) (2,497) - 3,062 1,285 3,967 2,682
Net changes in fund balances....................... (1,899) 1,236 1,236 - (12,621) (6,436) 10,406 16,842
Budgetary fund balances, July 1,
as previously reported............................................. 1,899 78,938 78,938 - 12,621 97,660 97,660 -
Cumulative effect of accounting change................... - - - - - - - -
Budgetary fund balances, July 1, as restated........... 1,899 78,938 78,938 - 12,621 97,660 97,660 -
Budgetary fund balances, June 30............................ -$ 80,174$ 80,174$ -$ -$ 91,224$ 108,066$ 16,842$
(Continued)

CITY AND COUNTY OF SAN FRANCISCO
Combining Schedule of Revenues, Expenditures, and Changes
in Fund Balances – Budget and Actual – Budget Basis
Nonmajor Governmental Funds – Special Revenue Funds (Continued)
Year Ended June 30, 2023
(In Thousands)
245
Real Property Fund San Francisco County Transportation Authority Fund Senior Citizens Program Fund
Original
Budget
Final Budget Actual
Variance
Positive
(Negative)
Original
Budget
Final
Budget
Actual
Variance
Positive
(Negative)
Revenues:
Property taxes......................................................... -$ -$ -$ -$ -$ -$ -$ -$
Business taxes....................................................... - - - - - - - -
Sales and use tax................................................... - - - - 101,701 111,212 111,474 262
Hotel room tax......................................................... - - - - - - - -
Other local taxes..................................................... - - - - - - - -
Licenses, permits, and franchises......................... - - - - 4,834 4,834 4,652 (182)
Fines, forfeitures, and penalties.............................. - - - - - - - -
Interest and investment income.............................. - - 5 5 375 7,778 2,196 (5,582)
Rents and concessions.......................................... 10,241 104,497 106,568 2,071 - - - -
Intergovernmental:
Federal.................................................................. - - - - 17,348 26,973 2,009 (24,964)
State...................................................................... - - - - - 6,827 551 (6,276)
Other..................................................................... 859 859 859 - 691 5,574 1,135 (4,439)
Charges for services.............................................. 844 844 574 (270) - - - -
Other....................................................................... 1,555 6,006 5,558 (448) - - - -
Total revenues............................................... 13,499 112,206 113,564 1,358 124,949 163,198 122,017 (41,181)
Expenditures:
Current:
Public protection................................................... - - - - - - - -
Public works, transportation and commerce....... - 667 667 - 179,356 163,066 123,793 39,273
Human welfare and neighborhood development.. - - - - - - - -
Community health................................................. - - - - - - - -
Culture and recreation.......................................... - 423 423 - - - - -
General administration and finance...................... - 81,313 75,001 6,312 - - - -
Distributions to other governments...................... - - - - - - - -
Debt service:
Principal retirement............................................... 16,360 218 - 218 14,125 14,125 15,025 (900)
Interest and other fiscal charges.......................... - 5 5 - 10,505 7,673 7,502 171
Bond issuance costs............................................ - - - - - - - -
Total expenditures.......................................... 16,360 82,626 76,096 6,530 203,986 184,864 146,320 38,544
Excess (deficiency) of revenues
over (under) expenditures............................ (2,861) 29,580 37,468 7,888 (79,037) (21,666) (24,303) (2,637)
Other financing sources (uses):
Transfers in............................................................. - - - - 7,816 7,546 8,372 826
Transfers out........................................................... (2,517) (27,084) (25,390) 1,694 - - - -
Issuance of commercial paper............................... - - - - - - - -
Issuance of bonds................................................... - - - - 75,000 20,000 - (20,000)
Premium on issuance of bonds.............................. - - - - - - - -
Budget reserves and designations......................... - - - - - - - -
Total other financing sources (uses)............. (2,517) (27,084) (25,390) 1,694 82,816 27,546 8,372 (19,174)
Net changes in fund balances....................... (5,378) 2,496 12,078 9,582 3,779 5,880 (15,931) (21,811)
Budgetary fund balances, July 1,
as previously reported............................................. 5,378 27,054 27,054 - (3,779) 60,975 60,975 -
Cumulative effect of accounting change................... - - - - - - - -
Budgetary fund balances, July 1, as restated........... 5,378 27,054 27,054 - (3,779) 60,975 60,975 -
Budgetary fund balances, June 30............................ -$ 29,550$ 39,132$ 9,582$ -$ 66,855$ 45,044$ (21,811)$
(Continued)

CITY AND COUNTY OF SAN FRANCISCO
Combining Schedule of Revenues, Expenditures, and Changes
in Fund Balances – Budget and Actual – Budget Basis
Nonmajor Governmental Funds – Special Revenue Funds (Continued)
Year Ended June 30, 2023
(In Thousands)
246
Senior Citizens Program Fund Tax Increment Financing Districts Fund War Memorial Fund
Original
Budget
Final
Budget
Actual
Variance
Positive
(Negative)
Original
Budget
Final
Budget
Actual
Variance
Positive
(Negative)
Revenues:
Property taxes......................................................... -$ -$ -$ -$ -$ 13,598$ 13,598$ -$
Business taxes....................................................... - - - - - - - -
Sales and use tax................................................... - - - - - - - -
Hotel room tax......................................................... - - - - - - - -
Other local taxes..................................................... - - - - - - - -
Licenses, permits, and franchises......................... - - - - - - - -
Fines, forfeitures, and penalties.............................. - - - - - - - -
Interest and investment income.............................. - - - - - 663 663 -
Rents and concessions.......................................... - - - - - - - -
Intergovernmental:
Federal.................................................................. 5,589 5,956 5,956 - - - - -
State...................................................................... 4,185 4,988 4,988 - - - - -
Other..................................................................... - - - - - - - -
Charges for services.............................................. - - - - - - - -
Other....................................................................... - - - - - - - -
Total revenues............................................... 9,774 10,944 10,944 - - 14,261 14,261 -
Expenditures:
Current:
Public protection................................................... - - - - - - - -
Public works, transportation and commerce....... - - - - - 62 62 -
Human welfare and neighborhood development.. 9,774 10,944 10,944 - - - - -
Community health................................................. - - - - - - - -
Culture and recreation.......................................... - - - - - - - -
General administration and finance...................... - - - - - 22,586 22,586 -
Distributions to other governments...................... - - - - - - - -
Debt service:
Principal retirement............................................... - - - - - - - -
Interest and other fiscal charges.......................... - - - - - 5,548 5,548 -
Bond issuance costs............................................ - - - - - 835 835 -
Total expenditures.......................................... 9,774 10,944 10,944 - - 29,031 29,031 -
Excess (deficiency) of revenues
over (under) expenditures............................ - - - - - (14,770) (14,770) -
Other financing sources (uses):
Transfers in............................................................. - - - - - - - -
Transfers out........................................................... - - - - - (4,711) (4,711) -
Issuance of commercial paper............................... - - - - - - - -
Issuance of bonds................................................... - - - - - 29,390 29,390 -
Premium on issuance of bonds.............................. - - - - - 516 516 -
Budget reserves and designations......................... - - - - - - - -
Total other financing sources (uses)............. - - - - - 25,195 25,195 -
Net changes in fund balances....................... - - - - - 10,425 10,425 -
Budgetary fund balances, July 1,
as previously reported............................................. - - - - - 3,485 3,485 -
Cumulative effect of accounting change................... - - - - - 11,358 11,358 -
Budgetary fund balances, July 1, as restated........... - - - - - 14,843 14,843 -
Budgetary fund balances, June 30............................ -$ -$ -$ -$ -$ 25,268$ 25,268$ -$
(Continued)

CITY AND COUNTY OF SAN FRANCISCO
Combining Schedule of Revenues, Expenditures, and Changes
in Fund Balances – Budget and Actual – Budget Basis
Nonmajor Governmental Funds – Special Revenue Funds (Continued)
Year Ended June 30, 2023
(In Thousands)
247
War Memorial Fund Total
Original
Budget
Final Budget Actual
Variance
Positive
(Negative)
Original
Budget
Final Budget Actual
Variance
Positive
(Negative)
Revenues:
Property taxes......................................................... -$ -$ -$ -$ 272,450$ 335,121$ 344,341$ 9,220$
Business taxes....................................................... - - - - 542,200 440,325 440,325 -
Sales and use tax................................................... - - - - 101,701 111,212 111,474 262
Hotel room tax......................................................... - - - - 23,170 26,063 26,063 -
Other local taxes..................................................... - - - - 18,450 17,678 17,678 -
Licenses, permits, and franchises......................... - - - - 14,815 14,376 14,203 (173)
Fines, forfeitures, and penalties.............................. - - - - 10,660 23,000 23,007 7
Interest and investment income.............................. - 75 186 111 3,509 72,695 71,949 (746)
Rents and concessions.......................................... 3,486 4,092 3,797 (295) 65,033 167,898 172,364 4,466
Intergovernmental:
Federal.................................................................. - - - - 243,131 350,397 325,441 (24,956)
State...................................................................... - - - - 265,965 259,728 252,677 (7,051)
Other..................................................................... - - - - 2,874 10,239 5,800 (4,439)
Charges for services.............................................. 586 683 642 (41) 122,503 148,209 144,732 (3,477)
Other....................................................................... - - - - 37,955 141,218 137,772 (3,446)
Total revenues............................................... 4,072 4,850 4,625 (225) 1,724,416 2,118,159 2,087,826 (30,333)
Expenditures:
Current:
Public protection................................................... - - - - 88,863 94,234 94,234 -
Public works, transportation and commerce....... - 31 31 - 390,826 384,288 320,806 63,482
Human welfare and neighborhood development.. - - - - 1,053,826 1,441,749 1,419,633 22,116
Community health................................................. - - - - 267,972 201,099 201,099 -
Culture and recreation.......................................... 19,572 21,507 21,199 308 388,562 358,843 339,871 18,972
General administration and finance...................... - - - - 40,950 143,980 137,668 6,312
Distributions to other governments...................... - - - - - 49,113 49,113 -
Debt service:
Principal retirement............................................... - - - - 60,153 18,005 18,549 (544)
Interest and other fiscal charges.......................... - - - - 11,554 16,114 15,943 171
Bond issuance costs............................................ - - - - - 1,584 1,584 -
Total expenditures.......................................... 19,572 21,538 21,230 308 2,302,706 2,709,009 2,598,500 110,509
Excess (deficiency) of revenues
over (under) expenditures............................ (15,500) (16,688) (16,605) 83 (578,290) (590,850) (510,674) 80,176
Other financing sources (uses):
Transfers in............................................................. 14,533 14,533 14,533 - 469,675 478,353 479,179 826
Transfers out........................................................... - - - - (76,628) (138,229) (136,428) 1,801
Issuance of commercial paper............................... - - - - - 3,100 3,100 -
Issuance of bonds................................................... - - - - 75,000 219,387 199,387 (20,000)
Premium on issuance of bonds.............................. - - - - - 516 516 -
Budget reserves and designations......................... - - - - (1,563) (2,912) - 2,912
Total other financing sources (uses)............. 14,533 14,533 14,533 - 466,484 560,215 545,754 (14,461)
Net changes in fund balances....................... (967) (2,155) (2,072) 83 (111,806) (30,635) 35,080 65,715
Budgetary fund balances, July 1,
as previously reported............................................. 967 11,099 11,099 - 111,806 3,266,642 3,266,642 -
Cumulative effect of accounting change................... - - - - - 11,358 11,358 -
Budgetary fund balances, July 1, as restated........... 967 11,099 11,099 - 111,806 3,278,000 3,278,000 -
Budgetary fund balances, June 30............................ -$ 8,944$ 9,027$ 83$ -$ 3,247,365$ 3,313,080$ 65,715$

CITY AND COUNTY OF SAN FRANCISCO
Schedule of Current Expenditures by Department
Budget and Actual – Budget Basis
Nonmajor Governmental Funds – Special Revenue Funds
Year Ended June 30, 2023
(In Thousands)
248
(Continued)
Original Budget Final Budget Actual
Variance
Positive
(Negative)
BUILDING INSPECTION FUND
Public Works, Transportation and Commerce
Building Inspection................................................................................ 92,642$ 86,664$ 82,559$ 4,105$
Total Building Inspection Fund......................................................... 92,642 86,664 82,559 4,105
CHILDREN AND FAMILIES FUND
Public Works, Transportation and Commerce
Public Works........................................................................................ - 170 170 -
Human Welfare and Neighborhood Development
Child Support Services......................................................................... 13,434 13,524 12,947 577
Children and Families Commission..................................................... - 262 262 -
Children, Youth and Their Families...................................................... 226,666 247,277 235,043 12,234
Early Childhood..................................................................................... 253,149 186,448 186,448 -
Human Services................................................................................... - 3,012 3,012 -
493,249 450,523 437,712 12,811
General Administration and Finance
Telecommunications and Information Services................................... - 127 127 -
Distributions to Other Governments
Distributions to Other Governments..................................................... - 49,113 49,113 -
Total Children and Families Fund.................................................... 493,249 499,933 487,122 12,811
COMMUNITY / NEIGHBORHOOD DEVELOPMENT FUND
Public Works, Transportation and Commerce
Economic and Workforce Development.............................................. 9,501 7,192 7,192 -
Municipal Transportation Agency.......................................................... - 178 178 -
Public Utilities Commission.................................................................. - 223 223 -
Public Works........................................................................................ - 10,207 10,207 -
9,501 17,800 17,800 -
Human Welfare and Neighborhood Development
Children, Youth and Their Families...................................................... - 100 100 -
Early Childhood..................................................................................... 5,000 1,638 1,638 -
Homelessness and Supportive Housing.............................................. - 15,997 15,997 -
Human Services................................................................................... - 17,213 17,213 -
Mayor's Office....................................................................................... 66,296 320,033 320,033 -
Port ...................................................................................................... - 103,600 103,600 -
Rent Arbitration Board.......................................................................... 15,294 15,818 10,938 4,880
86,590 474,399 469,519 4,880
Community Health
Public Health......................................................................................... - 153 153 -
Culture and Recreation
Arts Commission.................................................................................. - 154 154 -
Recreation and Park Commission....................................................... 1,336 519 519 -
1,336 673 673 -
General Administration and Finance
General Services Agency - Administrative Services............................ 2,700 2,249 2,249 -
Planning................................................................................................ 7,985 4,113 4,113 -
10,685 6,362 6,362 -
Total Community / Neighborhood Development Fund..................... 108,112 499,387 494,507 4,880

CITY AND COUNTY OF SAN FRANCISCO
Schedule of Current Expenditures by Department
Budget and Actual – Budget Basis
Nonmajor Governmental Funds – Special Revenue Funds (Continued)
Year Ended June 30, 2023
(In Thousands)
249
(Continued)
Original Budget Final Budget Actual
Variance
Positive
(Negative)
COMMUNITY HEALTH SERVICES FUND
Public Protection
Adult Probation...................................................................................... - 45 45 -
Public Works, Transportation and Commerce
Public Works........................................................................................ - 2,093 2,093 -
Human Welfare and Neighborhood Development
Homelessness and Supportive Housing.............................................. 609 489 489 -
Community Health
Public Health......................................................................................... 184,258 144,390 144,390 -
Total Community Health Services Fund.......................................... 184,867 147,017 147,017 -
CONVENTION FACILITIES FUND
Culture and Recreation
General Services Agency - Administrative Services............................ 69,308 66,660 55,555 11,105
Total Convention Facilities Fund...................................................... 69,308 66,660 55,555 11,105
CULTURE AND RECREATION FUND
Public Works, Transportation and Commerce
Economic and Workforce Development.............................................. 825 263 263 -
Public Works........................................................................................ - 112 112 -
825 375 375 -
Human Welfare and Neighborhood Development
Mayor's Office....................................................................................... 2,940 3,030 3,030 -
Culture and Recreation
Arts Commission.................................................................................. 13,108 11,173 11,173 -
Asian Art Museum................................................................................. 490 351 351 -
Fine Arts Museums............................................................................... 1,092 1,559 1,559 -
Recreation and Park Commission....................................................... 5,683 5,181 4,946 235
20,373 18,264 18,029 235
General Administration and Finance
General Services Agency - Administrative Services............................ 15,977 16,812 16,812 -
Total Culture and Recreation Fund.................................................. 40,115 38,481 38,246 235
ENVIRONMENTAL PROTECTION FUND
Human Welfare and Neighborhood Development
Environment.......................................................................................... 12,245 8,713 6,338 2,375
Total Environmental Protection Fund............................................... 12,245 8,713 6,338 2,375

CITY AND COUNTY OF SAN FRANCISCO
Schedule of Current Expenditures by Department
Budget and Actual – Budget Basis
Nonmajor Governmental Funds – Special Revenue Funds (Continued)
Year Ended June 30, 2023
(In Thousands)
250
(Continued)
Original Budget Final Budget Actual
Variance
Positive
(Negative)
GASOLINE TAX FUND
Public Works, Transportation and Commerce
Municipal Transportation Agency.......................................................... - 1,242 1,242 -
Public Utilities Commission.................................................................. - 922 922 -
Public Works........................................................................................ 63,072 46,778 39,289 7,489
63,072 48,942 41,453 7,489
General Administration and Finance
Telecommunications and Information Services................................... - 4 4 -
Total Gasoline Tax Fund.................................................................. 63,072 48,946 41,457 7,489
GENERAL SERVICES FUND
Public Protection
District Attorney.................................................................................... 310 195 195 -
Culture and Recreation
Fine Arts Museums............................................................................... - 1,025 1,025 -
General Administration and Finance
Assessor/Recorder.............................................................................. 2,503 1,973 1,973 -
Board of Supervisors............................................................................ 18 30 30 -
General Services Agency - Administrative Services............................ 564 7,063 7,063 -
Human Resources…………………………………………………….... 138 216 216 -
Mayor's Office....................................................................................... 150 402 402 -
Telecommunications and Information Services................................... 1,918 1,336 1,336 -
Treasurer/Tax Collector........................................................................ 1,639 1,232 1,232 -
6,930 12,252 12,252 -
Total General Services Fund........................................................... 7,240 13,472 13,472 -

CITY AND COUNTY OF SAN FRANCISCO
Schedule of Current Expenditures by Department
Budget and Actual – Budget Basis
Nonmajor Governmental Funds – Special Revenue Funds (Continued)
Year Ended June 30, 2023
(In Thousands)
251
(Continued)
Original Budget Final Budget Actual
Variance
Positive
(Negative)
GIFT AND OTHER EXPENDABLE TRUSTS FUND
Public Protection
Fire Department.................................................................................... - 16 16 -
Police Department................................................................................ - 115 115 -
- 131 131 -
Public Works, Transportation and Commerce
Public Works........................................................................................ - 1,268 1,268 -
Human Welfare and Neighborhood Development
Environment.......................................................................................... 60 4 4 -
Homelessness and Supportive Housing.............................................. - 60 60 -
Human Services................................................................................... 95 6 6 -
Mayor's Office....................................................................................... - 15 15 -
Status of Women.................................................................................. 100 7 7 -
255 92 92 -
Community Health
Public Health......................................................................................... - 132 132 -
Culture and Recreation
Arts Commission.................................................................................. - 308 308 -
Fine Arts Museums............................................................................... - 163 163 -
Library................................................................................................... 5 - - -
Recreation and Park Commission....................................................... 745 446 446 -
750 917 917 -
General Administration and Finance
General Services Agency - Administrative Services............................ - 19 19 -
Telecommunications and Information Services................................... - 12 12 -
- 31 31 -
Total Gift and Other Expendable Trusts Fund................................. 1,005 2,571 2,571 -
GOLF FUND
Culture and Recreation
Recreation and Park Commission....................................................... 20,629 19,992 19,431 561
Total Golf Fund................................................................................. 20,629 19,992 19,431 561

CITY AND COUNTY OF SAN FRANCISCO
Schedule of Current Expenditures by Department
Budget and Actual – Budget Basis
Nonmajor Governmental Funds – Special Revenue Funds (Continued)
Year Ended June 30, 2023
(In Thousands)
252
(Continued)
Original Budget Final Budget Actual
Variance
Positive
(Negative)
HUMAN WELFARE FUND
Public Works, Transportation and Commerce
Public Works........................................................................................ - 1,067 1,067 -
Human Welfare and Neighborhood Development
Early Childhood..................................................................................... 530 530 530 -
Homelessness and Supportive Housing.............................................. 113,206 151,836 151,836 -
Human Services................................................................................... 74,190 71,780 71,780 -
Status of Women.................................................................................. 220 220 - 220
188,146 224,366 224,146 220
General Administration and Finance
Telecommunications and Information Services - 62 62 -
Total Human Welfare Fund.............................................................. 188,146 225,495 225,275 220
LOW AND MODERATE INCOME HOUSING ASSET FUND
Human Welfare and Neighborhood Development
Mayor's Office....................................................................................... 5,000 11,538 11,538 -
Total Low and Moderate Income Housing Asset Fund.................... 5,000 11,538 11,538 -
OPEN SPACE AND PARK FUND
Public Works, Transportation and Commerce
Public Works........................................................................................ - 1,875 1,875 -
- 1,875 1,875 -
Culture and Recreation
Arts Commission.................................................................................. - 12 12 -
Recreation and Park Commission....................................................... 71,092 66,974 61,942 5,032
71,092 66,986 61,954 5,032
Total Open Space and Park Fund................................................... 71,092 68,861 63,829 5,032
OUR CITY OUR HOME FUND
Public Protection
Adult Probation...................................................................................... - 911 911 -
Public Works, Transportation and Commerce
Public Works........................................................................................ - 3,089 3,089 -
Human Welfare and Neighborhood Development
Homelessness and Supportive Housing.............................................. 233,381 227,433 227,433 -
Human Services................................................................................... - 324 324 -
Mayor's Office....................................................................................... - 6,187 6,187 -
233,381 233,944 233,944 -
Community Health
Public Health......................................................................................... 83,714 56,424 56,424 -
General Administration and Finance
Controller.............................................................................................. - 500 500 -
Treasurer/Tax Collector........................................................................ 2,225 904 904 -
2,225 1,404 1,404 -
Total Our City Our Home Fund........................................................ 319,320 295,772 295,772 -

CITY AND COUNTY OF SAN FRANCISCO
Schedule of Current Expenditures by Department
Budget and Actual – Budget Basis
Nonmajor Governmental Funds – Special Revenue Funds (Continued)
Year Ended June 30, 2023
(In Thousands)
253
(Continued)
Original Budget Final Budget Actual
Variance
Positive
(Negative)
PUBLIC LIBRARY FUND
Public Works, Transportation and Commerce
Public Works........................................................................................ - 3,942 3,942 -
- 3,942 3,942 -
Culture and Recreation
Arts Commission.................................................................................. - 11 11 -
Library................................................................................................... 185,502 162,288 160,557 1,731
185,502 162,299 160,568 1,731
General Administration and Finance
Telecommunications and Information Services................................... - 28 28 -
Total Public Library Fund................................................................. 185,502 166,269 164,538 1,731
PUBLIC PROTECTION FUND
Public Protection
Adult Probation...................................................................................... 3,622 2,255 2,255 -
District Attorney.................................................................................... 8,008 9,674 9,674 -
Emergency Management..................................................................... 42,501 35,434 35,434 -
Fire Department.................................................................................... - 5,524 5,524 -
Juvenile Probation................................................................................. 18,176 10,015 10,015 -
Police Department................................................................................ 12,139 27,121 27,121 -
Public Defender.................................................................................... 1,785 1,215 1,215 -
Sheriff.................................................................................................... 2,322 1,714 1,714 -
88,553 92,952 92,952 -
Public Works, Transportation and Commerce
Public Works........................................................................................ - 15 15 -
Human Welfare and Neighborhood Development
Children, Youth and Their Families...................................................... 5,010 3,355 3,355 -
Status of Women.................................................................................. 50 3,281 3,281 -
5,060 6,636 6,636 -
General Administration and Finance
City Attorney.......................................................................................... 4,679 2,702 2,702 -
General Services Agency - Administrative Services............................ - 58 58 -
4,679 2,760 2,760 -
Total Public Protection Fund............................................................ 98,292 102,363 102,363 -
PUBLIC WORKS, TRANSPORTATION AND COMMERCE FUND
Public Works, Transportation and Commerce
Municipal Transportation Agency.......................................................... - 29 29 -
Public Works........................................................................................ 45,430 53,105 40,490 12,615
Public Utilities Commission.................................................................. - 28 28 -
45,430 53,162 40,547 12,615
Human Welfare and Neighborhood Development
Environment.......................................................................................... 16,577 17,075 15,245 1,830
Culture and Recreation
Arts Commission.................................................................................. - 57 57 -
Recreation and Park Commission....................................................... - 40 40 -
- 97 97 -
General Administration and Finance
Controller.............................................................................................. 5 5 5 -
Planning................................................................................................ 200 - - -
Treasurer/Tax Collector........................................................................ 249 234 234 -
454 239 239 -
Total Public Works, Transportation and Commerce Fund.............. 62,461 70,573 56,128 14,445

CITY AND COUNTY OF SAN FRANCISCO
Schedule of Current Expenditures by Department
Budget and Actual – Budget Basis
Nonmajor Governmental Funds – Special Revenue Funds (Continued)
Year Ended June 30, 2023
(In Thousands)
254
Original Budget Final Budget Actual
Variance
Positive
(Negative)
REAL PROPERTY FUND
Public Works, Transportation and Commerce
Public Works........................................................................................ - 667 667 -
Culture and Recreation
Recreation and Park Commission....................................................... - 423 423 -
General Administration and Finance
General Services Agency - Administrative Services............................ - 81,313 75,001 6,312
Total Real Property Fund................................................................. - 82,403 76,091 6,312
SAN FRANCISCO COUNTY TRANSPORTATION
AUTHORITY FUND
Public Works, Transportation and Commerce
Board of Supervisors............................................................................ 179,356 163,066 123,793 39,273
Total SF County Transportation Authority Fund............................... 179,356 163,066 123,793 39,273
SENIOR CITIZENS PROGRAM FUND
Human Welfare and Neighborhood Development
Human Services................................................................................... 9,774 10,944 10,944 -
Total Senior Citizens Program Fund............................................... 9,774 10,944 10,944 -
TAX INCREMENT FINANCING DISTRICTS FUND
Public Works, Transportation and Commerce
Port....................................................................................................... - 62 62 -
General Administration and Finance
General Services Agency - Administrative Services............................ - 22,586 22,586 -
Total Tax Increment Financing Districts Fund................................. - 22,648 22,648 -
WAR MEMORIAL FUND
Public Works, Transportation and Commerce
Public Works........................................................................................ - 31 31 -
Culture and Recreation
War Memorial....................................................................................... 19,572 21,507 21,199 308
Total War Memorial Fund................................................................. 19,572 21,538 21,230 308
Total Special Revenue Funds With Legally Adopted Budgets ....... 2,230,999$ 2,673,306$ 2,562,424$ 110,882$

CITY AND COUNTY OF SAN FRANCISCO
Combining Balance Sheet
Nonmajor Governmental Funds – Debt Service Funds
June 30, 2023
(In Thousands)
255
General
Obligation
Bond Fund
Certificates
of
Participation
Funds
Other Bond
Funds
Total
Assets:
Deposits and investments with City Treasury............. 188,052$ -$ -$ 188,052$
Deposits and investments outside City Treasury........ - 73,823 13 73,836
Receivables:
Property taxes and penalties..................................... 4,877 - - 4,877
Interest and other....................................................... 2,241 302 - 2,543
Total assets...................................................... 195,170$ 74,125$ 13$ 269,308$
Liabilities:
Unearned revenues and other liabilities..................... 30,079$ -$ -$ 30,079$
Total liabilities.................................................... 30,079 - - 30,079
Deferred inflows of resources...................................... 4,250 - - 4,250
Fund balances:
Restricted................................................................... 160,841 74,125 13 234,979
Total fund balances........................................... 160,841 74,125 13 234,979
Total liabilities, deferred inflows of resources
and fund balances.......................................... 195,170$ 74,125$ 13$ 269,308$

CITY AND COUNTY OF SAN FRANCISCO
Combining Statement of Revenues, Expenditures,
and Changes in Fund Balances
Nonmajor Governmental Funds – Debt Service Funds
Year Ended June 30, 2023
(In Thousands)
256
General
Obligation
Bond Fund
Certificates of
Participation
Funds
Other Bond
Funds
Total
Revenues:
Property taxes................................................................ 353,645$ -$ -$ 353,645$
Fines, forfeitures, and penalties..................................... 18,240 - - 18,240
Interest and investment income..................................... 6,802 2,798 5 9,605
Intergovernmental
State............................................................................. 625 - - 625
Other............................................................................... 9,637 - - 9,637
Total revenues....................................................... 388,949 2,798 5 391,752
Expenditures:
Debt service:
Principal retirement...................................................... 276,320 38,920 3,470 318,710
Interest and other fiscal charges.................................. 109,461 46,595 258 156,314
Bond issuance costs................................................... 1 - - 1
Total expenditures................................................. 385,782 85,515 3,728 475,025
Excess (deficiency) of revenues
over (under) expenditures................................... 3,167 (82,717) (3,723) (83,273)
Other financing sources:
Transfers in.................................................................... 5,528 84,993 3,729 94,250
Total other financing sources................................ 5,528 84,993 3,729 94,250
Net changes in fund balances............................... 8,695 2,276 6 10,977
Fund balances at beginning of year.................................. 152,146 71,849 7 224,002
Fund balances at end of year........................................... 160,841$ 74,125$ 13$ 234,979$

CITY AND COUNTY OF SAN FRANCISCO
Schedule of Revenues, Expenditures, and Changes
in Fund Balance – Budget and Actual – Budget Basis
Nonmajor Governmental Funds – Debt Service Fund
Year Ended June 30, 2023
(In Thousands)
257
General Obligation Bond Fund
Original
Budget
Final Budget Actual
Variance
Positive
(Negative)
Revenues:
Property taxes........................................................ 358,587$ 358,587$ 353,645$ (4,942)$
Fines, forfeitures, and penalties............................. 18,408 18,408 18,240 (168)
Interest and investment income............................. - 1,451 7,640 6,189
Intergovernmental
State..................................................................... 700 700 625 (75)
Other...................................................................... 6,183 11,660 9,637 (2,023)
Total revenues.............................................. 383,878 390,806 389,787 (1,019)
Expenditures:
Debt service:
Principal retirement.............................................. 258,545 276,320 276,320 -
Interest and other fiscal charges......................... 125,333 113,084 109,461 3,623
Bond issuance costs........................................... - 1 1 -
Total expenditures......................................... 383,878 389,405 385,782 3,623
Excess (deficiency) of revenues
over (under) expenditures........................... - 1,401 4,005 2,604
Other financing sources:
Transfers in............................................................ - 5,528 5,528 -
Total other financing sources....................... - 5,528 5,528 -
Net changes in fund balance........................ - 6,929 9,533 2,604
Budgetary fund balance, July 1................................ - 165,445 165,445 -
Budgetary fund balance, June 30............................. -$ 172,374$ 174,978$ 2,604$

CITY AND COUNTY OF SAN FRANCISCO
Combining Balance Sheet
Nonmajor Governmental Funds – Capital Projects Funds
June 30, 2023
(In Thousands)
258
City Facilities
Improvement
Fund
Recreation
and Park
Projects
Fund
Street
Improvement
Fund
Total
Assets:
Deposits and investments with City Treasury.............. 422,435$ 7,598$ -$ 430,033$
Deposits and investments outside City Treasury......... 91,485 - 16 91,501
Receivables:
Federal and state grants and subventions................. - 20,445 6,804 27,249
Charges for services.................................................. - - 4 4
Interest and other........................................................ 2,680 105 9 2,794
Due from other funds.................................................... - - 14,596 14,596
Total assets......................................................... 516,600$ 28,148$ 21,429$ 566,177$
Liabilities:
Accounts payable.......................................................... 15,509$ 4,508$ 3,163$ 23,180$
Accrued payroll............................................................. 847 35 188 1,070
Unearned grant and subvention revenues.................... - 1,854 - 1,854
Due to other funds........................................................ 3,542 - 4,645 8,187
Unearned revenues and other liabilities........................ 66 - 11,244 11,310
Bonds, loans, leases, and other payables.................... 18,034 - - 18,034
Total liabilities....................................................... 37,998 6,397 19,240 63,635
Deferred inflows of resources…………………………………………….
- 12,989 2,607 15,596
Fund balances:
Restricted...................................................................... 478,602 8,762 - 487,364
Unassigned................................................................... - - (418) (418)
Total fund balances.............................................. 478,602 8,762 (418) 486,946
Total liabilities, deferred inflows of resources
and fund balances............................................. 516,600$ 28,148$ 21,429$ 566,177$

CITY AND COUNTY OF SAN FRANCISCO
Combining Statement of Revenues, Expenditures,
and Changes in Fund Balances
Nonmajor Governmental Funds – Capital Projects Funds
Year Ended June 30, 2023
(In Thousands)
259
City Facilities
Improvement
Fund
Recreation
and Park
Projects
Fund
Street
Improvement
Fund
Total
Revenues:
Interest and investment income......................................... 10,016$ 769$ 210$ 10,995$
Rents and concessions...................................................... - - 219 219
Intergovernmental:
Federal.............................................................................. - 1,343 2,937 4,280
State................................................................................. - 13,534 1,716 15,250
Other................................................................................. - 500 240 740
Other................................................................................... 25,171 5,060 - 30,231
Total revenues........................................................... 35,187 21,206 5,322 61,715
Expenditures:
Debt service:
Interest and other fiscal charges...................................... 1,513 2 5 1,520
Bond issuance costs........................................................ 481 - - 481
Capital outlay...................................................................... 100,183 29,806 18,895 148,884
Total expenditures..................................................... 102,177 29,808 18,900 150,885
Deficiency of revenues
under expenditures.................................................. (66,990) (8,602) (13,578) (89,170)
Other financing sources (uses):
Transfers in......................................................................... 2,591 586 6,058 9,235
Transfers out...................................................................... (43,382) - (77) (43,459)
Issuance of bonds:
Face value of bonds issued............................................. 67,805 - - 67,805
Premium on issuance of bonds....................................... 2,950 - - 2,950
Total other financing sources (uses)......................... 29,964 586 5,981 36,531
Net changes in fund balances................................... (37,026) (8,016) (7,597) (52,639)
Fund balances at beginning of year...................................... 515,628 16,778 7,179 539,585
Fund balances at end of year............................................... 478,602$ 8,762$ (418)$ 486,946$
CITY AND COUNTY OF SAN FRANCISCO
INTERNAL SERVICE FUNDS
260
Internal Service Funds are used to account for the financing of goods and services provided by one
department or agency to other departments or agencies on a cost reimbursement basis.
Central Shops Fund – Accounts for Central Shops equipment (primarily vehicle) maintenance service
charges and the related billings to various departments.
Finance Corporation – Accounts for the lease financing services provided by the Finance Corporation to
City departments. The City established the Finance Corporation Internal Service fund because its sole
purpose is to provide lease financing to the City.
Reproduction Fund – Accounts for printing, design and mail services required by various City
departments and agencies.
Telecommunications and Information Fund – Accounts for centralized telecommunications activities in the
City’s Wide Area Network, radio communication and telephone systems. In addition, it accounts for
application support provided to many department-specific and citywide systems, management of the
City’s Web site, operations of the City’s mainframe computers and technology training provided to the
City, the related billings to various departments for specific services performed and operating support
from the General Fund.

CITY AND COUNTY OF SAN FRANCISCO
Combining Statement of Net Position
Internal Service Funds
June 30, 2023
(In Thousands)
261
Central Shops
Fund
Finance
Corporation
Reproduction
Fund
Telecom-
munications &
Information
Fund
Total
Assets:
Current assets:
Deposits and investments with City Treasury................... 4,583$ -$ 2,143$ 58,745$ 65,471$
Receivables:
Charges for services....................................................... 81 - 26 112 219
Interest and other............................................................. 20 27 - 369 416
Leases............................................................................. - 14,739 - 381 15,120
Restricted assets:
Deposits and investments outside City Treasury............ - 6,449 - - 6,449
Total current assets.................................................... 4,684 21,215 2,169 59,607 87,675
Noncurrent assets:
Receivables: Leases.......................................................... - 68,554 - 6,793 75,347
Capital assets:
Land and other assets not being depreciated/amortized 74 - - 239 313
Facilities and equipment,
net of depreciation/amortization.................................... 256 - 824 31,690 32,770
Total capital assets........................................................ 330 - 824 31,929 33,083
Total noncurrent assets.............................................. 330 68,554 824 38,722 108,430
Total assets................................................................. 5,014 89,769 2,993 98,329 196,105
Deferred outflows of resources:
Unamortized loss on refunding of debt.............................. - 602 - - 602
Pensions............................................................................ 4,791 - - 13,760 18,551
OPEB................................................................................. 2,849 - - 6,203 9,052
Total deferred outflows of resources............................. 7,640 602 - 19,963 28,205
Liabilities:
Current liabilities:
Accounts payable............................................................... 1,381 43 411 8,759 10,594
Accrued payroll................................................................... 848 - 149 2,684 3,681
Accrued vacation and sick leave pay................................. 471 - - 2,181 2,652
Accrued workers' compensation....................................... - - - 256 256
Bonds, loans, leases, and other payables......................... - 14,455 136 10,103 24,694
Accrued interest payable.................................................... - 691 1 214 906
Unearned revenues and other liabilities............................. - 2,540 7 34 2,581
Total current liabilities.................................................. 2,700 17,729 704 24,231 45,364
Noncurrent liabilities:
Accrued vacation and sick leave pay................................. 461 - - 2,492 2,953
Accrued workers' compensation....................................... - - - 1,084 1,084
Bonds, loans, leases, and other payables......................... - 72,440 158 15,575 88,173
Net pension liability............................................................. 6,784 - - 20,358 27,142
Net other postemployment benefits (OPEB) liability.......... 17,561 - - 26,589 44,150
Total noncurrent liabilities............................................ 24,806 72,440 158 66,098 163,502
Total liabilities.............................................................. 27,506 90,169 862 90,329 208,866
Deferred inflows of resources:
Unamortized gain on refunding of debt.............................. - 202 - - 202
Pensions............................................................................ 1,374 - - 4,288 5,662
OPEB................................................................................. 3,780 - - 4,427 8,207
Leases................................................................................ - - - 7,101 7,101
Total deferred inflows of resources............................... 5,154 202 - 15,816 21,172
Net position:
Net investment in capital assets.......................................... 330 - 529 6,037 6,896
Unrestricted (deficit)............................................................. (20,336) - 1,602 6,110 (12,624)
Total net position......................................................... (20,006)$ -$ 2,131$ 12,147$ (5,728)$

CITY AND COUNTY OF SAN FRANCISCO
Combining Statement of Revenues, Expenses,
and Changes in Fund Net Position
Internal Service Funds
Year Ended June 30, 2023
(In Thousands)
262
Central Shops
Fund
Finance
Corporation
Reproduction
Fund
Telecom-
munications &
Information
Fund
Total
Operating revenues:
Charges for services.................................................... 39,209$ -$ 10,497$ 136,376$ 186,082$
Rents and concessions............................................... - - - 492 492
Total operating revenues........................................... 39,209 - 10,497 136,868 186,574
Operating expenses:
Personal services........................................................ 16,510 - 2,797 40,613 59,920
Contractual services.................................................... 5,602 - 6,397 50,004 62,003
Materials and supplies.................................................. 14,249 - 350 3,548 18,147
Depreciation and amortization..................................... 50 - 264 14,448 14,762
General and administrative.......................................... 109 - - 333 442
Services provided by other departments..................... 1,891 - 687 13,759 16,337
Other............................................................................ - - - 831 831
Total operating expenses........................................... 38,411 - 10,495 123,536 172,442
Operating income...................................................... 798 - 2 13,332 14,132
Nonoperating revenues (expenses):
Operating grants: State / other..................................... 53 - - 172 225
Interest and investment income................................... - 2,057 - 264 2,321
Interest expense........................................................... (45) (2,687) (19) (395) (3,146)
Other, net..................................................................... - 630 2 50 682
Total nonoperating revenues (expenses).................. 8 - (17) 91 82
Income (loss) before transfers.................................. 806 - (15) 13,423 14,214
Transfers in.................................................................. 45 - 17 300 362
Transfers out................................................................ - - - (141) (141)
Change in net position............................................... 851 - 2 13,582 14,435
Net position (deficit) at beginning of year....................... (20,857) - 2,129 (1,435) (20,163)
Net position (deficit) at end of year................................. (20,006)$ -$ 2,131$ 12,147$ (5,728)$

CITY AND COUNTY OF SAN FRANCISCO
Combining Statement of Cash Flows
Internal Service Funds
Year Ended June 30, 2023
(In Thousands)
263
Central Shops
Fund
Finance
Corporation
Reproduction
Fund
Telecom-
munications &
Information
Fund
Total
Cash flows from operating activities:
Cash received from customers................................................................... 39,254$ 16,274$ 10,478$ 137,485$ 203,491$
Cash paid for employees' services.............................................................. (16,789) - (2,792) (45,874) (65,455)
Cash paid to suppliers for goods and services........................................... (21,941) (340) (7,268) (64,732) (94,281)
Net cash provided by operating activities................................................ 524 15,934 418 26,879 43,755
Cash flows from noncapital financing activities:
Operating grants.......................................................................................... 53 - - 172 225
Transfers in.................................................................................................. 45 - 17 300 362
Transfers out................................................................................................ - - - (141) (141)
Net cash provided by noncapital financing activities............................... 98 - 17 331 446
Cash flows from capital and related financing activities:
Acquisition of capital assets......................................................................... - - - (1,263) (1,263)
Retirement of lease obligation...................................................................... - (13,255) (136) (7,689) (21,080)
Interest paid on debt..................................................................................... - (2,729) (2) (226) (2,957)
Net cash used in capital and related financing activities......................... - (15,984) (138) (9,178) (25,300)
Cash flows from investing activities:
Interest and investment income................................................................... - 92 - 128 220
Other investing activities.............................................................................. (45) - (17) 141 79
Net cash provided by (used in) investing activities.................................. (45) 92 (17) 269 299
Change in cash and cash equivalents........................................................... 577 42 280 18,301 19,200
Cash and cash equivalents at beginning of year........................................... 4,006 6,407 1,863 40,444 52,720
Cash and cash equivalents at end of year..................................................... 4,583$ 6,449$ 2,143$ 58,745$ 71,920$
Reconciliation of operating income to
net cash provided by operating activities:
Operating income......................................................................................... 798$ -$ 2$ 13,332$ 14,132$
Adjustments for non-cash and other activities:
Depreciation and amortization................................................................... 50 - 264 14,448 14,762
Other.......................................................................................................... - - 2 50 52
Changes in assets and deferred outflows of resources/liabilities and
deferred inflows of resources:
Receivables, net...................................................................................... 45 13,255 (25) 624 13,899
Accounts payable.................................................................................... (60) - 167 3,744 3,851
Accrued payroll........................................................................................ 107 - 4 396 507
Accrued vacation and sick leave pay...................................................... (72) - - 344 272
Accrued workers' compensation............................................................. - - - (85) (85)
Due to other funds................................................................................... (31) - - - (31)
Unearned revenue and other liabilities..................................................... - 2,679 4 - 2,683
Related to leases..................................................................................... - - - (58) (58)
Net pension liability/asset and pension related deferred outflows and
inflows of resources.............................................................................. (1,623) - - (4,182) (5,805)
Net OPEB liability and OPEB related deferred outflows and
inflows of resources.............................................................................. 1,310 - - (1,734) (424)
Total adjustments...................................................................................... (274) 15,934 416 13,547 29,623
Net cash provided by operating activities....................................................... 524$ 15,934$ 418$ 26,879$ 43,755$
Reconciliation of cash and cash equivalents
to the combining statement of net position:
Deposits and investments with City Treasury:
Unrestricted................................................................................................ 4,583$ -$ 2,143$ 58,745$ 65,471$
Deposits and investments outside City Treasury:
Restricted................................................................................................... - 6,449 - - 6,449
Total deposits and investments............................................................... 4,583 6,449 2,143 58,745 71,920
Cash and cash equivalents at end of year
on statement of cash flows.......................................................................... 4,583$ 6,449$ 2,143$ 58,745$ 71,920$
Non-cash capital and related financing activities:
Acquisition of capital assets on accounts payable
and via lease.............................................................................................. 92$ -$ -$ 3,278$ 3,370$
CITY AND COUNTY OF SAN FRANCISCO
FIDUCIARY FUNDS
264
Pension and Other Employee Benefit Trust Funds are used to record assets from employee and employer
contributions and investment earnings which are held for employee benefits.
Employees’ Retirement System – Accounts for the contributions from employees, City contributions and
the earnings and profits from investments of monies. Disbursements are made for retirements,
withdrawal, disability, and death benefits of the employees as well as administrative expenses.
Health Service System – Accounts for the contributions from active and retired employees, and surviving
spouses, City contributions and the earnings and profits from investment of monies. Disbursements
are made for medical expenses and to various health plans of the beneficiaries.
Retiree Health Care Trust - Accounts for the contributions from employees, City contributions and the
earnings and profits from investment of monies. Disbursements are to be made for benefits, expenses
and other charges properly allocable to the trust fund.
Custodial Funds are used to report fiduciary activities that are not reported in Pension and Other Employee
Benefit Trust Funds, Private-Purpose Trust Funds, or Investment Trust Funds.
Assistance Program Fund – Accounts for collections and advances received as an agent under various
human welfare and community health programs. Monies are disbursed in accordance with legal
requirements and program regulations.
Community Facilities Districts Fund – Accounts for the activities of various Community Facilities
Districts and Special Tax Districts which have been established for the purpose of financing
facilities and services.
Deposits Fund – Accounts for all deposits under the control of the City departments. Dispositions of the
deposits are governed by the terms of the statutes and ordinances establishing the deposit
requirement.
Medical Reimbursement Accounts Fund – Accounts for balances in Medical Reimbursement Accounts held
by the City pursuant to the Health Care Security Ordinance.
State Revenue Collection Fund – Accounts for various fees, fines and penalties collected by City
departments for the State of California which are passed through to the State.
Successor Agency Custodial Fund – Accounts for the custodial funds of the Successor Agency.
Tax Collection Fund – Accounts for monies received for current and delinquent taxes which must be held
pending authority for distribution. Included are prepaid taxes, disputed taxes, duplicate payment of
taxes, etc. This fund also accounts for monies deposited by third parties pending settlement of
litigation and claims. Upon final settlement, monies are disbursed as directed by the courts or by
parties to the dispute.
Other Funds – Accounts for monies held as agent for a variety of purposes.

CITY AND COUNTY OF SAN FRANCISCO
Combining Statement of Fiduciary Net Position
Fiduciary Funds
Pension and Other Employee Benefit Trust Funds
June 30, 2023
(In Thousands)
265
Pension Trust
Fund
Other
Employee
Benefit
Trust Fund
Other Post-
employment
Benefit Trust
Fund
Employees
Retirement
System
Health
Service
System
Retiree
Health Care
Trust
Total
Assets:
Deposits and investments with City Treasury.......... -$ 119,967$ 2,558$ 122,525$
Deposits and investments outside City Treasury:
Cash and deposits.................................................. 17,929 - - 17,929
Short-term investments.......................................... 376,288 - 7,918 384,206
Debt securities........................................................ 1,835,260 - 205,810 2,041,070
Equity securities..................................................... 10,448,696 - 569,418 11,018,114
Real assets............................................................. 5,207,943 - 35,983 5,243,926
Private equity and other alternative investments.... 15,764,931 - 126,626 15,891,557
Foreign currency contracts, net............................. (1,029) - - (1,029)
Invested securities lending collateral........................ 562,491 - - 562,491
Receivables:
Employer and employee contributions................... 22,935 27,542 7,068 57,545
Brokers, general partners and others..................... 122,854 - 13,000 135,854
Interest and other.................................................... 16,595 990 1,294 18,879
Other assets............................................................. - 5,201 - 5,201
Total assets........................................................ 34,374,893 153,700 969,675 35,498,268
Deferred outflows related to OPEB............................ 2,366 - - 2,366
Liabilities:
Accounts payable...................................................... 59,453 6,805 25 66,283
Estimated claims payable......................................... - 38,152 - 38,152
Payable to brokers.................................................... 53,813 - 1,225 55,038
Payable to borrowers of securities........................... 562,408 - - 562,408
Other liabilities........................................................... - 3,999 - 3,999
Net OPEB liability...................................................... 11,279 - - 11,279
Total liabilities..................................................... 686,953 48,956 1,250 737,159
Deferred inflows related to OPEB............................... 1,878 - - 1,878
Net position restricted for:
Pensions................................................................... 33,688,428 - - 33,688,428
Postemployment healthcare benefits....................... - - 968,425 968,425
Individuals, organizations, and other governments.. - 104,744 - 104,744
Restricted for pension and other employee benefits.. 33,688,428$ 104,744$ 968,425$ 34,761,597$

CITY AND COUNTY OF SAN FRANCISCO
Combining Statement of Changes in Fiduciary Net Position
Fiduciary Funds
Pension and Other Employee Benefit Trust Funds
Year Ended June 30, 2023
(In Thousands)
266
Pension Trust
Fund
Other
Employee
Benefit Trust
Fund
Other Post-
employment
Benefit
Trust Fund
Employees
Retirement
System
Health
Service
System
Retiree
Health Care
Trust
Total
Additions:
Employee contributions...................................................... 413,916$ 199,197$ 75,157$ 688,270$
Employer contributions....................................................... 672,651 873,618 273,752 1,820,021
Total contributions...................................................... 1,086,567 1,072,815 348,909 2,508,291
Investment income (expenses):
Interest.............................................................................. 66,501 3,301 13,662 83,464
Dividends.......................................................................... 94,883 - - 94,883
Net appreciation (depreciation)
in fair value of investments........................................... 1,560,025 (315) 70,419 1,630,129
Securities lending income................................................ 29,305 - - 29,305
Total investment income.............................................. 1,750,714 2,986 84,081 1,837,781
Less investment expenses:
Other investment expenses............................................. (80,048) - (417) (80,465)
Net investment income................................................ 1,670,666 2,986 83,664 1,757,316
Total additions, net....................................................... 2,757,233 1,075,801 432,573 4,265,607
Deductions:
Benefit payments…………................................................. 1,820,269 1,077,773 225,262 3,123,304
Refunds of contributions..................................................... 24,096 - - 24,096
Administrative expenses..................................................... 22,964 - 171 23,135
Total deductions........................................................... 1,867,329 1,077,773 225,433 3,170,535
Change in net position.................................................. 889,904 (1,972) 207,140 1,095,072
Net position at beginning of year........................................... 32,798,524 106,716 761,285 33,666,525
Net position at end of year..................................................... 33,688,428$ 104,744$ 968,425$ 34,761,597$

CITY AND COUNTY OF SAN FRANCISCO
Combining Statement of Fiduciary Net Position
Fiduciary Funds
Custodial Funds
June 30, 2023
(In Thousands)
267
Assistance
Program Fund
Community
Facilities
Districts Fund
Deposits Fund
Assets:
Deposits and investments with City Treasury..................... 18,464$ 1,667$ 25,684$
Deposits and investments outside City Treasury:
Cash and deposits............................................................. - 163,591 183
Receivables:
Federal and state grants and subventions........................ - - -
Charges for services......................................................... - - 3
Taxes................................................................................. - - -
Interest and other............................................................... 114 949 18
Restricted assets:
Deposits and investments outside City Treasury......... - - -
Total assets................................................................... 18,578 166,207 25,888
Liabilities:
Accounts payable................................................................. - 566 101
Custodial obligations to State of California.......................... - - -
Taxes payable to other governments.................................. - - -
Other liabilities...................................................................... - - -
Total liabilities................................................................ - 566 101
Net position restricted for:
Individuals, organizations, and other governments............. 18,578$ 165,641$ 25,787$
(Continued)

CITY AND COUNTY OF SAN FRANCISCO
Combining Statement of Fiduciary Net Position
Fiduciary Funds
Custodial Funds (Continued)
June 30, 2023
(In Thousands)
268
Medical
Reimbursement
Accounts Fund
State Revenue
Collection
Fund
Successor
Agency
Custodial
Fund
Assets:
Deposits and investments with City Treasury..................... 875,043$ 704$ 42,811$
Deposits and investments outside City Treasury:
Cash and deposits............................................................. - - -
Receivables:
Federal and state grants and subventions........................ - - -
Charges for services......................................................... - 1 -
Taxes................................................................................. - - -
Interest and other............................................................... 4,039 1 2,220
Restricted assets:
Deposits and investments outside City Treasury......... - - 28,885
Total assets................................................................... 879,082 706 73,916
Liabilities:
Accounts payable................................................................. 2,017 16 41
Custodial obligations to State of California.......................... - 690 -
Taxes payable to other governments.................................. - - -
Other liabilities...................................................................... - - -
Total liabilities................................................................ 2,017 706 41
Net position restricted for:
Individuals, organizations, and other governments............. 877,065$ -$ 73,875$
(Continued)

CITY AND COUNTY OF SAN FRANCISCO
Combining Statement of Fiduciary Net Position
Fiduciary Funds
Custodial Funds (Continued)
June 30, 2023
(In Thousands)
269
Tax Collection
Fund
Other Total
Assets:
Deposits and investments with City Treasury..................... 209,857$ 58,641$ 1,232,871$
Deposits and investments outside City Treasury:
Cash and deposits............................................................. 2 - 163,776
Receivables:
Federal and state grants and subventions........................ - 8,537 8,537
Charges for services......................................................... - - 4
Taxes................................................................................. 155,105 - 155,105
Interest and other............................................................... 13 95 7,449
Restricted assets:
Deposits and investments outside City Treasury......... - - 28,885
Total assets................................................................... 364,977 67,273 1,596,627
Liabilities:
Accounts payable................................................................. - 9,419 12,160
Custodial obligations to State of California.......................... - - 690
Taxes payable to other governments.................................. 247,894 4,557 252,451
Other liabilities...................................................................... 117,083 - 117,083
Total liabilities................................................................ 364,977 13,976 382,384
Net position restricted for:
Individuals, organizations, and other governments............. -$ 53,297$ 1,214,243$

CITY AND COUNTY OF SAN FRANCISCO
Combining Statement of Changes in Fiduciary Net Position
Fiduciary Funds
Custodial Funds
Year Ended June 30, 2023
(In Thousands)
270
Assistance
Program Fund
Community
Facilities
Districts Fund
Deposits Fund
Additions:
Property taxes......................................................................... -$ 38,050$ -$
Interest and investment income (loss)................................... 330 7,525 196
Custodial additions.................................................................. 990 - 31,644
Other additions........................................................................ - 51,829 -
Total additions, net......................................................... 1,320 97,404 31,840
Deductions:
Interest on debt....................................................................... - 29,393 -
Property taxes distributed to other governments.................... - - -
Custodial distributions to State............................................... - - -
Other custodial deductions..................................................... 971 25,130 31,869
Total deductions............................................................... 971 54,523 31,869
Change in net position...................................................... 349 42,881 (29)
Net position at beginning of year............................................... 18,229 134,118 25,816
Cumulative effect of accounting change................................... - (11,358) -
Net position at beginning of year, as restated........................... 18,229 122,760 25,816
Net position at end of year......................................................... 18,578$ 165,641$ 25,787$
(Continued)

CITY AND COUNTY OF SAN FRANCISCO
Combining Statement of Changes in Fiduciary Net Position
Fiduciary Funds
Custodial Funds (Continued)
Year Ended June 30, 2023
(In Thousands)
271
Medical
Reimbursement
Accounts Fund
State Revenue
Collection
Fund
Successor
Agency
Custodial
Fund
Additions:
Property taxes......................................................................... -$ -$ 19,920$
Interest and investment income (loss)................................... (7,129) 20 1,311
Custodial additions.................................................................. 901,517 12,802 970
Other additions........................................................................ - - -
Total additions, net......................................................... 894,388 12,822 22,201
Deductions:
Interest on debt....................................................................... - - -
Property taxes distributed to other governments.................... - - -
Custodial distributions to State............................................... - 12,822 -
Other custodial deductions..................................................... 17,323 - 14,685
Total deductions............................................................... 17,323 12,822 14,685
Change in net position...................................................... 877,065 - 7,516
Net position at beginning of year............................................... - - 66,359
Cumulative effect of accounting change................................... - - -
Net position at beginning of year, as restated........................... - - 66,359
Net position at end of year......................................................... 877,065$ -$ 73,875$
(Continued)

CITY AND COUNTY OF SAN FRANCISCO
Combining Statement of Changes in Fiduciary Net Position
Fiduciary Funds
Custodial Funds (Continued)
Year Ended June 30, 2023
(In Thousands)
272
Tax Collection
Fund
Other Total
Additions:
Property taxes......................................................................... 5,328,722$ 209,415$ 5,596,107$
Interest and investment income (loss)................................... 13,053 118 15,424
Custodial additions.................................................................. - 74,834 1,022,757
Other additions........................................................................ - - 51,829
Total additions, net......................................................... 5,341,775 284,367 6,686,117
Deductions:
Interest on debt....................................................................... - - 29,393
Property taxes distributed to other governments.................... 5,341,775 209,682 5,551,457
Custodial distributions to State............................................... - - 12,822
Other custodial deductions..................................................... - 79,783 169,761
Total deductions............................................................... 5,341,775 289,465 5,763,433
Change in net position...................................................... - (5,098) 922,684
Net position at beginning of year............................................... - 58,395 302,917
Cumulative effect of accounting change................................... - - (11,358)
Net position at beginning of year, as restated........................... - 58,395 291,559
Net position at end of year......................................................... -$ 53,297$ 1,214,243$

CITY AND COUNTY OF SAN FRANCISCO
Schedule of Fund Balance – General Fund
Fiscal Years 2018-19 through 2022-23
(In Thousands)
273
2018-19 2019-20 2020-21 2021-22 2022-23
Restricted for rainy day (Economic Stabilization account) $229,069 $229,069 $114,539 $114,539 $114,539
Restricted for rainy day (One-time Spending account) 95,908 - - - -
Committed for budget stabilization (citywide) 396,760 362,607 320,637 320,637 330,010
Committed for Recreation & Parks savings reserve 803 803 - - -
Assigned, not available for appropriation
Assigned for encumbrances 351,446 394,912 407,137 462,668 424,301
Assigned for appropriation carryforward 496,846 630,759 753,776 940,213 840,748
Assigned for budget savings incentive program (Citywide) 86,979 - - - -
Assigned for salaries and benefits 28,965 25,371 5,088 17,921 27,927
Assigned for Self-Insurance - - 42,454 45,567 46,496
Assigned for Hotel Tax Loss Contingency - - 6,000 3,500 3,500
Total Fund Balance Not Available for Appropriation 1,686,776 1,643,521 1,649,631 1,905,045 1,787,521
Assigned and unassigned, available for appropriation
Assigned for litigation and contingencies 186,913 160,314 173,591 235,133 259,230
Assigned for subsequent year's budget 210,638 370,405 173,989 307,743 122,701
Unassigned for General Reserve 130,894 78,498 78,333 57,696 64,707
Unassigned - Budgeted for use second budget year 285,152 84 - 149,695 291,710
Unassigned - Projected for use third and fourth budget year - - - 163,400 81,190
Unassigned - Contingency for second budget year 308,000 510,400 - - -
Unassigned - COVID-19 Response and Economic Contingency Reserve
- - 113,500 13,999 -
Unassigned - Federal & State Emergeny Revenue Reserve - - 100,000 81,300 81,300
Unassigned - Fiscal Cliff Reserve - - 293,900 229,750 220,432
Unassigned - Business Tax Stabilization Reserve - - 149,000 29,454 29,454
Unassigned - Gross Receipts Prepayment Reserve - - 26,000 - -
Unassigned - Other Reserve - - 13,807 1,021 22,234
Unassigned - Available for future appropriation 8,897 18,283 31,784 39,795 3,126
Total Fund Balance Available for Appropriation 1,130,494 1,137,984 1,153,904 1,308,986 1,176,084
Total Fund Balance, Budget Basis 2,817,270 2,781,505 2,803,535 3,214,031 2,963,605
Budgeted Basis to GAAP Basis Reconciliation
Total Fund Balance - Budget Basis 2,817,270 2,781,505 2,803,535 3,214,031 2,963,605
Unrealized gain or loss on investments 16,275 36,626 3,978 (156,403) (158,859)
Nonspendable fund balance 1,259 1,274 2,714 4,134 1,174
Cumulative Excess Property Tax Revenues Recognized on Budget Basis
(23,793) (20,655) (31,745) (32,874) (40,685)
(87,794) (139,590) (120,569) (118,791) (111,163)
Inventories - 33,212 17,925 - -
Pre-paid lease revenue (6,194) (6,450) (5,734) (4,954) (5,935)
Total Fund Balance, GAAP Basis $2,717,023 $2,685,922 $2,670,104 $2,905,143 $2,648,137
Cumulative Excess Health, Human Service, Franchise Tax and
other

CITY AND COUNTY OF SAN FRANCISCO
General Fund Schedule of Revenues, Expenditures, and Changes
In Fund Balance¹
Fiscal Years 2018-19 through 2022-23
(In Thousands)
274
2018-19 2019-20 2020-21 2021-22 2022-23
Revenues:
Property Taxes
2
2,248,004$ 2,075,002$ 2,332,864$ 2,336,071$ 2,459,052$
Business Taxes 917,811 822,154 722,642 861,172 850,593
Other Local Taxes
3
1,215,306 996,180 709,018 1,115,553 1,108,545
Licenses, Permits And Franchises 27,960 25,318 12,332 32,078 28,953
Fines, Forfeitures, And Penalties 4,740 3,705 4,508 5,755 3,191
Interest And Investment Income 88,523 65,459 (1,605) (93,447) 68,319
Rents And Concessions 14,460 9,816 5,111 10,668 11,775
Intergovernmental 1,069,349 1,183,341 1,607,803 1,795,395 1,339,711
Charges For Services 257,814 229,759 230,048 238,438 243,234
Other 46,254 62,218 46,434 23,265 29,677
Total Revenues 5,890,221 5,472,952 5,669,155 6,324,948 6,143,050
Expenditures:
Public Protection 1,382,031 1,479,195 1,498,514 1,562,797 1,654,953
Public Works, Transportation and Commerce 202,988 203,350 204,973 232,078 265,019
Human Welfare and Neighborhood Development 1,071,309 1,252,865 1,562,982 1,478,115 1,577,163
Community Health 809,120 909,261 1,056,590 1,002,047 967,381
Culture and Recreation 152,250 155,164 145,405 159,056 172,832
General Administration & Finance 267,997 304,073 314,298 298,742 301,748
General City Responsibilities 144,808 129,941 113,913 156,870 189,570
Total Expenditures 4,030,503 4,433,849 4,896,675 4,889,705 5,128,666
Excess Of Revenues Over Expenditures 1,859,718 1,039,103 772,480 1,435,243 1,014,384
Other Financing Sources (Uses):
Transfers In 104,338 87,618 343,498 84,107 119,361
Transfers Out (1,468,971) (1,157,822) (1,166,855) (1,209,383) (1,316,074)
Other
1
(3) - (338) (74,928) (74,677)
Total Other Financing Sources (Uses) (1,364,636) (1,070,204) (823,695) (1,200,204) (1,271,390)
Excess (Deficiency) of Revenues and Other Sources
Over Expenditures and Other Uses 495,082 (31,101) (51,215) 235,039 (257,006)
Total Fund Balance at Beginning of Year 2,221,941 2,717,023 2,685,922 2,670,104 2,905,143
Cumulative Effect of accounting change - - 35,397 - -
Total Fund Balances at End of Year - GAAP Basis 2,717,023$ 2,685,922$ 2,670,104$ 2,905,143$ 2,648,137$
Assigned for Subsequent Year's Appropriations and Unassigned Fund Balance, Year End
-- GAAP Basis 326,582 395,776 179,077 325,664 150,628
-- Budget Basis 812,687 896,172 901,980 1,016,157 852,147
1
Summary of financial information derived from City ACFRs. Fund balances include amounts reserved for rainy day (Economic Stabilzation and One-time Spending
amounts), emcumbrances, appropriation carryforwards and other purposes (as required by the Charter or appropriate accounting practices) as well as unreserved
designated and undesignated available fund balances (which amounts constitute unrestricted General Fund balances). Other includes debt service net of capital
outlay and inception of leases/SBITAs.
2
The City recognized $548.0 million of "Excess Educational Revenue Augmentation Fund (ERAF)" revenue in FY 2018-19, representing FY16-17, FY17-18,
and fy18-19 (3 fiscal years) of ERAF. Please see "GENERAL FUND REVENUES - Property Taxation" for more information about Excess ERAF.
3
Other Local Taxes includes sales, hotel, utility users, parking, sugar sweetened beverage, stadium admissions, access line, and cannabis taxes
(effective January 1, 2022).

STATISTICAL SECTION
CITY AND COUNTY OF SAN FRANCISCO
Statistical Section
275
This section of the City's annual comprehensive financial report presents detailed information as a context
for understanding what the information in the financial statements, note disclosures, and required
supplementary information says about the City's overall financial health.
Financial Trends
These schedules contain trend information to help the reader understand how the City's financial
performance and well-being have changed over time.
Revenue Capacity
These schedules contain information to help the reader assess the City's most significant local revenue
source, the property tax.
Debt Capacity
These schedules present information to help the reader assess the affordability of the City's current
levels of outstanding debt and the City's ability to issue additional debt in the future.
Demographic and Economic Information
These schedules offer demographic and economic indicators to help the reader understand the
environment within which the City's financial activities take place.
Operating Information
These schedules contain information about the City's operations and resources to help the reader
understand how the City's financial information relates to the services the City provides and the
activities it performs.
Sources:
Unless otherwise noted, the information in these schedules is derived from the annual comprehensive
financial reports for the relevant year.

CITY AND COUNTY OF SAN FRANCISCO
NET POSITION BY COMPONENT
Last Ten Fiscal Years
(Accrual Basis of Accounting)
(In Thousands)
276
2014
2015
(1)
2016 2017
2018
(3)
2019 2020
2021
(4)
2022
(5)
2023
(6)
Governmental activities
Net investment in capital assets………………………………..
2,483,086$ 2,684,808$ 2,750,782$ 2,873,927$ 3,311,218$ 3,681,341$ 3,853,271$ 3,927,209$ 4,183,166$ 4,491,155$
Restricted for:
Reserve for rainy day……………………………………………………………………………..
83,194 114,969 120,106 125,689 143,977 324,977 229,069 114,539 114,359 114,539
Debt service…………...……………………………………...
91,900 87,772 83,029 108,179 136,132 104,720 113,765 136,571 152,808 156,851
Capital projects……………….…………………………………………………
110,608 28,263 198,962 257,634 196,598 186,015 297,975 256,804 299,063 319,105
Community development………………………………………………
200,640 297,094 433,398 434,691 427,684 624,127 628,484 1,267,587 1,255,903 998,679
Transportation Authority activities…………………………...
12,496 13,486 15,657 16,189 17,499 21,554 28,673 42,420 56,868 72,024
Building inspection programs.......................................................................................................................................................
97,928 109,512 134,663 150,109 155,448 166,510 162,182 130,927 101,447 74,418
Children and families ...................................................................................................................................................................
59,572 100,892 105,177 115,284 134,548 181,248 187,538 511,810 621,973 669,822
Culture, recreation, grants and other purposes……………………………………………….
206,368 209,399 240,524 265,444 319,595 415,236 470,912 505,112 582,898 656,619
Unrestricted (deficit)……………………………………………..
(1,004,161) (2,358,981) (2,073,235) (2,560,735) (2,950,722) (2,804,237) (2,838,247) (3,133,782) (2,037,466) (2,030,666)
Total governmental activities net position…………………..
2,341,631$ 1,287,214$ 2,009,063$ 1,786,411$ 1,891,977$ 2,901,491$ 3,133,622$ 3,759,197$ 5,331,019$ 5,522,546$
Business-type activities
Net investment in capital assets………………………………..
4,832,659$ 5,117,679$ 5,690,741$ 5,752,069$ 6,176,022$ 6,764,333$ 7,013,098$ 7,003,396$ 6,763,452$ 6,851,218$
Restricted for:
Debt service………………………………………………….. 64,143 100,923 127,073 202,262 294,499 331,118 316,671 242,381 158,479 171,232
Capital projects………………………………………………..
363,601 358,745 340,896 394,634 515,072 556,980 523,169 510,813 651,052 1,014,138
Other purposes……………………………………………......
24,721 35,986 70,505 93,696 294,122 165,675 116,861 301,944 358,526 10,174
Unrestricted (deficit).…..…………………………………………………
732,736 (335,083) (231,379) (670,759) (1,492,713) (1,117,385) (1,004,826) (1,162,508) (435,349) (168,113)
Total business-type activities net position……………………..
6,017,860$ 5,278,250$ 5,997,836$ 5,771,902$ 5,787,002$ 6,700,721$ 6,964,973$ 6,896,026$ 7,496,160$ 7,878,649$
Primary government
7,032,674$ 7,520,698$ 8,151,422$ 8,321,778$ 9,157,665$ 10,048,870$ 10,474,620$ 10,561,206$ 10,561,965$ 10,935,272$
Restricted for:
Reserve for rainy day……………………………………….
83,194 114,969 120,106 125,689 143,977 324,977 229,069 114,539 114,359 114,539
Debt service………………………………………………… 156,043 188,695 210,102 310,441 430,631 435,838 430,436 378,952 311,287 328,083
418,103 330,213 423,132 569,948 569,115 692,052 793,888 646,400 771,576 1,208,105
Community development……………………………………..
200,640 297,094 433,398 434,691 427,684 624,127 628,484 1,267,587 1,255,903 998,679
Transportation Authority activities……………………………….
12,496 13,486 15,657 16,189 17,499 21,554 28,673 42,420 56,868 72,024
Building inspection programs.......................................................................................................................................................
97,928 109,512 134,663 150,109 155,448 166,510 162,182 130,927 101,447 74,418
Children and families ...................................................................................................................................................................
59,572 100,892 105,177 115,284 134,548 181,248 187,538 511,810 621,973 669,822
Culture, recreation, grants and other purposes……………………………………………….
231,089 245,385 311,029 359,140 613,717 580,911 587,773 807,056 941,424 666,793
67,752 (2,355,480) (1,897,787) (2,844,956) (3,971,305) (3,473,875) (3,424,068) (3,805,674) (1,909,623) (1,666,540)
Total primary government activities net position……………………………..
8,359,491$ 6,565,464$ 8,006,899$ 7,558,313$ 7,678,979$ 9,602,212$ 10,098,595$ 10,655,223$ 12,827,179$ 13,401,195$
Notes:
(1) In fiscal year 2015, the City adopted the provisions of GASB Statement Nos.68 and 71. As restatement of all prior periods is not practical, the cumulative effect of applying these statements is reported as a restatement of
beginning net position as of July 1, 2014.
(2) Certain net position reclassifications were made to reflect the primary government as a whole perspective since fiscal year 2019. See Note 10(d) in the Notes to Basic Financial Statements for details.
(3) In fiscal year 2018, the City adopted the provisions of GASB Statement No. 75. As restatement of all prior periods is not practical, the cumulative effect of applying this statement is reported as a restatement of beginning net
position as of July 1, 2017.
(4) In fiscal year 2021, the City adopted the provisions of GASB Statement No. 84. As restatement of all prior periods is not practical, the cumulative effect of applying this statement is reported as a restatement of beginning net
position as of July 1, 2020.
(5) In fiscal year 2022, the City adopted the provisions of GASB Statement Nos. 87 and 89. As restatement of all prior periods is not practical, the cumulative effect of applying GASB Statement No. 87 is reported as a restatement
of beginning net position as of July 1, 2021.
(6) In fiscal year 2023, the City adopted the provisions of GASB Statement Nos. 94 and 96. As restatement of all prior periods is not practical, the cumulative effect of applying GASB Statement Nos. 94 and 96 is reported as a
restatement of beginning net position as of July 1, 2021.
Fiscal Year
Net investment in capital assets
(2)
…………………………………...
Capital projects
(2)
………………………………………………..
Unrestricted (deficit)
(2)
………………………………………………
CITY AND COUNTY OF SAN FRANCISCO
CHANGES IN NET POSITION
Last Ten Fiscal Years
(Accrual Basis of Accounting)
(In Thousands)
277
2014
2015
(1)
2016 2017 2018
(2)
2019 2020 2021
(3)
2022
(4)
2023
(5)
Expenses
Governmental activities:
Public protection…………………………………………………………………………………………………….
1,229,591$ 1,108,200$ 1,222,549$ 1,692,224$ 1,496,749$ 1,496,341$ 1,661,262$ 1,744,103$ 1,252,725$ 1,671,702$
Public works, transportation and commerce……………………… 200,712 270,454 418,978 387,423 321,577 331,717 362,133 530,087 336,059 446,286
Human welfare and neighborhood development………………………
1,009,190 1,073,652 1,233,403 1,543,047 1,552,060 1,720,425 2,137,968 2,384,993 2,332,530 2,883,425
Community health……………………………………………………………………………………………….
786,761 735,040 747,071 868,628 914,512 960,422 1,148,208 1,241,282 1,151,847 1,206,314
Culture and recreation……………………………………………………………………………………
357,620 355,676 311,028 539,516 425,668 594,219 519,015 467,251 398,314 537,393
General administration and finance…………………………………….
298,563 249,823 246,383 337,209 430,711 330,358 416,370 475,428 335,772 482,618
Distributions to other governments…………………………………….
- - - - - - - - 47,296 49,113
General City responsibilities……………………………………………………………………………………..
85,239 94,577 113,490 145,247 118,956 156,907 119,693 100,077 129,138 175,522
Unallocated interest on long-term debt and cost of issuance ……..
115,880 115,030 115,357 113,264 138,048 153,220 145,600 144,334 155,467 155,749
Total governmental activities expenses…………………………. 4,083,556 4,002,452 4,408,259 5,626,558 5,398,281 5,743,609 6,510,249 7,087,555 6,139,148 7,608,122
Business-type activities:
Airport…………………………………………………………………………………………………………
827,658 853,338 900,621 1,122,802 1,092,154 1,067,265 1,344,734 1,294,064 1,175,430 1,278,517
Transportation………………………………………………………………………………………………….
1,037,368 1,018,251 1,106,420 1,468,586 1,304,254 1,304,358 1,438,417 1,327,418 1,076,249 1,439,742
Port………………………………………………………………………………………………………………..
88,551 88,436 91,449 118,361 102,667 123,116 131,884 142,126 110,108 127,817
Water…………………………………………………………………………………………………………………….
470,200 438,885 470,254 572,509 536,068 536,480 576,140 627,875 606,409 666,970
Power…………………………………………………………………………………………………………………
137,639 149,438 153,472 198,621 202,366 314,471 392,669 411,605 477,202 544,742
Hospitals……………………………………………………………………………………………………………….
1,011,452 996,395 1,050,618 1,370,154 1,294,045 1,236,823 1,332,648 1,376,112 1,300,196 1,419,409
Sewer……………………………………………………………………………………………………………
243,466 239,556 244,289 273,077 264,298 304,010 296,842 318,976 326,952 343,018
Market………...…………………………………………………………………………………………………
120 - - - - - - - - -
Total business-type activities expenses……………………………………………………………….
3,816,454 3,784,299 4,017,123 5,124,110 4,795,852 4,886,523 5,513,334 5,498,176 5,072,546 5,820,215
Total primary government expenses………………………………………………………………….
7,900,010$ 7,786,751$ 8,425,382$ 10,750,668$ 10,194,133$ 10,630,132$ 12,023,583$ 12,585,731$ 11,211,694$ 13,428,337$
Program Revenues
Governmental activities:
Charges for services:
Public protection…………………………………………………………………………………………
69,673$ 70,444$ 86,164$ 83,896$ 87,614$ 121,848$ 105,508$ 85,593$ 101,317$ 103,361$
Public works, transportation and commerce…………………………………………………………..
135,842 128,661 130,410 148,804 157,416 164,578 138,328 136,455 102,094 133,565
Human welfare and neighborhood development………………… 99,848 96,012 273,986 164,755 82,925 134,839 212,743 207,974 237,611 170,535
Community health…………………………………………………………………………………………
67,680 93,130 90,078 68,601 104,335 101,678 107,078 120,141 87,248 91,056
Culture and recreation………………………………………………………………………………….
89,969 98,302 98,205 97,614 125,776 136,928 127,196 42,676 92,549 135,998
General administration and finance………………………………………………………………………..
66,071 89,403 52,417 45,385 73,235 99,278 97,130 80,780 108,893 188,245
General City responsibilities………………………………………………………………………………
39,445 37,031 45,922 37,367 54,136 56,027 66,885 57,943 55,587 66,925
Operating grants and contributions……………………………………………………………………….
1,142,094 1,165,340 1,289,902 1,263,262 1,279,900 1,392,516 1,518,051 1,925,539 2,185,343 1,762,809
Capital grants and contributions……………………………………………………………………..
39,379 48,233 24,795 19,493 63,181 233,184 146,400 130,937 105,459 150,625
Total governmental activities program revenues…………………………………………………………
1,750,001 1,826,556 2,091,879 1,929,177 2,028,518 2,440,876 2,519,319 2,788,038 3,076,101 2,803,119
Business-type activities:
Charges for services:
Airport………………………………………………………………………………………………………..
770,691 815,364 866,991 926,800 1,063,802 980,443 943,879 515,416 821,253 1,064,104
Transportation………………………………………………………………………………………………..
521,628 499,584 495,296 500,030 511,984 505,159 390,285 207,288 315,543 350,188
Port……………………………………………………………………………………………………….
85,019 95,296 99,733 113,353 109,769 122,033 108,863 94,330 120,951 128,667
Water…………………………………………………………………………………………………………….
379,882 426,047 419,516 460,331 525,639 542,391 583,351 581,612 573,117 691,091
Power……………………………………………………………………………………………………..
134,438 147,803 164,736 189,979 191,963 345,386 421,284 391,171 480,447 583,477
Hospitals………………………………………………………………………………………………………..
951,038 894,718 922,320 873,221 967,936 1,014,124 1,092,622 1,070,390 1,167,993 1,213,925
Sewer……………………………………………………………………………………………………………
260,097 256,002 261,775 277,341 315,096 331,081 344,128 327,665 368,882 363,936
Market……………….…………………………………………………………………………………………
141 - - - - - - - - -
Operating grants and contributions………………………………………………………………………
190,351 191,101 199,623 270,167 217,506 251,757 455,673 710,059 545,636 444,009
Capital grants and contributions………………………………………………………………………
515,445 357,819 374,924 353,046 456,166 467,069 361,266 231,890 185,816 235,952
Total business-type activities program revenues………………..
3,808,730 3,683,734 3,804,914 3,964,268 4,359,861 4,559,443 4,701,351 4,129,821 4,579,638 5,075,349
Total primary government program revenues…………………… 5,558,731$ 5,510,290$ 5,896,793$ 5,893,445$ 6,388,379$ 7,000,319$ 7,220,670$ 6,917,859$ 7,655,739$ 7,878,468$
Notes:
(1) In fiscal year 2014-15, the City adopted the provisions of GASB Statement Nos. 68 and 71. As restatement of all prior periods is not practical, the cumulative effect of applying these statements is reported as a restatement of beginning net position
as of July 1, 2014.
(2) In fiscal year 2017-18, the City adopted the provisions of GASB Statement No. 75. As restatement of all prior periods is not practical, the cumulative effect of applying this statement is reported as a restatement of beginning net position as of July 1, 2017.
(3) In fiscal year 2020-21, the City adopted the provisions of GASB Statement No. 84. As restatement of all prior periods is not practical, the cumulative effect of applying this statement is reported as a restatement of beginning net position as of July 1, 2020.
(4) In fiscal year 2021-22, the City adopted the provisions of GASB Statement Nos. 87 and 89. As restatement of all prior periods is not practical, the cumulative effect of applying GASB Statement No. 87 is reported as a restatement of beginning net
position as of July 1, 2021.
(5) In fiscal year 2022-23, the City adopted the provisions of GASB Statement Nos. 94 and 96. As restatement of all prior periods is not practical, the cumulative effect of applying GASB Statement Nos. 94 and 96 is reported as a restatement of beginning net
position as of July 1, 2022.
Fiscal Year

CITY AND COUNTY OF SAN FRANCISCO
CHANGES IN NET POSITION (Continued)
Last Ten Fiscal Years
(Accrual Basis of Accounting)
(In Thousands)
278
2014
2015
(1)
2016 2017 2018
(2)
2019 2020 2021
(3)
2022
(4)
2023
(5)
Net (expenses)/revenue
Governmental activities………………………………………………………………………………
(2,333,555)$ (2,175,896)$ (2,316,380)$ (3,697,381)$ (3,369,763)$ (3,302,733)$ (3,990,930)$ (4,299,517)$ (3,063,047)$ (4,805,003)$
Business-type activities…………………………………………………………………………….
(7,724) (100,565) (212,209) (1,159,842) (435,991) (327,080) (811,983) (1,368,355) (492,908) (744,866)
Total primary government net expenses……………………………………………………
(2,341,279)$ (2,276,461)$ (2,528,589)$ (4,857,223)$ (3,805,754)$ (3,629,813)$ (4,802,913)$ (5,667,872)$ (3,555,955)$ (5,549,869)$
General Revenues and Other Changes in Net Position
Governmental activities:
Taxes
Property taxes……………………………………………………………………………………..
1,521,471$ 1,640,383$ 1,808,917$ 1,951,696$ 2,363,863$ 2,581,308$ 2,733,334$ 2,972,067$ 3,004,800$ 3,167,382$
Business taxes……………………………………………………………………………………
563,406 611,932 660,926 702,331 899,142 919,552 833,931 1,894,604 1,326,675 1,290,918
Sales and use tax..........................................................................................................................
227,636 240,424 270,051 291,395 293,916 329,296 279,453 233,393 293,155 309,385
Hotel room tax..........................................................................................................................
310,052 394,262 387,661 370,344 382,176 408,348 280,970 37,698 174,609 278,961
Utility users tax..........................................................................................................................
86,810 98,979 98,651 101,203 94,460 93,918 94,231 81,367 105,225 110,661
Other local taxes………………………………………………………………………………
391,638 451,994 399,882 542,567 424,187 515,435 474,859 453,852 676,304 564,753
Interest and investment income (loss)……………………………………………………………………
21,887 20,737 24,048 35,240 46,020 178,350 142,181 10,688 (160,687) 157,267
Other………………………………………………………………………………………………….
70,024 46,906 59,266 182,933 71,834 88,788 63,552 67,838 80,295 99,471
Transfers - internal activities of primary government…………………………………………………
(311,627) (504,791) (671,173) (647,942) (753,283) (802,748) (679,450) (861,966) (866,631) (885,106)
Special item ……………………………………………………………….
- - - - - - - - - -
Total governmental activities……………………………………………………………..
2,881,297 3,000,826 3,038,229 3,529,767 3,822,315 4,312,247 4,223,061 4,889,541 4,633,745 5,093,692
Business-type activities:
Interest and investment income (loss)……………………………………………………………….
29,843 25,999 28,566 28,547 39,010 182,666 151,319 (3,066) (108,628) 108,704
Other…………………………………………………………………………………………….
82,737 200,148 240,636 257,419 246,827 237,045 245,466 440,508 327,454 240,145
Transfers - internal activities of primary government…………………………………………..
311,627 504,791 671,173 647,942 753,283 802,748 679,450 861,966 866,631 885,106
Special item ……………………………………………………………….
- - - - - 18,340 - - - -
Extraordinary gain (loss)……………………………………………………………………………………………….
(6,843) - - - - - - - - -
Total business-type activities………………………………………………………………
417,364 730,938 940,375 933,908 1,039,120 1,240,799 1,076,235 1,299,408 1,085,457 1,233,955
Total primary government……………………………………………………………………..
3,298,661$ 3,731,764$ 3,978,604$ 4,463,675$ 4,861,435$ 5,553,046$ 5,299,296$ 6,188,949$ 5,719,202$ 6,327,647$
Change in Net Position
Governmental activities……………………………………………………………………
547,742$ 824,930$ 721,849$ (167,614)$ 452,552$ 1,009,514$ 232,131$ 590,024$ 1,570,698$ 288,689$
Business-type activities………………………………………………………………………
409,640 630,373 728,166 (225,934) 603,129 913,719 264,252 (68,947) 592,549 489,089
Total primary government……………………………………………………………….
957,382$ 1,455,303$ 1,450,015$ (393,548)$ 1,055,681$ 1,923,233$ 496,383$ 521,077$ 2,163,247$ 777,778$
Notes:
(1) In fiscal year 2014-15, the City adopted the provisions of GASB Statement Nos. 68 and 71. As restatement of all prior periods is not practical, the cumulative effect of applying these statements is reported as a restatement of beginning net position
as of July 1, 2014.
(2) In fiscal year 2017-18, the City adopted the provisions of GASB Statement No.75. As restatement of all prior periods is not practical, the cumulative effect of applying this statement is reported as a restatement of beginning net position as of July 1, 2017.
(3) In fiscal year 2020-21, the City adopted the provisions of GASB Statement No.84. As restatement of all prior periods is not practical, the cumulative effect of applying this statement is reported as a restatement of beginning net position as of July 1, 2020.
(4) In fiscal year 2021-22, the City adopted the provisions of GASB Statement Nos. 87 and 89. As restatement of all prior periods is not practical, the cumulative effect of applying GASB Statement No. 87 is reported as a restatement of beginning net
position as of July 1, 2021.
(5) In fiscal year 2022-23, the City adopted the provisions of GASB Statement Nos. 94 and 96. As restatement of all prior periods is not practical, the cumulative effect of applying GASB Statement Nos. 94 and 96 is reported as a restatement of beginning net
position as of July 1, 2022.
Fiscal Year
-$400,000
-$200,000
$0
$200,000
$400,000
$600,000
$800,000
$1,000,000
$1,200,000
$1,400,000
$1,600,000
$1,800,000
2014 2015 2016 2017 2018 2019 2020 2021 2022 2023
(In Thousands)
Changes in Net Position
Change in
Net Position
Business-type
Activities
Change in
Net Position
Governmental
Activities

CITY AND COUNTY OF SAN FRANCISCO
FUND BALANCES OF GOVERNMENTAL FUNDS
Last Ten Fiscal Years
(Modified Accrual Basis of Accounting)
(In Thousands)
279
2014 2015 2016 2017 2018 2019 2020 2021 2022 2023
General Fund
Nonspendable……………………………………………………..
24,022$ 24,786$ 522$ 525$ 1,512$ 1,259$ 1,274$ 2,714$ 4,134$ 1,174$
Restricted…………………………………………………………..
83,194 114,969 120,106 125,689 143,977 324,977 229,069 114,539 114,539 114,539
Committed………………………………………………………….
145,126 142,815 187,170 327,607 371,698 397,563 363,410 320,637 320,637 330,010
Assigned……………………………………………………………
508,903 705,076 879,567 1,088,288 1,291,499 1,361,787 1,581,761 1,562,035 2,012,745 1,724,903
Unassigned…………………………………………………………
74,317 157,550 241,797 328,594 413,255 631,437 510,408 670,179 453,088 477,511
Total general fund…………………………………………..
835,562$ 1,145,196$ 1,429,162$ 1,870,703$ 2,221,941$ 2,717,023$ 2,685,922$ 2,670,104$ 2,905,143$ 2,648,137$
All other governmental funds
Nonspendable……………………………………………………..
441$ 329$ 82$ 82$ 82$ 140$ 82$ 82$ 124$ 356$
Restricted…………………………………………………………..
1,115,226 1,110,836 1,443,956 1,701,020 2,232,040 2,309,105 2,229,282 3,384,275 3,615,837 3,565,843
Assigned……………………………………………………………
50,733 66,740 66,085 78,413 124,076 114,640 125,319 224,658 259,607 291,062
Unassigned…………………………………………………………
(64,983) (34,158) (103,811) (245,445) (904) (331) (729) (1,920) (1,041) (1,936)
Total other governmental funds……………………………
1,101,417$ 1,143,747$ 1,406,312$ 1,534,070$ 2,355,294$ 2,423,554$ 2,353,954$ 3,607,095$ 3,874,527$ 3,855,325$
Fiscal Year

CITY AND COUNTY OF SAN FRANCISCO
CHANGES IN FUND BALANCES OF GOVERNMENTAL FUNDS
Last Ten Fiscal Years
(Modified Accrual Basis of Accounting)
(In Thousands)
280
2014 2015 2016 2017 2018 2019 2020 2021 2022 2023
Revenues:
Property taxes………………...………………………………….
1,517,261$ 1,642,159$ 1,798,776$ 1,937,694$ 2,171,601$ 2,765,473$ 2,654,937$ 2,964,753$ 2,998,200$ 3,157,038$
Business taxes………..………………………………………….……………………….……………………….
563,406 611,932 660,926 702,331 899,142 919,552 833,931 1,894,604 1,326,675 1,290,918
Sales and use tax.......................................................................................................................
227,636 240,424 267,443 291,710 296,209 329,296 279,453 233,393 293,155 309,385
Hotel room tax.......................................................................................................................
310,052 394,262 387,661 370,344 382,176 408,348 280,970 37,698 174,609 278,961
Utility users tax.......................................................................................................................
86,810 98,979 98,651 101,203 94,460 93,918 94,231 81,367 105,225 110,661
Other local taxes.......................................................................................................................................
391,638 451,994 399,882 542,567 424,187 515,435 474,859 453,829 676,327 564,753
Licenses, permits and franchises……………………………… 42,371 42,959 43,722 44,397 43,180 43,416 38,472 27,186 46,834 43,156
Fines, forfeitures and penalties………………………………… 28,425 28,154 36,169 30,798 34,220 48,896 43,830 74,273 44,581 44,322
Interest and investment income (loss)………………………………..
21,678 20,583 23,931 35,089 45,890 177,832 141,638 10,688 (160,819) 156,887
Rent and concessions………………………………………….. 90,712 99,102 135,865 100,544 105,284 155,346 118,865 76,313 131,450 184,208
Intergovernmental:
Federal…………………………………………………………. 426,314 465,196 416,823 411,369 421,024 442,328 590,697 907,362 1,096,707 635,680
State……………………………………………………………. 721,735 751,574 776,866 823,012 875,402 964,916 990,264 1,105,834 1,207,042 1,293,904
Other…………………………………………………………….
9,408 15,774 85,872 13,814 16,993 13,630 26,483 26,890 20,081 8,938
Charges for services…………………………………………….. 333,904 359,044 392,665 378,437 415,569 437,540 398,405 376,113 397,270 387,553
Other…………………………………………………………….... 134,923 123,605 264,722 188,311 186,034 246,010 214,359 182,826 186,499 207,346
Total revenues………………….…………………………………
4,906,273 5,345,741 5,789,974 5,971,620 6,411,371 7,561,936 7,181,394 8,453,129 8,543,836 8,673,710
Expenditures:
Public protection………………………………………………….
1,172,497 1,210,157 1,269,000 1,323,577 1,378,754 1,460,186 1,551,125 1,576,456 1,644,421 1,749,187
Public works, transportation and commerce…………………. 232,005 293,999 416,152 332,693 441,868 428,378 488,697 458,154 471,415 505,421
Human welfare and neighborhood development………………..
995,192 1,095,419 1,252,588 1,424,425 1,499,216 1,698,081 2,070,388 2,339,937 2,539,914 2,998,446
Community health……………………………………………….. 761,439 753,832 776,612 712,495 815,762 918,330 1,026,915 1,170,730 1,181,711 1,168,603
Culture and recreation……………………………………………
331,914 352,852 364,909 390,038 424,794 453,554 460,157 417,106 464,643 513,127
General administration and finance……………………………. 233,977 251,370 277,729 303,113 312,441 346,154 392,629 395,792 377,185 439,767
Distributions to other governments……………………………. - - - - - - - - 47,296 49,113
General City responsibilities ……………………………………
86,996 98,658 114,684 121,447 110,920 144,808 129,941 113,913 156,870 189,570
Debt service:
Principal retirement……………………………………………
190,266 200,497 252,456 283,356 381,141 326,416 296,875 356,986 439,550 400,960
Interest and other fiscal charges……………………………………
119,142 121,371 119,723 125,091 136,925 168,839 150,646 154,958 173,656 181,463
Bond issuance costs…………………………………………. 2,185 2,734 7,108 2,695 8,934 876 4,455 7,864 3,330 5,747
Payment to refunded bond escrow agent….............................
- - - - - - 8,905 7,167 7,768 -
Capital outlay…………………………………………………….. 449,726 412,740 223,904 297,089 337,741 323,979 454,137 275,638 250,764 220,917
Total expenditures………………………………………………..
4,575,339 4,793,629 5,074,865 5,316,019 5,848,496 6,269,601 7,034,870 7,274,701 7,758,523 8,422,321
Excess of revenues over expenditures………………………
330,934 552,112 715,109 655,601 562,875 1,292,335 146,524 1,178,428 785,313 251,389
Fiscal Year

CITY AND COUNTY OF SAN FRANCISCO
CHANGES IN FUND BALANCES OF GOVERNMENTAL FUNDS (Continued)
Last Ten Fiscal Years
(Modified Accrual Basis of Accounting)
(In Thousands)
281
2014 2015 2016 2017 2018 2019 2020 2021 2022 2023
Other financing sources (uses):
Transfers in…………………………………………………………
563,283 556,287 580,737 641,123 625,147 853,553 701,391 963,647 757,902 702,230
Transfers out……………………………………………………….
(875,296) (1,061,086) (1,251,800) (1,222,163) (1,398,562) (1,654,966) (1,380,325) (1,825,686) (1,626,205) (1,587,557)
Issuance of bonds and loans:
Face value of bonds issued………………………………..
209,955 155,620 472,325 276,570 1,293,595 72,420 393,310 823,665 468,380 267,975
Face value of refunding debt issued …………………………………..
47,220 293,910 123,600 - - - 222,315 161,870 414,205 -
Face value of loans issued……………………………………
8,735 136,763 - 46,000 - - - - - -
Premium on issuance of bonds……………………………….
19,773 69,833 32,845 12,432 76,243 - 73,759 93,427 124,411 6,364
Payment to refunded bond escrow agent……………………………..
(49,055) (359,225) (131,935) - - - (257,675) (193,579) (463,448) -
Proceeds from sale of capital assets……………………………..
- - - 122,000 - - - - - -
Other financing sources - capital leases……………………….
12,869 7,750 5,650 37,736 2,027 - - - - -
Inception of lease and subscriptions…………………………...............................
- - - - - - - - 41,913 72,033
Total other financing sources (uses)……………………………
(62,516) (200,148) (168,578) (86,302) 598,450 (728,993) (247,225) 23,344 (282,842) (538,955)
Special item……………………………………………………….
- - - - 11,137 - - - - -
Net change in fund balances……………………………………
268,418$ 351,964$ 546,531$ 569,299$ 1,172,462$ 563,342$ (100,701)$ 1,201,772$ 502,471$ (287,566)$
Debt service as a percentage of
noncapital expenditures…...…………………………………….
7.61% 7.55% 7.98% 8.46% 9.75% 8.51% 7.06% 7.42% 8.50% 7.39%
Debt service as a percentage of
total expenditures………………………………………………..
6.76% 6.71% 7.33% 7.68% 8.86% 7.90% 6.36% 7.04% 7.90% 6.92%
Fiscal Year

CITY AND COUNTY OF SAN FRANCISCO
ASSESSED VALUE OF TAXABLE PROPERTY
(1)(3)(4)
Last Ten Fiscal Years
(In Thousands)
282
Assessed Value
Exemptions
(2)
Total Taxable Total
Fiscal Real Personal Non-reim- Reim- Redevelopment Assessed Direct
Year Property Property Total bursable bursable Tax Increments Value Tax Rate
2014 …... 179,368,068$ 4,101,609$ 183,469,677$ 7,494,941$ 657,439$ 15,962,884$ 159,354,413$ 1.00%
2015 …... 186,530,855 4,392,133 190,922,988 8,173,599 656,490 15,730,217 166,362,682 1.00%
2016 …... 197,889,670 4,667,489 202,557,159 8,252,472 654,116 15,798,019 177,852,552 1.00%
2017 …... 216,357,277 5,003,459 221,360,736 9,061,126 647,177 17,057,074 194,595,359 1.00%
2018 …... 240,129,959 5,033,413 245,163,372 11,372,719 638,914 20,790,719 212,361,020 1.00%
2019 …... 268,211,395 5,398,846 273,610,241 15,056,415 627,379 21,989,616 235,936,831 1.00%
2020 …... 289,711,888 7,346,098 297,057,986 17,689,802 617,454 23,132,814 255,617,916 1.00%
2021 …... 311,911,097 6,935,352 318,846,449 18,672,211 605,611 21,679,824 277,888,803 1.00%
2022 …... 321,740,412 6,903,321 328,643,733 20,331,278 599,790 22,430,502 285,282,163 1.00%
2023 …... 346,030,954 7,029,571 353,060,525 21,043,071 585,760 21,589,228 309,842,466 1.00%
Source:
Controller, City and County of San Francisco
Notes:
(1) Assessed value of taxable property represents all property within the City. The maximum tax rate is 1% of the full cash value or
$1/$100 of the assessed value, excluding the tax rate for debt service.
(2) Exemptions are summarized as follows:
(a) Non-reimbursable exemptions are revenues lost to the City because of provisions of California Constitution, Article XIII(3).
(b) Reimbursable exemptions arise from Article XII(25) which reimburses local governments for revenues lost through the
homeowners' exemption in Article XIII(3) (k).
(c) Tax increments were allocations made to the former San Francisco Redevelopment Agency under authority of California
Constitution, Article XVI and Section 33675 of the California Health & Safety Code. Actual allocations are limited under an
indebtedness agreement between the City and Redevelopment Agency.
(3)
Does not include SB-813 supplemental property taxes.
(4) Based on year end actual assessed values.

CITY AND COUNTY OF SAN FRANCISCO
DIRECT AND OVERLAPPING PROPERTY TAX RATES
Last Ten Fiscal Years
(Rate Per $100 of Assessed Value)
283
City and County
Direct Rate
(1)
Debt Service
Fund
(2)
San Francisco
Unified School
District
San Francisco
Community
College District
Bay Area
Rapid Transit
District
Total
2014 1.00000000 0.11947956 0.04288739 0.01813305 0.00750000 1.1880
2015 1.00000000 0.11945760 0.03326497 0.01707743 0.00450000 1.1743
2016 1.00000000 0.11346583 0.05246647 0.01407283 0.00260000 1.1826
2017 1.00000000 0.11894004 0.03982180 0.01245918 0.00800000 1.1792
2018 1.00000000 0.10740904 0.04517555 0.01135485 0.00840000 1.1723
2019 1.00000000 0.10748997 0.03869354 0.00982024 0.00700000 1.1630
2020 1.00000000 0.11669015 0.04160439 0.00979486 0.01200000 1.1801
2021 1.00000000 0.11972733 0.04510041 0.01973594 0.01390000 1.1985
2022 1.00000000 0.11463663 0.04503343 0.01681493 0.00600000 1.1825
2023 1.00000000 0.10761763 0.04216026 0.01595993 0.01400000 1.1797
Notes:
(1) Proposition 13 allows each county to levy a maximum tax of $1 per $100 of full cash value. Full cash value
is equivalent to assessed value pursuant to Statutes of 1978, Senate Bill 1656.
(2) On June 6, 1978, California voters approved a constitutional amendment to Article XIIIA of the California
Constitution, commonly known as Proposition 13, that limits the taxing power of California public agencies.
Legislation enacted to implement Article XIIIA (Statutes of 1978, Chapter 292, as amended) provides that
notwithstanding any other law, local agencies may not levy property taxes except to pay debt service on
indebtedness approved by voters prior to July 1, 1978 or any bonded indebtedness for the acquisition or
improvement of real property approved on or after July 1, 1978 by two-thirds of the voting public.
Fiscal
Year
Overlapping Rates
0.90
0.95
1.00
1.05
1.10
1.15
1.20
2014 2015 2016 2017 2018 2019 2020 2021 2022 2023
Property Tax Rate
Fiscal Year
Property Tax Rates
Bay Area Rapid Transit
District
San Francisco
Community College
District
San Francisco Unified
School District
Debt Service Fund (2)
City and County Direct
Rate (1)

CITY AND COUNTY OF SAN FRANCISCO
PRINCIPAL PROPERTY ASSESSEES
Current Fiscal Year and Nine Fiscal Years Ago
(Dollar in Thousands)
284
Type of Business
Taxable
Assessed Value
(1)
Rank
Percentage of
Total Taxable
Assessed
Value
(2)
Taxable Assessed
Value
Rank
Percentage of
Total Taxable
Assessed
Value
(2)
Transbay Towers LLC Office, Commercial 1,837,581$
1 0.56% -$ -
Sutter Bay Hospitals Office, Commercial 1,790,041
2 0.54% - -
GSW Arena LLC Entertainment Complex 1,308,691
3 0.40% - -
Park Tower Owner LLC Office, Commercial 1,118,039
4 0.34% - -
KRE Exchange Owner LLC Office, Commercial 1,103,805
5 0.34% - -
HWA 555 Owners LLC Office, Commercial 1,091,951
6 0.33% 941,010 1 0.52%
Elm Property Venture LLC Office, Commercial 1,056,254
7 0.32% - -
PPF Paramount One Market Plaza Owner LP Office, Commercial 894,928
8 0.27% 770,892 2 0.42%
SHR St. Francis LLC Hotel 770,454
9 0.23% 368,994 8 0.20%
SFDC 50 Fremont LLC Office, Commercial 739,295
10 0.22% - -
Emporium Mall LLC Retail, Commercial - - 430,661 3 0.24%
SPF China Basin Holdings LLC Office, Commercial - - 423,273 4 0.23%
SHC Embarcadero LLC Office, Commercial - - 398,608 5 0.22%
SF Hilton Inc Hotel - - 389,595 6 0.21%
Post-Montgomery Associates Office, Commercial - - 387,267 7 0.21%
Office, Commercial - - 367,384 9 0.20%
Office, Commercial - - 349,062 10 0.19%
Total
11,711,039$ 3.55% 4,826,746$ 2.64%
Source: Assessor, City and County of San Francisco
Notes:
(1) Data for fiscal year 2022-2023 updated as of August 1, 2022.
(2) Assessed values for fiscal years 2022-2023 and 2013-2014 are from the tax rolls of calendar year 2022 and 2013, respectively.
Wells REIT II - 333 Market St LLC
Assessee
Fiscal Year 2023
Fiscal Year 2014
PPF Off One Maritime Plaza LP

CITY AND COUNTY OF SAN FRANCISCO
PROPERTY TAX LEVIES AND COLLECTIONS
(1) (2)
Last Ten Fiscal Years
(In Thousands)
285
Fiscal
Year
Amount
Percentage of
Original Levy
Amount
Percentage of
Adjusted Levy
2014 2,138,245$ 2,113,284$ 98.83% 23,009$ 2,136,293$ 99.91%
2015 2,139,050 2,113,968 98.83 21,166 2,135,134 99.82
2016 2,290,280 2,268,876 99.07 19,156 2,288,032 99.90
2017 2,492,789 2,471,486 99.15 21,966 2,493,452 100.03
2018 2,732,615 2,709,048 99.14 29,002 2,738,050 100.20
2019 2,999,794 2,977,664 99.26 17,194 2,994,858 99.84
2020 3,509,022 3,475,682 99.05 21,020 3,496,702 99.65
2021 3,823,246 3,785,038 99.00 9,800 3,794,838 99.26
2022 3,864,100 3,832,546 99.18 7,066 3,839,612 99.37
2023 4,067,270 4,032,813 99.15 (12,876) 4,019,937 98.84
Source: Controller, City and County of San Francisco
Notes:
(1) Includes San Francisco Unified School District, San Francisco Community College District, Bay Area Rapid
Transit District, Bay Area Air Quality Management District, and the Successor Agency to the San Francisco
Redevelopment Agency.
(2) Does not include SB-813 supplemental property taxes.
(3) Redemption roll collections or prior year reductions of secured annual taxes w ithin the fiscal year. Prior year
reductions occur w hen an exemption gets applied or an Assessment Appeals Board decision reduces
a prior year assessed value.
Collected within the Fiscal Year of
the Levy
Total Collections to Date
Collections in
Subsequent
Years
(3)
Total
Adjusted
Levy
$-
$500,000
$1,000,000
$1,500,000
$2,000,000
$2,500,000
$3,000,000
$3,500,000
$4,000,000
$4,500,000
2014 2015 2016 2017 2018 2019 2020 2021 2022 2023
Property Tax Levies and Collections
Total Adjusted
Levy
Amount
Collected to Date

CITY AND COUNTY OF SAN FRANCISCO
RATIOS OF OUTSTANDING DEBT BY TYPE
Last Ten Fiscal Years
(In Thousands, except per capita amount)
286
Fiscal
Year
General
Obligation
Bonds
Lease
Revenue
Bonds
Certificates
of
Participation
Loans
Leases &
SBITAs
Others
Sales Tax
Revenue
Bonds
Special &
Increment Tax
Bonds
Subtotal
2014 2,105,885$ 243,503$ 544,817$ 27,441$ -$ 3,085$ -$ -$ 2,924,731$
2015 2,096,765 216,527 507,504 163,837 - - - - 2,984,633
2016 2,227,515 197,217 623,956 143,059 - - - - 3,191,747
2017 2,281,894 182,783 582,759 162,876 - 32,586 - - 3,242,898
2018 2,693,252 171,667 987,014 47,462 - 30,654 268,917 - 4,198,966
2019 2,488,987 133,592 944,447 22,365 - 27,102 267,701 - 3,884,194
2020 2,351,707 127,138 1,191,336 21,385 - 23,490 253,566 - 3,968,622
2021 2,754,452 114,309 1,289,507 20,914 - 19,820 239,040 - 4,438,042
2022 2,893,380 100,835 1,250,691 20,418 511,317 16,089 224,114 112,107 5,128,951
2023 2,841,285 86,895 1,205,896 19,900 531,534 12,619 208,774 142,211 5,049,114
Fiscal
Year
Revenue
Bonds and
Revenue
Notes
State of CA -
Revolving
Fund Loans
Certificates of
Participation
Notes,
Loans and
Other
Payables
Leases &
SBITAs
Others
(4)
Subtotal
Total
Primary
Government
Percentage of
Personal Income
(1) (2)
Per Capita
(1) (3)
2014 9,668,418$ -$ 365,867$ 7,596$ -$ 2,512$ 10,044,393$ 12,969,124$ 16.79% 15,214$
2015 10,040,660 - 355,113 7,840 - 1,174 10,404,787 13,389,420 14.95 15,533
2016 10,078,794 - 343,270 8,180 - 266 10,430,510 13,622,257 14.17 15,549
2017 11,185,043 - 330,924 9,241 - - 11,525,208 14,768,106 13.93 16,798
2018 13,194,466 22,607 318,019 14,196 - - 13,549,288 17,748,254 15.37 20,153
2019 14,935,423 88,032 304,547 18,763 - - 15,346,765 19,230,959 16.35 21,815
2020 15,613,982 161,820 274,068 19,692 - - 16,069,562 20,038,184 16.32 23,022
2021 15,995,962 215,966 260,138 19,001 - - 16,491,067 20,929,109 15.97 25,798
2022 16,935,628 424,420 245,609 17,933 235,905 - 17,859,495 22,988,446 17.21 28,436
2023 17,493,248 604,673 230,442 17,163 232,972 985,586 19,564,084 24,613,198 17.93 30,836
Notes:
(1)
See Demographic and Economic Statistics, for personal income and population data.
(2)
2020, 2021 and 2022 were updated from last year's ACFR with newly available data.
(3)
2020, 2021 and 2022 were updated from last year's ACFR with newly available data.
(4)
The "Others" in 2023 consists of CP that were repaid by revenue bonds in FY 2024 and were reclassified as long-term debt.
Governmental Activities
Business-Type Activities
Revenue Bonds and
Revenue Notes
89.41%
State of CA -
Revolving Fund
Loans
3.09%
Certificates of
Participation
1.18%
Others (4)
5.04%
Notes, Loans and
Other Payables
0.09%
Leases & SBITAs
1.19%
Fiscal Year 2023 Business-Type Activities Outstanding Debt
Percentage Breakdown
General
Obligation
Bonds
56.27%
Lease Revenue
Bonds
1.72%
Certificates of
Participation
23.88%
Loans
0.39%
Leases & SBITAs
10.53%
Others
0.25%
Sales Tax Revenue
Bonds
4.14%
Special & Increment
Tax Bonds
2.82%
Fiscal Year 2023 Governmental Activities Outstanding Debt
Percentage Breakdown

CITY AND COUNTY OF SAN FRANCISCO
RATIOS OF GENERAL BONDED DEBT OUTSTANDING
Last Ten Fiscal Years
(In Thousands, except per capita amount)
287
Fiscal
Year
General
Obligation
Bonds
(1)
Less: Amounts
Restricted for
Debt Service
Total
Per
Capita
(2) (3)
Percentage of
Taxable Assessed
Value
(4)
2014 2,105,885$ 95,451$ 2,010,434$ 2,358$ 1.14%
2015 2,096,765 91,292 2,005,473 2,327 1.10%
2016 2,227,515 86,754 2,140,761 2,444 1.10%
2017 2,281,894 111,892 2,170,002 2,468 1.02%
2018 2,693,252 127,766 2,565,486 2,913 1.10%
2019 2,488,987 104,149 2,384,838 2,705 0.92%
2020 2,351,707 118,506 2,233,201 2,566 0.80%
2021 2,754,452 141,107 2,613,345 3,221 0.87%
2022 2,893,380 152,146 2,741,234 3,391 0.89%
2023 2,841,285 160,841 2,680,444 3,358 0.81%
Notes:
(1)
Details regarding the City's outstanding debt can be found in the notes to the financial statements. In compliance
w ith GASB Statement No. 65, the amount for general obligation bonds w as restricted to exclude bond refunding
gains or losses.
(2)
Population data can be found in Demographic and Economic Statistics.
(3)
Fiscal years 2020 ,2021 and 2022 w ere updated from last year's ACFR w ith new ly available data.
(4)
Taxable property data can be found in Assessed Value of Taxable Property. Assessed value used is Total
Assessed Value less Non-reimbursable Exemptions to calculate %.

CITY AND COUNTY OF SAN FRANCISCO
LEGAL DEBT MARGIN INFORMATION
Last Ten Fiscal Years
(In Thousands)
288
Fiscal Year
2014 2015 2016 2017 2018
Debt limit 5,279,242$ 5,482,482$ 5,829,141$ 6,368,988$ 7,013,720$
Total net debt applicable to limit
(1)
2,105,885 2,096,765 2,227,514 2,281,894 2,693,252
Legal debt margin 3,173,357$ 3,385,717$ 3,601,627$ 4,087,094$ 4,320,468$
Total net debt applicable to the limit
as a percentage of debt limit 39.89% 38.24% 38.21% 35.83% 38.40%
Fiscal Year
2019 2020 2021 2022 2023
Debt limit 7,756,615$ 8,381,046$ 9,005,227$ 9,249,374$ 9,960,524$
Total net debt applicable to limit
(1)
2,488,987 2,351,707 2,754,452 2,893,380 2,841,285
Legal debt margin 5,267,628$ 6,029,339$ 6,250,775$ 6,355,994$ 7,119,239$
Total net debt applicable to the limit
as a percentage of debt limit 32.09% 28.06% 30.59% 31.28% 28.53%
Legal Debt Margin Calculation for Fiscal Year 2023
Total assessed value $ 353,060,525
Less: non-reimbursable exemptions
(2)
21,043,071
Assessed value
(2)
$ 332,017,454
Debt limit (three percent of valuation subject to taxation)
(3)
$ 9,960,524
Debt applicable to limit - general obligation bonds
2,841,285
Legal debt margin $ 7,119,239
Notes:
(1)
Per outstanding general obligation bonds adjusted with bond premium and discount.
(2)
Source: Assessor, City and County of San Francisco
(3)
City's Administrative Code Section 2.60 Limitations on Bonded Indebtedness.
"There shall be a limit on outstanding general obligation bond indebtedness of three percent of the assessed value of all
taxable real and personal property, located within the City and County."

CITY AND COUNTY OF SAN FRANCISCO
DIRECT AND OVERLAPPING DEBT
(In Thousands)
289
2022-23 Assessed Valuation: $329,109,288 (includes unitary utility valuation)
GENERAL OBLIGATION BONDED DEBT: Debt 6/30/23
San Francisco City and County General and School Purposes 2,587,798$
San Francisco Unified School District Bonds 1,028,650
San Francisco Community College District 396,900
TOTAL GENERAL OBLIGATION BONDED DEBT 4,013,348$
LEASE OBLIGATION BONDS:
San Francisco City and County 1,420,532$
TOTAL LEASE OBLIGATION BONDED DEBT 1,420,532$
TOTAL COMBINED DIRECT DEBT 5,433,880$
OVERLAPPING TAX AND ASSESSMENT DEBT:
Bay Area Rapid Transit District General Obligation Bonds (34.169%) 848,855$
San Francisco Community Facilities District No. 6 111,563
San Francisco Community Facilities District No. 7 29,945
San Francisco Community Facilities District No. 2009-1, Improvement Areas 1 and 2 2,337
San Francisco Community Facilities District No. 2014-1 Transbay Transit Center 576,115
San Francisco Community Facilities District No. 2016-1 Treasure Island I.A. 1 and 2 83,295
San Francisco Community Facilities District No. 2020-1 Mission Rock 106,230
City of San Francisco Assessment District No. 95-1 260
ABAG Community Facilities District No. 2004-1 Seismic Safety Improvements 8,530
ABAG Community Facilities District No. 2006-1 San Francisco Rincon Hill 4,655
ABAG Community Facilities District No. 2006-2 San Francisco Mint Plaza 2,685
TOTAL OVERLAPPING TAX AND ASSESSMENT DEBT 1,774,470$
OVERLAPPING TAX INCREMENT DEBT:
Successor Agency to the San Francisco Redevelopment Agency 757,038$
Transbay Joint Powers Authority 234,035
TOTAL OVERLAPPING INCREMENT DEBT 991,073$
OVERLAPPING TAX INCREMENT REVENUE DEBT:
San Francisco Infrastructure and Revitalization Financing District No. 1 29,390$
TOTAL OVERLAPPING TAX INCREMENT REVENUE DEBT 29,390$
TOTAL DIRECT AND OVERLAPPING BONDED DEBT 8,228,813$
(1)
(1) Excludes tax and rev enue anticipation notes, enterprise revenue bonds and airport improv ement corporation bonds
Ratios to 2022-23 Assessed Valuation ($329,109,288):
Direct General Obligation Bonded Debt ($4,013,348) 1.22%
Combined Direct Debt ($5,433,880) 1.65%
Total Direct and Overlapping Bonded Debt 2.50%
Ratio to 2022-23 Redevelopment Incremental Valuation ($42,244,048):
Total Overlapping Tax Increment Debt 2.35%
Source: California Municipal Statistics, Inc

CITY AND COUNTY OF SAN FRANCISCO
PLEDGED-REVENUE COVERAGE
Last Ten Fiscal Years
(In Thousands)
290
Fiscal Operating
Less:
Operating
Net
Available
Year Revenues
(2)
Expenses
(3)
Revenue Principal Interest Total Coverage
2014 776,116$ 402,176$ 373,940$ 163,095$ 202,219$ 365,314$ 1.02
2015 824,482 392,361 432,121 181,645 211,804 393,449 1.10
2016 880,948 412,114 468,834 208,860 185,297 394,157 1.19
2017 934,692 543,019 391,673 194,225 210,330 404,555 0.97
2018 1,075,118 505,018 570,100 201,295
(4)
204,046
(4)
405,341 1.41
2019 1,072,368 495,222 577,146 214,710
(4)
221,749
(4)
436,459 1.32
2020 1,031,129 618,954 412,175 210,595 268,573 479,168 0.86
2021 540,309
(4)
583,250 (42,941) 5,600 284,661 290,261 -0.15
2022 843,926 453,181 390,745 5,860 282,749 288,609 1.35
2023 1,127,161 547,275 579,886 1,240 407,421 408,661 1.42
(1) The pledged-revenue coverage calculations presented in this schedule conform to the requirements of GASB
Statement No. 44 and as such differ significantly from those calculated in accordance with the Airport Commission's
1991 Master Bond Resolution which authorized the sale and issuance of these bonds.
(2)
Operating revenues consist of Airport operating revenues and interest and investment income.
(3) In accordance with GASB Statement No. 44, Airport operating expenses related to the pledged revenues exclude
interest, depreciation and amortization.
(4) Principal and interest payments were updated in FY2018 through FY2019. Operating Revenue was updated FY2021.
Fiscal Gross
Less:
Operating
Net
Available
Year Revenues
(6)
Expenses
(7)
Adjustments
(9)
Revenue Principal Interest
(8)
Total Coverage
2014 390,789$ 333,555$ 426,527$ 483,761$ 25,850$ 115,476$ 141,326$ 3.42
2015 431,836 296,950 310,139 445,025 25,850 166,462 192,312 2.31
2016 423,111 314,786 283,568 391,893 29,695 189,500 219,195 1.79
2017 464,662 421,827 351,605 394,440 41,310 166,502 207,812 1.90
2018 532,087 370,147 337,643 499,583 48,875 185,084 233,959 2.14
2019 558,041 357,094 332,034 532,981 76,665 184,973 261,638 2.04
2020 593,868 398,117 386,127 581,878 100,970 168,240 269,210 2.16
2021 581,141 448,690 335,287 467,738 76,440 171,987 248,427 1.88
2022 565,317 401,612
(10)
246,741 410,446 108,500 170,852 279,352 1.47
2023 705,443 438,837 300,158 566,764 125,285 181,777 307,062 1.85
(5) The pledged-revenue coverage calculations presented in this schedule conform to the requirements of GASB
Statement No. 44 and as such differ significantly from those calculated in accordance with the bond indenture.
(6) Gross Revenues consist of charges for services, rental income and other income, investing activities and capacity fees.
(7) In accordance with GASB Statement No. 44, Water Department operating expenses related to the pledged revenues
exclude interest. FY2019 was updated with new available data.
(8)
(9)
(10)
Fiscal
Gross
Pledged -
Less:
Operating
Net
Available
Year Charges
(11)(12)
Expenses
(13)
Revenue Principal Interest Total Coverage
2014 642,614$ 509,762$ 132,852$ 5,895$ 3,686$ 9,581$ 13.87
2015 626,312 527,125 99,187 7,695 6,945 14,640 6.78
2016 619,650 563,750 55,900 7,340 9,155 16,495 3.39
2017 614,619 572,162 42,457 7,640 8,865 16,505 2.57
2018 652,919 587,355 65,564 12,350 15,602 27,952 2.35
2019 686,346 576,970 109,376 10,055 14,636 24,691 4.43
2020 764,755 666,018 98,737 10,545 14,261 24,806 3.98
2021 793,328 598,342 194,986 9,150 14,176 23,326 8.36
2022 726,203 575,068 151,135 3,520 14,160 17,680 8.55
2023 692,706 656,124 36,582 8,865 13,973 22,838 1.60
(11) The gross revenues consist of transit fares, parking fines and fees, rental income, advertising revenue, investment income,
parking meter revenues (but only to the extent bonds or other parity obligations have financed traffic regulation and control
functions), plus operating grants from Transportation Development Act (codified as Sections 99200 et seq. of the California
Public Utilities Code), AB 1107 (codified at Section 29140 et seq. of the Public Utilities Code), and State Transit Assistance
except for a portion that are restricted to application for paratransit purpose and therefore do not constitute pledged revenues.
(12) FY2020 to FY2022 gross revenues include federal pandemic support and effective FY2021 include amounts received from proceeds
of the Traffic Congestion Mitigation Tax levied by the City pursuant to the City’s Traffic Congestion Mitigation Tax Ordinance
(Article 32 of the City’s Business and Tax Regulations Code).
(13) The operating expenses exclude expenses funded by the City's General Fund support and paratransit restricted grants. In accordance
with GASB Statement No. 44, operating expenses related to the pledged revenues exclude interest, depreciation, amortization and
non-cash expenses.
Debt Service
Interest payment was restated to exclude capitalized interest and includes "springing" amendments.
Municipal Transportation Agency
San Francisco International Airport
(1)
San Francisco Water Department
(5)
Adjustments column included adjustment to investing activities, depreciation and non-cash expenses, changes in working capital
and other available funds presented in the published Annual Disclosure Reports.
Debt Service
Debt Service
Operating Expenses were updated in FY2022.

CITY AND COUNTY OF SAN FRANCISCO
PLEDGED-REVENUE COVERAGE (Continued)
Last Ten Fiscal Years
(In Thousands)
291
Fiscal Gross
Less:
Operating
Net
Available
Year Revenues
(15)
Expenses
(16)
Adjustments
(17)
Revenue Principal Interest
(18)
Total Coverage
2014 262,497$ 216,340$ 172,831$ 218,988$ 32,805$ 32,047$ 64,852$ 3.38
2015 257,209 216,485 190,236 230,960 30,895 30,006 60,901 3.79
2016 262,960 221,553 198,524 239,931 31,115 28,907 60,022 4.00
2017 279,668 244,220 216,095 251,543 20,870 39,537 60,407 4.16
2018 317,413 238,906 231,515 310,022 20,015 26,988 47,003 6.60
2019 351,782 259,813 161,677 253,646 22,435 37,912 60,347 4.20
2020 356,265 262,259 287,798 381,804 23,324 39,475 62,799 6.08
2021 325,008 290,737 271,906 306,177 25,698 56,367 82,065 3.73
2022 360,756 255,010 205,089 310,835 25,363 61,257 86,620 3.59
2023 365,667 254,283 202,059 313,443 36,826 61,985 98,811 3.17
(14) The pledged-revenue coverage calculations presented in this schedule conform to the requirements of GASB
Statement No. 44 and as such differ significantly from those calculated in accordance with the bond indenture.
(15)
(16) In accordance with GASB Statement No. 44, Wastewater Enterprise operating expenses related to the pledged
revenues exclude interest. FY2018 was updated with new available data.
(17) Adjustments include depreciation and non-cash expense, changes in working capital, investment income, SRF loan payments,
(18)
Fiscal
Total
Operating
Less:
Operating
Net
Available
Year Revenues
(20)
Expenses
(21)
Revenue Principal Interest Total Coverage
2014 87,213$ 63,410$ 23,803$ 725$ 2,122$ 2,847$ 8.36
2015 96,265 60,896 35,369 1,400 2,771 4,171 8.48
2016 100,699 64,896 35,803 1,225 2,951 4,176 8.57
2017 114,854 89,882 24,972 1,265 2,904 4,169 5.99
2018 111,999 79,027 32,972 1,325 2,849 4,174 7.90
2019 128,222 87,500 40,722 1,390 2,787 4,177 9.75
2020 108,454 89,544 18,910 1,455 2,718 4,173 4.53
2021 89,734 112,283 (22,549) 1,660 1,615 3,275 -6.89
2022 122,777 79,567 43,210 1,705 1,569 3,274 13.20
2023 137,056 97,880 39,176 1,745 1,529 3,274 11.97
(19) The pledged-revenue coverage calculations presented in this schedule conform to the requirements of GASB
Statement No. 44 and as such differ significantly from those calculated in accordance with the bond indenture.
(20) Total revenues consist of operating revenues and interest and investment income.
(21)
Fiscal
(26)
Gross
Less:
Operating
Net
Available
Year Revenues
(23)
Expenses
(24)
Adjustments
(25)
Revenue Principal Interest Total Coverage
2014 105,767$ 101,041$ 11,726$ 16,452$ 1,308$ 667$ 1,975$ 8.33
2015 117,704 105,222 38,714 51,196 1,321 625 1,946 26.31
2016 122,954 110,012 20,102 33,044 - - -
2017 122,187 116,935 58,176 63,428 - - -
2018 122,251 119,395 64,356 67,212 710 1,860 2,570 26.15
2019 152,873 122,687 40,827 71,013 730 1,839 2,569 27.64
2020 151,835 148,127 76,853 80,561 755 1,813 2,568 31.37
2021 142,696 139,566 31,048 34,178 785 1,782 2,567 13.31
2022 176,897 142,716 64,445 98,626 815 3,602 4,417 22.33
2023 208,887 181,769 135,281 162,399 850 6,847 7,697 21.10
(22) The pledged-revenue coverage calculations presented in this schedule conform to the requirements of GASB
Statement No. 44 and as such differ significantly from those calculated in accordance with the bond indenture.
(23) Gross revenues consists of charges for power services, rental income and other income.
(24) Operating expenses only include power operating expense.
(25) Adjustments include adjustments to investment income, depreciation, non-cash items and changes to working capital. FY2020 was revised
with new data.
(26) For FY2016 and FY2017 revenue bond debt service excludes state revolving fund loans, commercial paper and certificates of participation.
San Francisco Wastewater Enterprise
(14)
and other available funds that are printed in published Annual Disclosure Reports. FY2018 was updated with new available data.
Gross revenues consist of charges for services, rental income and other income.
Interest payment was restated to exclude capitalized interest and includes a "springing" amendment.
Hetch Hetchy Water and Power
(22)
Debt Service
In accordance with GASB Statement No. 44, operating expenses related to the pledged-revenue stream exclude interest,
depreciation and amortization. Details regarding outstanding debt can be found in the notes to the financial statements.
Operating expenses, as defined by the bond indenture, also excludes amortized dredging costs. FY2019 - 2023 Operating
expenses exclude South Beach Harbor fund.
Debt Service
Port of San Francisco
(19)
Debt Service
(26)

CITY AND COUNTY OF SAN FRANCISCO
DEMOGRAPHIC AND ECONOMIC STATISTICS
Last Ten Fiscal Years
292
Fiscal
Year
Population
(1)
Personal Income
(In Thousands)
(2)
Per Capita
Personal
Income
(3)
Median
Age
(4)
Public School
Enrollment
(5)
Average
Unemployment
Rate
(6)
2014
852,469 $77,233,279 $90,600 37.4 57,860 5.2%
2015
862,004 89,533,450 103,867 37.8 58,414 4.0%
2016
876,103 96,161,308 109,760 37.9 58,865 3.4%
2017
879,166 106,006,635 120,576 38.1 60,133 3.1%
2018
880,696 115,444,581 131,083 38.1 60,263 2.6%
2019
881,549 117,635,944 133,442 38.3 60,390 2.3%
2020
870,393 122,788,484
(8)
141,072
(9)
38.2 61,031 4.8%
2021
811,253 131,043,138
(8)
161,532
(9)
38.2 59,498 6.9%
2022
808,437 133,601,151
(8)
165,259
(9)
38.5 55,592 3.3%
2023
798,206
(7)
137,238,298
(8)
169,758
(9)
38.9
(10)
55,537 2.7%
Sources:
(1)
(2) US Bureau of Economic Analysis. Fiscal years 2020, 2021, and 2022 w ere updated from last year's ACFR w ith newly available data.
(3) US Bureau of Economic Analysis. Fiscal years 2020, 2021, and 2022 w ere updated from last year's ACFR w ith newly available data.
(4) US Census Bureau, American Community Survey
(5) California Department of Education
(6) California Employment Development Department
Note:
(7) 2023 population w as estimated by multiplying the estimated 2022 population by the 2020 - 2021 population grow th rate.
Fiscal years 2020. 2021 and 2022 w ere updated from last year's ACFR w ith newly available data.
(8) Personal income was estimated by assuming that its percentage of state personal income in 2021 and 2022
remained at the 2021 level of 4.44 percent. Fiscal years 2020. 2021 and 2022 w ere updated from last year's ACFR w ith new ly
available data.
(9)
Per capita personal income for 2023 w as estimated by dividing the personal income for 2023 by the reported population in 2022.
Fiscal years 2020, 2021 and 2022 are updated from last year's ACFR w ith newly available data. 2023 was estimated by multiplying the
latest quarterly State income by 1000 and dividing by the estimated 2022 population.
(10) Median age for 2023 was estimated by averaging the median age in 2021 and 2022.
US Census Bureau. Fiscal years 2020, 2021, and 2022 w ere updated from last year's ACFR w ith new ly available data.
760000
780000
800000
Population
52000
54000
56000
58000
60000
62000
64000
Public School Enrollment
0.0%
2.0%
4.0%
6.0%
8.0%
Average Unemployment Rate
760,000
780,000
800,000
820,000
840,000
860,000
880,000
900,000
Population
$0
$20,000
$40,000
$60,000
$80,000
$100,000
$120,000
$140,000
$160,000
$180,000
Per Capita Personal Income
52,000
54,000
56,000
58,000
60,000
62,000
Public School Enrollment
0.0%
2.0%
4.0%
6.0%
8.0%
Average Unemployment Rate

CITY AND COUNTY OF SAN FRANCISCO
Principal Employers
Current Year and Nine Years Ago
293
Employees Rank Employees Rank
City and County of San Francisco.....………...…………
35,802
1 6.38% 25,458 1
University of California, San Francisco
(b)
…………………
29,500
2 5.26% 22,664 2
Salesforce….........................................................
10,603
3 1.89% 4,000 9
San Francisco Unified School District…………………..
10,322
4 1.84% 8,189 5
Sutter Health……………………………………………..
6,100
5 1.09% - -
Wells Fargo & Co…………………………………………..
5,899
6 1.05% 8,300 4
Uber Technologies Inc………………………………………..
5,500
7 0.98% - -
Allied Universal…................................................
4,095
8 0.72% - -
Kaiser Permanente…..........................................
3,921
9 0.70% 3,581 10
First Republic Bank….........................................
3,042
10 0.54%
PG&E Corporation…..........................................................
-
- - 4,415 7
California Pacific Medical Center…………………….
-
-
- - 8,559 3
Gap, Inc…..........................................................
-
-
- - 6,000 6
State of California…………………………………………..
-
-
- - 4,184 8
Total Top 10 Employers………………………………………………………..
114,784 20.45% 95,350
Total City and County Employment
(3)
………………………………………………………..
561,308 477,650
Source:
(1)
(2) FY 2011-12 Annual Comprehensive Financial Report - City and County of San Francisco
(3) State of California Employee Development Department
Note:
(a)
(b)
(c)
The calendar year-end 2022 data is not available
4.74%
The latest data as of calendar year-end 2021 is presented
The latest data as of April 2021 is presented
City and County of San Francisco data provided by Office of Controller's Payroll and Personnel Services Division. The University of California, SF data is
from the Data Source Corporate Personnel Data Warehouse. All other data is obtained from the San Francisco Business Times Book of Lists
19.96%
0.75%
0.92%
-
1.79%
1.26%
0.88%
-
Year 2021
(1)(a)(c)
Year 2012
(2)
Employer
Percentage
of Total City
Employment
Percentage
of Total City
Employment
5.33%
0.84%
1.71%
1.74%
-

CITY AND COUNTY OF SAN FRANCISCO
FULL-TIME EQUIVALENT CITY GOVERNMENT EMPLOYEES BY FUNCTION
(1)
Last Ten Fiscal Years
294
Function 2014
2015
(2)
2016
(2)
2017 2018 2019
(3)
2020 2021 2022 2023
Public Protection
Fire Department……………………………………...………………
1,464 1,494 1,575 1,620 1,646 1,667 1,677 1,641 1,678 1,801
Police…………………………………………………………………… 2,727 2,784 2,871 3,013 2,971 3,053 3,203 3,048 2,881 2,849
Sheriff……………………………………………………………….
984 1,015 1,006 1,056 1,001 1,020 1,031 1,008 1,000 1,002
Other……………………………………………………………………. 1,032 1,049 1,077 1,081 1,138 1,146 1,161 1,131 1,154 1,163
Total Public Protection………………………………………………
6,207 6,342 6,529 6,770 6,756 6,886 7,072 6,828 6,713 6,815
Public Works, Transportation and Commerce
Municipal Transportation Agency………………………………….. 4,484 4,685 4,931 5,160 5,178 5,338 5,477 5,520 5,584 5,806
Airport Commission………………………………………………… 1,460 1,473 1,493 1,541 1,586 1,587 1,592 1,610 1,601 1,584
Department of Public Works……………………………………….. 825 852 925 981 1,027 1,057 1,071 1,063 1,050 546
Public Utilities Commission……………………………………….
1,621 1,618 1,634 1,637 1,648 1,676 1,690 1,667 1,708 1,718
Other……………………………………………………………………. 612 626 627 637 631 621 626 607 604 633
Total Public Works, Transportation and Commerce…………. 9,002 9,254 9,610 9,956 10,070 10,279 10,456 10,467 10,547 10,287
Community Health
Public Health………………………………………………………. 6,126 6,284 6,602 6,806 6,857 6,866 6,886 7,161 7,359 7,739
Total Community Health……………………………………….. 6,126 6,284 6,602 6,806 6,857 6,866 6,886 7,161 7,359 7,739
Human Welfare and Neighborhood Development
Human Services…………………………………………………….
1,855 1,964 2,046 2,068 2,099 2,094 2,141 2,160 2,204 2,250
Other………………………………………………………………… 244 246 242 375 386 394 411 426 499 596
Total Human Welfare and Neighborhood Development……….. 2,099 2,210 2,288 2,443 2,485 2,488 2,552 2,586 2,703 2,846
Culture and Recreation
Recreation and Park Commission………………………………. 870 893 916 935 934 927 940 912 925 947
Public Library………………………………………………………. 652 661 662 683 698 696 701 700 700 707
War Memorial……………………………………………………….
57 58 65 68 69 71 71 62 67 68
Other………………………………………………………………………..
213 214 215 211 214 213 212 200 198 202
Total Culture and Recreation……………………………………
1,792 1,826 1,858 1,897 1,915 1,907 1,924 1,874 1,890 1,923
General Administration and Finance
Administrative Services…………………………………………….. 716 750 803 830 845 871 917 913 962 979
City Attorney…………………………………………………………. 308 308 306 307 307 309 310 310 311 320
Telecommunications and Information Services……………………. 216 209 221 228 232 225 220 224 229 252
Controller…………………………………………………………… 204 219 253 263 257 251 250 248 251 249
Human Resources……………………………………………………… 135 143 152 155 148 166 172 177 203 193
Treasurer/Tax Collector…………………………………………….
211 226 219 219 207 207 208 205 198 207
Mayor……………………………………………………………….
49 50 55 56 58 63 78 76 81 82
Other……………………………………………………………………
602 615 658 695 697 699 738 709 734 731
Total General Administration and Finance………………………. 2,441 2,520 2,667 2,753 2,751 2,791 2,893 2,862 2,969 3,013
General City Responsibilities
General City Responsibilities……………………………………… - - - - - - 1 - - -
Subtotal annually funded positions……………………………………….
27,667 28,436 29,554 30,625 30,834 31,217 31,784 31,778 32,181 32,624
Capital project funded positions………..……………………………
1,569 1,721 1,789 2,124 2,211 2,300 2,409 2,441 2,513 2,698
Total annually funded positions…………………………………… 29,236 30,157 31,343 32,749 33,045 33,517 34,193 34,219 34,694 35,322
Source: Controller, City and County of San Francisco
Note:
(1)
Data represent budgeted and funded full-time equivalent positions.
(2) 2015 and 2016 has been updated with newly available data.
(3) 2019 has been updated with newly available data.
Fiscal Year

CITY AND COUNTY OF SAN FRANCISCO
OPERATING INDICATORS BY FUNCTION
Last Ten Fiscal Years
295
Function 2014 2015 2016 2017 2018 2019 2020 2021 2022 2023
Public Protection
Fire and Emergency Communications
Total response time, measured in seconds, of first unit to highest priority
incidents requiring possible medical care, 90th percentile ...….……..……
510 492 461 460 474 475 489 515 515 524
Police
Median Response Time to Priority A (Highest Priority) Calls (Minutes,
Call Entry to On-Scene)
(1)
…......................................................... N/A N/A N/A N/A N/A N/A 5.48 5.81 6.64 6.85
Number of homicides per 100,000 population ………………………………………..
4.70 6.60 6.20 7.90 4.90 5.10 4.75 6.00 6.20 6.60
Public Works, Transportation, and Commerce
General Services Agency - Public Works
Percentage of San Franciscans who rate cleanliness of neighborhood
streets as good or very good (Biennial City Survey)……………………………………………….
N/A 54% N/A 51% N/A N/A N/A N/A N/A 31%
Number of blocks of City streets repaved……………………………………..
323 474 721 704 608 664 438 415 504 507
Municipal Transportation Agency
Customer rating: Overall satisfaction with Muni ….......................……………………………………….......
N/A N/A N/A N/A N/A N/A N/A N/A N/A 66.0%
Muni on-time performance….......................……………………………………….......
58.8% 56.1% 59.9% 57.3% 56.5% 55.2% 52.3% 47.0% 50.9% 56.5%
Percentage of scheduled service hours delivered …………………………….
90.70% 97.00% 99.00% 98.90% 97.50% 94.30% N/A 90.00% 92.50% 98.30%
Airport
Percent change in air passenger volume………………………………………….
3.2% 4.5% 6.7% 4.9% 7.0% -0.1% -29.3% -59.5% 155.1% 20.0%
Culture and Recreation
Recreation and Park
Citywide average park score…………………………………………………………
91% 85% 87% 89% 89% N/A 92% N/A 90% 91%
Public Library
How patrons rate the quality of library staff assistance at the Main
and Branch libraries and Bookmobiles on a scale of 1-10…………………………………….
N/A 92% 8.30 7.30 8.30 8.70 N/A N/A N/A N/A
Circulation of materials at San Francisco libraries
(2)
………………………
10,844,953 10,684,760 10,778,428 10,814,015 11,092,406 11,730,624 10,924,062 8,359,441 N/A 12,530,166
Asian and Fine Arts Museums
Number of visitors to City-owned art museums
(3)
...……………………….
2,042,135 1,712,076 1,830,284 1,730,378 1,678,682 1,601,223 809,076 355,224 947,742 1,565,583
Source: Controller, City and County of San Francisco
Notes:
(1) FY2014 through FY2019 median response date is not available. FY2020 through FY2023 reflects, in a decimal format, the time from the entry of a 911 call's information to the officer's arrival time.
(2) The “Circulation of materials at San Francisco Libraries” measure is the sum of the “Circulation of eBooks and eMedia” and “Circulation of physical books and materials” measures.
(3) The "Number of visitors to City-owned art museums” measure is the sum of the “Number of museum visitors (AAM)”, “Number of de Young visitors (FAM)”, and “Number of Legion of Honor visitors (FAM) measures.
N/A = Information is not available. Note that in most cases this is due to the fact that the City Survey, which was administered annually until CY2005, then biennially afterwards, is the data source.
Fiscal Year

CITY AND COUNTY OF SAN FRANCISCO
CAPITAL ASSET STATISTICS BY FUNCTION
Last Ten Fiscal Years
296
Function 2014 2015 2016 2017 2018 2019 2020 2021 2022 2023
Police protection
(1)
Number of stations………………………………..
10 10 10 10 10 10 10 10 10 10
Number of police officers……………………………….
2,130 2,203 2,332 2,315 2,292 2,291 2,267 2,185 2,023 1,881
Fire protection
(2)
Number of stations……………………………………
46 47 47 47 47 47 47 47 47 45
Number of firefighters…………………………….
896 907 995 1,029 1,044 1,040 1,024 954 967 1,008
Public works
Miles of street
(3)
…………………………………..
1,299 1,287 1,287 1,287 1,287 1,304 1,372 1,404 1,407 1,407
Number of streetlights
(4)
…………………………..
44,656 44,907 44,498 44,686 44,891 44,832 44,631 42,737 43,202 43,205
Water
(4)
Number of services…………………………………..
173,970 174,111 174,083 174,394 175,054 175,805 176,379 176,246 177,072 177,613
Average daily
consumption (million gallons)………………………..……….
217 190 171 175 190 185 191 189 181 170
Miles of water mains………………………………..
1,488 1,499 1,489 1,488 1,489 1,719 1,719 1,719 1,719 1,719
Sewers
(4)
Miles of collecting sewers and
transport/storage sewers….................... 1,010 1,010 1,010 1,010 1,010 1,010 1,123 1,125 1,131 1,131
Recreation and cultures
Number of parks
(5)
…………………………………
221 220 220 220 220 220 221 221 222 222
Number of libraries
(6)
………………………………..
28 28 28 28 28 28 28 28 28 28
Number of library
volumes (million)
(6)
…………………………………
3.6 3.6 3.8 3.9 3.7 3.5 3.9 3.5 4.4 4.9
Public school education
(7)
Attendance centers………………………………..
116 116 117 117 117 117 122 122 122 122
Number of classrooms……………………………….
3,135 3,160 3,219 3,219 3,219 3,216 3,216 3,215 3,215 3,208
Number of teachers,
full-time equivalent……………………………………….….
3,129 3,281 3,339 3,272 3,196 3,886 3,518 3,419 3,808 3,351
Number of students………………………………….
57,620 58,414 58,865 60,133 60,263 60,390 61,031 58,705 55,592 48,785
Sources:
(1)
Police Commission, City and County of San Francisco
(2) Fire Commission, City and County of San Francisco - Includes fire fighters/paramedics, and incident support specialists
(3) Department of Public Works, City and County of San Francisco
(4) Public Utilities Commission, City and County of San Francisco. Combining miles of collecting and transport/storage sewers
(5) Parks and Recreation Commission, City and County of San Francisco
(6) Library Commission, City and County of San Francisco
(7)
San Francisco Unified School District
Fiscal Year
