
Outcome Measure Toolkit
for Geriatric Fall/Balance Assessment
1
Table of Contents
Introduction ------------------------------------------------------------------------------------------------------------------------- 2
Background of the Outcome Measure Toolkit Project ---------------------------------------------------------------------------------- 3
Taskforce Members ------------------------------------------------------------------------------------------------------------------------- 5
Outcome Measure Toolkit Project Searching Key Words and Database ----------------------------------------------------------- 6
Outcome Measure Toolkit Project Search/Review Flow Chart -------------------------------------------------------------------------- 8
Master List of Outcome Measures Assessing Balance/Fall Risk Being Reviewed ------------------------------------------- 9
Outcome Measures with Evidence of Psychometric Properties and Fall Risk Predictability ---------------------------------- 12
Outcome Measures Not Supported in Relation to Balance/Fall Assessment in the Older Adult Population and Rationales ----- 13
Outcome Measures Related to Balance/Fall Risk Assessment but Warranting Additional Research for Further Validation ---- 15
Outcome Measures Widely Used, but With Limited Recent Evidence Related to Fall Risks ---------------------------------- 18
Outcome Measures Divided by Setting ----------------------------------------------------------------------------------------------- 20
Summary Tables of Each Individual Outcome Measure (in alphabetic order) -------------------------------------------------- 26
Discussion ------------------------------------------------------------------------------------------------------------------------------ 121
Appendix
a. Compiled List of Outcome Measures Found During Phase 1 Search ------------------------------------------------ 122
b. Outcome Measure Toolkit Project Article Review Instructions -------------------------------------------------------- 126
c. Outcome Measure Summary Table Template ----------------------------------------------------------------------- 127

2
Introduction
November 2019
Dear fellow therapists:
Welcome to the Outcome Measure Toolkit. I am excited to present this document to you. The Outcome Measure Toolkit project
is a product of the Balance & Falls Special Interest Group (BFSIG) of APTA Geriatrics, an Academy of the American Physical
Therapy Association (APTA).
Falls are the most common cause of injuries and hospital admissions in older adults, and balance is a potentially modifiable
factor known to contribute to falls—choosing proper tests and measures is a critical component of balance and fall risk
assessment. Evidence-based interventions can then be implemented to improve participation, activity limitations, and
impairments of body structure and function for people with balance deficits and risks of falling. In recent decades, an enormous
amount of outcome measures have been developed to evaluate balance and to predict fall risk. As fall risks and balance
assessments are multidimensional and multifaceted, selecting the optimal outcome measure is challenging.
The BFSIG decided to take on the challenge to create the Outcome Measures Toolkit, providing our members with an updated
summary of current outcome measures related to balance and fall risk assessment. As the BFSIG Research Liaison, I am
humbled and honored to lead the project.
The Outcome Measure Toolkit took over two years to ready itself; fourteen taskforce members volunteered their time, effort,
and knowledge to make this project possible. We started using keywords to search related outcome measures. The original
compiled list had over 245 outcome measures! After multiple conferences, discussions, and endless hours of hard working, we
now present you with the final list of 107 outcome measures. We hope you find this Toolkit helpful, clinically and
academically. For this Toolkit to remain current, the list needs to be updated every three to five years. We hope to see more
volunteers devote themselves to updating this project in the future. Your participation and contribution help the BFSIG grow
and expand!
Sincerely,
Elizabeth Wang-Hsu, PT, PhD
Elizabeth Wang-Hsu, PT, PhD
Chair, the Outcome Measure Toolkit Project
Research Liaison, Balance and Fall Special Interest Group
University of Pennsylvania Health System
3
Background of the Outcome Measure Toolkit Project
• Purposes:
1. Create an updated summary in the form of an Outcome Measure Toolkit for balance and fall
assessment, including the psychometric properties, fall predictability, population validated, and
references of each outcome measure in a simple, easy to understand table format.
2. Provide all APTA Geriatrics members a toolkit to easily access current and existing BF outcome
measures, with their psychometric properties and fall predictability in the geriatric population at various
settings or with different diagnosis.
• Process and Phases of the Project:
The project was initiated immediately after CSM 2017. Originally, 8 members from BFSIG
volunteered to form the taskforce for this project. A few members withdrew from the project due to
various personal reasons, but new members joined the project. The taskforce members in various stages
are acknowledged in the following page.
The project was conducted in five phases:
Phase 1 was finding combinations of key words used to thoroughly search for any existing outcome
measures that are appropriate for balance and fall assessment. From this search, 260 outcome
measures were identified. The results were then streamlined to make a consensus master list of 107
outcome measures.
Phase 2 was the literature review process. The master list of outcome measures was assigned to
taskforce members to review. Each member in each timeline was assigned 3 to 5 outcome measures.
Phone conferences were held between each timeline to discuss issues and concerns from taskforce
members.
Phase 3 was cross-validation and recommendations.
Phase 4 was updating of literature from 2018-2019.
Phase 5 was formatting of the BFSIG Outcome Measure Toolkit and dissemination.
4
• The Outcome Measure Toolkit is a toolkit based on consensus opinion of experts from the BFSIG. It is a
resource/toolkit for members but should not be confused or mistaken for peer-reviewed evidence-based
document. The BFSIG Outcome Measure Toolkit seeks to offer a quick summary with generalizability, as
well as various practice settings, in addition to community-dwelling. Furthermore, the emphasis of this
project was placed on current literature in the past 5 or so years. This allows us to make recommendations
on outcome measures which may no longer be valid with the changing features of the human population
including the prevalence rate of medical comorbidities, life expectancy, and medical advances.

5
Taskforce Members
The APTA Geriatrics Balance & Fall Special Interest Group would like to recognize and extend its
gratitude to the taskforce members, who volunteered their time, effort, and knowledge to this project.
Elizabeth Wang-Hsu, PT, PhD (Chair)
Research Liaison for APTA Geriatrics Balance and Falls SIG 2016-2019
Heidi Moyer*†, PT, DPT (Co-Chair for the initial phases)
Secretary, APTA Geriatrics Balance and Falls SIG
Eastern Regional Coordinator, APTA Geriatrics State Advocate Program
Carmen Casanova Abbott, PT, PhD (Co-Chair for the final phases)
Core Taskforce Members
Anne Reilley*, PT, DPT, MS
Susan Glenney*†, PT, DPT
Mariana Wingood*†, PT, DPT
Adjunct Taskforce Members
Ryan Allison, PT, DPT
Harsha Dhingra†, PT, MS
Emma Phillips, PT, DPT
Haim Nesser†,
PT, DPT
Paula Graul*†, PT, MS
Shweta Subramani†, PT, MHS
Ashley Bell, PTA
Jennifer Vincenzo*, PT, MPH, PhD (Chair, BFSIG)
* Board Certified Clinical Specialist in Geriatric Physical Therapy (GCS)
† Certified Exercise Expert for Aging Adults (CEEAA)

6
Outcome Measure Toolkit Project Searching Key Words and Database
Combination of Words:
Falls, Fall Risk, Balance, Functional Mobility, Strength, Older Adults, Aged, Geriatric, Elderly, Frail, Community-Dwelling,
Independent Living, Nursing Home, Institutionalized, Skilled Nursing Facility, Residential Care, Long Term Care, Outcome
Measure, Assessment.
Database Searched:
PubMed, CINAHL, Google Scholar, PsychInfo
Falls
Word
Definition
Falls
Any event that leads to an unplanned, unexpected contact with a supporting surface
.
This does NOT include falls that are the
result of an outside force such as a push or shove or falls that are the result of a medical event such as a MI, syncope or fainting.
Population Examined
Word
Definition
Older Adults
According to Medicare, a person over the age of 65 years.
Elderly
Older adults or aged individuals.
Aged
A person 65 through 79 years of age. For a person older than 79 years, AGED, 80 and over is available
Aged, 80 and over
A person 80 years of age and older.
Frail elderly (Elderly, Frail)
Older adults or aged individuals who are lacking in general strength and are unusually susceptible to disease or to other
infirmity.

7
Frail Older Adults
A person 65 or older who are lacking in general strength and are unusually susceptible to disease or to other infirmity.
Community-Dwelling Adults
According to SoG CPG Committee: a person over age of 65 residing in the community or assisted living without distinction
about health/frailty status.
Independent Living
A housing and community arrangement that maximizes independence and self-determination.
Item Examined
Word
Definition
Outcome Assessment
Research aimed at assessing the quality and effectiveness of health care as measured by the attainment of a specified end result
or outcome. Measures include parameters such as improved health, lowered morbidity or mortality, and improvement of
abnormal states (such as elevated blood pressure).
Outcome Measure
Evaluations of the efficacy/effectiveness of an intervention on the premise of gauges taken prior to, during, and following the
intervention.

8
Outcome Measure Toolkit Project Search/Review Flow Chart
Presentation of the Purpose/Mission of Outcome Measure Project to BFSIG
executives; Recruit Taskforce Members via BFSIG emails
December 2016
February 2017
First Conference Call;
Discuss Search Strategies, Keywords, Database, etc.
Initial Delegation; Key Words Search Balance/Fall-Related Outcome Measure
March 2017
Compile List From All Members : 245 Outcome Measures Identified
(By
Heidi
Moyer & Elizabeth Wang
-Hsu)
April 2017
Master List of Outcome Measures: 107 Outcome Measures
(By Taskforce Consensus)
Not Related to Balance, Falls, Functional
Mobility, or Stength (i.e., MiniCog, MMSE)
May 2017
Outcome measures critically reviewed
Outcome
measure tables developed
First recommendations made
(By Taskforce Members)
June 2017
Cross validation of outcome measures
Outcome measure recommendation finalized
December 2018
Update outcome measures literature review
May 2019
Format BFSIG Outcome Measure Toolkit (By Carmen Abbott & Elizabeth Wang-Hsu)
BFSIF Executives Internal Review
AGPT review of Outcome Measure Toolkit
October 2019
Dissemination
Excluded
9
Master List of Outcome Measures Assessing Balance/Fall Risk Being Reviewed
1. 2 Minute Walk Test & other similar timed
walks such e.g., 6 Minute Walk
2. 21 Item Fall Risk Index
3. 25 Question Geriatric Locomotive Function
Scale
4. 30 Second Chair Stand Test
5. 360 Degree Turn Time
6. 4 Step Square Test
7. 4 Stage Test, or Frailty and Injuries:
Cooperative Studies of Intervention
Techniques (FICSIT-4)
8. 5 Times Sit to Stand &10 Times Sit to Stand
9. Activities Specific Balance Confidence Scale
(ABC)
10. Activities Specific Fall Caution Scale
11. Activity-Based Balance and Gait
12. Alternate Step Test
13. Attitudes to Falls-Related Interventions
Scales
14. Balance Evaluation Systems Test (BESTest;
BESTmini; BESTbrief)
15. Balance Outcome Measure for Elder
Rehabilitation (BOOMER)
16. Balance Self-Efficacy Test
17. Balance Self-Perceptions Test
18. Bed Rise Difficulty (BRD) Scale
19. Berg Balance Scale
20. Brunel Balance Assessment
21. Canadian Occupational Performance
Measure
22. Clinical Test of Sensory Interaction and
Balance (CTSIB)
23. Community Balance and Mobility Scale
24. Scale of Balance Confidence (CONFbal)
25. Conley Scale
26. Demura's Fall Risk Assessment Chart
(DFRA)
27. Downton Fall Risk Index
28. Dynamic Gait Index
29. Elderly Fall Screening Test
30. Elderly Mobility Scale
31. Euroqual
32. Fall Handicap Inventory
33. Fall Perception Questionnaire
34. Fall Prevention Strategy Survey
35. Fall Risk for Older People in the Community
Assessment
36. Falls Behavioral Scale
37. Falls Efficacy Scale (FES)
38. Fear Avoidance Beliefs Questionnaire
(FABQ)
39. Figure 8 Walking Test
40. Floor Rise Test
41. Frenchay Activity Index
42. Fugl-Meyer Motor Assessment
43. Fullerton Advanced Balance Scale (FAB)
44. Functional Ambulation Category
10
45. Functional Fitness Test
46. Functional Gait Assessment
47. Functional Independence Measure (FIM)
48. Functional Mobility Assessment Tools (FMA)
49. Functional Reach Test
50. Gait Abnormality Rating Scale
51. Gait Efficacy Scale
52. Gait Speed (m/s)
53. Geriatric Fear of Falling Assessment
54. Global Deterioration Scale
55. Goal Attainment Scale
56. Gorningen Activity Restriction Scale
57. Grip Strength
58. Guralnik Test Battery
59. Hauser Ambulation Index
60. Health-Related Quality of Life
61. Hendrich II Fall Risk Model
62. High Level Mobility Assessment Tool
63. Home Falls and Accidental Screening Tool
64. International Physical Activity Questionnaire
65. L Test of Functional Mobility
66. LASA Fall Risk Profile
67. Late-Life Function and Disability Instrument
68. Missouri Alliance for Home Care
(MAHC-10)
69. Melbourne Fall Risk Assessment Tool
(MFRAT)
70. Minimal Chair Height Standing Ability
71. Mobility Interaction Fall Chart
72. Morse Fall Scale
73. Motor Fitness Scale
74. Multiple Lunge Test
75. Multiple Sclerosis Walking Scale-12
76. Norwegian General Motor Function
Assessment
77. Penisual Health Fall Risk Assessment Tool
(PHRAT)
78. Perceived Participation and Autonomy
79. Peter James Centre Fall Risk Assessment
Tool
80. Physical Activity Questionnaire
81. Physical Mobility Scale
82. Physical Performance Scale
83. Physiological Profile Assessment
84. Push and Release Test
85. Queensland Fall Risk Assessment Tool
(QFRAT)
86. Rivermead Mobility Index
87. Rogers Modular Obstacle Course
88. Romberg Test (Tandem)
89. Self-Efficacy Scale (SES)
90. Short Health Form Survey (SF8, SF12, SF36)
91. Short Physical Performance Battery (SPPB)
92. Shuttle Walk
93. Sickness Impact Profile Physical Dimension
94. Single Leg Stance
95. St. Thomas Risk Assessment Tool
(STRATIFY)
96. Stopping Elderly Accidents, Deaths, &
Injuries (STEADI)
97. Stroke Assessment Fall Risk
98. Stroop Stepping Test
99. Subjective Risk Rating of Specific Tasks
100. Survey of Activities and Fear of Falling in the
Elderly
101. The Obstacle Course
11
102. Timed Up and Go
103. Timed Up and Go: Dual Task
104. Tinetti Performance-Oriented Mobility
Assessment (POMA)
105. University of Illinois at Chicago Fear of
Falling Measure (UIC FFM)
106. Western Ontario and McMaster
Osteoarthritis Index (WOMAC)
107. World Health Organization Quality of Life
(WHOQoL )
12
Outcome Measures with Evidence of Psychometric Properties and Fall Risk Predictability
• 4 Step Square Test
• Activities Specific Balance Confidence Scale
• Balance Evaluation Systems Test (BESTest; BESTmini; BESTbrief)
• Berg Balance Scale
• Figure 8 Walking Test
• 5 Times Sit to Stand (more commonly used/researched than 10 Times Sit to Stand)
• Functional Gait Assessment
• Functional Reach Test
• Gait Speed (m/s)
• Grip Strength
• Hendrich II Fall Risk Model (inpatient population only)
• Morse Fall Scale
• The Obstacle Course
• Tinetti Performance-Oriented Mobility Assessment (POMA)
13
Outcome Measures Not Supported in Relation to Balance/Fall Assessment in the Older Adult
Population and Rationales
● Attitudes to Falls-Related Interventions Scales: From Prevention of Falls Network Europe [ProFaNE] (2006). This is a
questionnaire to assess attitudes related to balance and fall interventions. The web link no longer works; therefore, no
summary table presented in this document.
● Balance Self-Efficacy Test: Studies on this test only looked at activity participation, not falls. In addition, there are no
studies that validate this test; therefore, no summary table presented in this document.
● Canadian Occupational Performance Measure (COPM): The COPM is used as a measure of life satisfaction and
reintegration into normal living. It has no evidence in fall risk.
● Euroqual: Euroqual is a descriptive profile and index of health status measure from the early 1990s. It is not
recommended for fall risk assessment due to minimal evidence and no recent literature.
● Fall Handicap Inventory: There is no further study since the original report. In addition, the report was a letter to the
editor, not an article.
● Frenchay: It was validated in 1993, but there is little evidence following this validation. Therefore, no summary table is
presented in this document.
● Fugl-Meyer Motor Assessment: This measure is great for assessing motor recovery post stroke, but it is not correlated
with falls or balance. It is used mainly in studies to classify subjects and can be used to assess intervention efficacy with
other balance measures. There is no evidence on psychometric properties; therefore, no summary table presented in this
document.
● Functional Fitness Test – Senior Fitness Test: The test was developed in 1999 to measure the key components to
fitness. Age group and gender norms for fitness have been established and updated in 2013 along with some criterion
norms for loss of independence and mobility decline. This test battery as a whole has not been researched for fall risk
screening or assessment; therefore, no summary table presented in this document.
● Functional Mobility Assessment Tool (FMA): Functional mobility assessment (FMA) instrument is a self-report
outcome tool designed to measure the effectiveness of wheeled mobility and seating, not a fall assessment; therefore, no
summary table presented in this document.
● Gait Abnormality Rating Scale: There is minimal research supporting the Gait Abnormality Rating Scale, however,
there is a modified version currently in the process of validation.
● Gait Efficacy Scale: There is minimal research supporting the Gait Efficacy Scale, however, there is a modified version
currently in the process of validation.
● Global Deterioration Scale: This scale is not a fall assessment, but a dementia/cognitive assessment tool.
14
● Goal Attainment Scale: This is scale is for patient-centered goals attainment. The population and psychometric property
varied depending on the population and goals selected. In addition, it used a T-score; therefore, no summary table
presented in this document.
● Guralnik Test Battery: We were unable to find evidence to validate this performance-based test battery; therefore, no
summary table presented in this document.
● Health-Related Quality of Life: This is a quality of life assessment, not a balance and fall assessment; therefore, no
summary table presented in this document.
● International Physical Activity Questionnaire: This questionnaire with limited studies and varied validity is not a fall
assessment measure. It is used as an indication of activity level and has no established link to balance performance and
fall risk. See systematic review by Lee et al 2018 for more information
● L Test of Functional Mobility: This test is a modified version of the Timed Up and Go Test designed for people with
lower limb amputations. It is not a general fall assessment measure.
● Late Life Function and Disability Instrument: This instrument is not a fall assessment measure.
● Motor Fitness Scale: There is little evidence to support use of this scale in balance and falls management in the older
adult population.
● Norwegian General Motor Function Assessment: This assessment has very limited study. It is recommended to look at
the General Motor Function Assessment instead.
● Perceived Participation and Autonomy: There are many studies on vertigo and how it affects falls, but none on how
this assessment tool is used for identifying fall risk; therefore, no summary table presented in this document.
● Peter James Centre Fall Risk Assessment Tool: No studies found on this tool; therefore, no summary table presented in
this document.
● Physical Activity Questionnaire (CHAMPS): CHAMPS is a valid and reliable measure, however, no link to fall risk
prediction.
● Physical Mobility Scale: This is a scale of disability or functional mobility in residential older adults that is used to
determine physical assistance in care facilities. It is not applicable to balance or fall risk assessment.
● Physical Performance Scale: This scale is a test of physical function that has been updated in Multiple Sclerosis
literature. There is low evidence for use of it in fall prediction. In the past 10 years, it has been used primarily for stroke
and dementia diagnoses. In addition, there are no psychometrics for this scale.
● Rivermead Mobility Index: This index is a mobility test with limited supporting literature found
● Roger Modular Obstacle Course: There were no articles found; therefore, no summary table presented in this
document.
15
● Self-Efficacy Scale (SES): This scale measures self-efficacy in strength, stamina, and memory. It is not related to
balance and falls.
● Short Health Form Survey (SF8, SF12, SF36): This survey is not a balance and fall risk assessment; therefore, no
summary table presented in this document
16
Outcome Measures Related to Balance/Fall Risk Assessment but Warranting Additional
Research for Further Validation
● 21 Item Fall Risk Index: No further evidence reported aside from the original article.
● 25 Question Geriatric Locomotive Function Scale: This scale is not widely used and has limited evidence to support it.
● Activity-Based Balance and Gait: No further evidence reported aside from the original article.
● Activity Specific Fall Caution Scale: No further evidence reported aside from the original article.
● Alternate Step Test (Step Test): It is a component of Berg Balance Scale that is not widely studied.
● Balance Outcome Measure for Elder Rehabilitation (BOOMER): There are two articles supporting the measure from
2007 and 2011, but more is warranted.
● Balance Self Perception Test: There was only one study found to support this measure.
● Bed Rise Difficulty Scale: This scale assesses mobility with limited studies related to fall assessment.
● Brunel Balance Assessment: There were limited studies with insufficient information to support this assessment.
● Clinical Test of Sensory Integration & Balance (CTSIB): Most of research supporting the CTSIB were in other
populations. It has moderate construct validity. This measure warrants studies in older adult balance/fall assessment.
● Community Balance & Mobility Scale (CB&M): Strength, balance, and quality of life measure for young elders and
young adults. There is no evidence that it can predict fall risk.
● CONFbal Scale of Balance Confidence: It is a balance confidence scale with limited evidence related to fall
predictability.
● Conley Scale: There is limited evidence to support this measure.
● Demura’s Fall Risk Assessment Chart (DFRA): This chart is a 50 item list used in Japan in a large population study.
Further research is needed to decrease the number of items on the list if it will be used in other countries and general
practice.
● Downton Fall Risk Index: There are few studies to support this measure. The index uses an inpatient population and has
low specificity.
● Elderly Mobility Scale (EMS): EMS was developed for use with frail elderly adults for mobility status. It is not
validated for fall risks.
● Elderly Fall Screening Test: This measure is not well studied, however, early work shows fall risk predictability.
● Falls Behavioral Scale: Limited research supporting this scale with no cutoff score or stratification for fall risk. There
were two articles found about the scale, however, access was only available to the initial article (2003). We were unable
to access the other 2008 article published in the Journal of Disability and Rehabilitation. Review table completed with
the initial research article information on validity and reliability.
17
● Fall Perception Questionnaire: This measure looks at adult perception about fall risk. It is not a fall risk predictor;
therefore, further studies needed to link to fall risk predictability.
● Fall Prevention Strategy Survey: This measured is studied on the Multiple Sclerosis population, however, only the
original article was found. It needs further study. No research on this outcome measure since 2009 which included a
Rasch Validation Analysis. This outcome measure was identified as a valid tool to examine the frequency of engaging in
protective behaviors related to fall risk among adults with Multiple Sclerosis and to track outcomes of behaviorally
oriented fall reduction interventions, but has not been identified as a tool for assessment of fall risk.
● Fall Risk for Older People in the Community Assessment: This measure has a moderate capacity to predict falls, but
needs further studies.
● Floor Rise Test: There is limited research supporting its use.
● Fullerton Advanced Balance Scale (FAB): One study in 2008 presented a cutoff. There is a Sn, Sp, and PPV for fall
predictability. This scale warrants more research.
● Functional Ambulation Category: Sn and Sp are established. It is used in post stroke population and can be used to
predict community ambulation post stroke. This scale warrants more studies in other populations.
● Geriatric Fear of Falling Measure: There is significant validity with FES. It has good reliability but is not studied very
well in populations outside of Northern Taiwan. It is touted as a screening tool for nursing.
● Gorningen Activity Restriction Scale: It is a mobility restriction assessment scale. More studies are needed to evaluate
the relationship to balance and fall risk.
● Hauser Ambulation Index: It has been validated against multiple other outcome measures for the Multiple Sclerosis
population, however, more studies are needed for other populations and for fall risk prediction.
● High Level Mobility Assessment Tool: There is one article for validity, reliability, and MDC in inpatient traumatic
brain injury population, however, there are no studies for other populations or to predict fall risk.
● Home Falls and Accidental Screening Tool: This is a reliable and valid home fall assessment survey/questionnaire.
This is one study with a large sample size with high sensitivity and low specificity that presented cutoff score as 9. It has
also been validated in foreign languages including Malaysia and Chinese. However, no report found in US population.
● Push and Release Test: There was one study in 2006. No other evidence to support the test.
● LASA Fall Risk Profile: There are limited studies, but nothing since 2010.
● Melbourne Fall Risk Assessment Tool (MFRAT): This is a novel assessment tool targeting residential population
(nursing home and long-term care facilities), but no other validation except the original article. More research warranted
in this population.
● Minimal Chair Height Standing Ability: This is a novel assessment tool from 2015. The original article validated it
with a large sample (n = 156), however, more validation is warranted.
18
● Mobility Interaction Fall Chart: This is a functional assessment for residential care population. Only the original article
provided some validation.
● Multiple Sclerosis Walking Scale-12: This scale has good psychometrics but limited to use in Multiple Sclerosis
population. Data is limited to younger population due to the progressive and debilitating nature of Multiple Sclerosis.
● Multiple Lunge Test: This test has an established Sn and Sp, but limited research in last five years.
● Peninsula Health Fall Risk Assessment Tool (PHRAT): This tool needs more research to support it.
● Queensland Fall Risk Assessment Tool (QFRAT): There is very limited evidence on this tool after 2014. Most of the
research was conducted more than five years ago.
● Short Physical Performance Battery (SPPB): This is a fitness/activity capacity test with no established link to balance
performance and fall risk.
● Stroop Stepping Test: This is a low cost test capable of distinguishing fallers from non-fallers, however, it has limited
research in the last five years. A computer program with a specialized mat sensor is required to track response time and
accuracy.
● Shuttle Walk: Shuttle Walk is a reliable aerobic capacity test, however, more research is needed to establish a link to
balance and fall risks.
● Stroke Assessment Fall Risk: While this measure has promising fall risk predictability in stroke population, there is no
reliability evidence found. More studies are needed for other populations/diagnoses.
● Subjective Risk Rating of Specific Tasks: One original article in 2011 validated the measure, but it needs more study.
● Survey of Activities and Fear of Falling in the Elderly: This measures activity and fear of falling (not efficacy or
confidence), however, only the original article validated this tool.
● The Falls Behavior Scale: It has the potential to be a useful tool but is not widely used and has not been well researched
to identify fall risk predictability.
● University of Illinois at Chicago Fear of Falling Measure (UIC FFM): This tool measures the construct of fear of
falling (not efficacy or confidence), however, only the original article validated it. Many
presentations/abstracts/proceedings found at various conferences (ISPRM, IAAG, CSM), but are not published yet.
19
Outcome Measures Widely Used, but with Limited Recent Evidence Related to Fall Risks
● 2 Minute Walk Test and other similar timed tests e.g., 6 Minute Walk: This outcome measure was designed to
measure aerobic capacity/endurance, however, its predictability of fall risk is yet to be established.
● 30 Second Sit to Stand: There is significant amount of evidence for fall risk prediction, however, there are no cutoff
scores, just comparisons to age norms. There is minimal cross validation to different diagnoses.
● 360 Degree Turn: Incorporated into many tests, but as a stand-alone it has significant variability in the cutoff time/steps.
Despite inconsistent cutoff, it still has high sensitivity and specificity.
● 4 Stage Balance Test (Also known as “Frailty and Injuries: Cooperative Studies of Intervention Techniques” -
FICSIT-4): There is no study that looked at the FICSIT alone. Some studies looked at tandem, single limb, or the
STEADI but nothing at FICSIT alone.
● Dynamic Gait Index: There is limited recent evidence to support the DGI. The DGI is primarily studied with the
vestibular population. It has moderate to high construct validity.
● Falls Efficacy Scale (FES): It is supported for falls, but not well studied for predictive capability. There is no recent
literature on this scale.
● Fear Avoidance Beliefs Questionnaire (FABQ): It is validated against other outcome measures (i.e., FES, BBS, etc.),
however, it does not have evidence in cutoff scores to support use in predicting fall risk. No summary table in this
document.
● Functional Independence Measure (FIM): No strong evidence in the literature to support the use of FIM to identify fall
risk. Petitoierre et al 2010 identified poor Sn, Sp for using FIM to identify fall risk at two different cutoff scores. Much of
the literature on the FIM discusses its use in determining rehab potential, overall functional prognosis, and to monitor
progress in rehab settings. Forest et al 2016 identified that FIM scores at admission are inversely related to fall risk but
without cutoff scores.
● Missouri Alliance for Home Care (MAHC-10): This is used at home health setting in all Epic and other EMR systems.
Information only found in the original article. More evidence is warranted.
● Physiological Profile Assessment (PPA): The shortened version has been studied in the past four years with slightly
higher reliability than the long form. There are multifactorial clinical tests with evidence for individual test reliability.
● Romberg Test (Tandem Stance): This is a reliable and valid test; however, it is seldom used alone. It is usually part of a
larger assessment (BESTest, STEADI).
● Single Leg Stance: This is a reliable and valid test; however, it is seldom used alone. It is usually part of a larger
assessment (BESTest, STEADI).
20
● Sickness Impact Profile (SIP): This profile looks at physical dimension. It has been researched and used for many
diagnoses, but unsure if it corresponds to fall/balance assessment. There is no direct evidence regarding fall risk.
● Stopping Elderly Accidents, Deaths, and Injuries (STEADI): It is used by PT as a screening tool, but needs continued
refinement and field validation of its use in primary care.
● St. Thomas Risk Assessment Tool (STRATIFY): Used as a hospital fall screening tool to identify patient’s fall risk,
however, literature reports inconsistent predictive accuracy. This raises questions about operational usefulness. More
studies are warranted for fall predictability.
● Timed Up and Go - Dual Task: Incorporated into other tests, however, there are many varieties clinically. More studies
are needed for cutoff scores linked to fall predictability.
● Western Ontario and McMaster Osteoarthritis Index (WOMAC): A patient reported outcome measure (PROM) that
is widely used to evaluate the pain, stiffness, and physical function of patients with osteoarthritis of the hip and knee. It is
not a balance and fall assessment. Studies are needed to link to balance and fall risks; therefore, no summary table
presented in this document.
● World Health Organization Quality of Life (WHOQoL): This has not been cross validated with other balance and
falls measures. This measure is not a direct assessment of balance or falls and should not be included in the final
recommendation since its primary purpose is not related. No summary table presented in this document.
21
Outcome Measures Divided by Setting
Outcome Measures Studied in Community Setting
● 21 Item Fall Risk Index
● 25 Question Geriatric Locomotive Scale
● 30 Second Chair Stand Test
● 360 Degree Turn Time
● 4 Step Square Test
● Five Times Sit to Stand Test
● Activities Specific Balance Confidence Scale
● Activity-Based Balance and Gait
● Balance Self-Perceptions Test
● Berg Balance Scale
● Brunel Balance Assessment
● Clinical Test of Sensory Interaction and Balance
(CTSIB)
● Community Balance and Mobility Scale
● CONFal Scale of Balance Confidence
● Demura’s Fall Risk Assessment Chart (DFRA)
● Downton Fall Risk Index
● Dynamic Gait Index
● Fall Risk for Older People in the Community
Assessment
● Falls Efficacy Scale (FES)
● Fear Avoidance Beliefs Questionnaire (FABQ)
● Floor Rise Test
● Fullerton Advanced Balance Scale (FAB)
● Functional Gait Assessment (FGA)
● Functional Reach Test (FRA)
● Gait Efficacy Scale
● Gait Speed
● Geriatric Fear of Falling Assessment
● Grip Strength
● LASA Fall Risk Profile
● Minimal Chair Height Standing Ability
● Multiple Lunge Test
● Physical Activity Questionnaire (CHAMPS)
● Physical Performance Scale
● Physiological Profile Assessment
● Push and Release Test
● Romberg Test
● Single Let Stance
● Stopping Elderly Accidents, Deaths, & Injuries
(STEADI)
● Stroop Stepping Test
● Tandem Test
● The Obstacle Course
● Timed Up and Go Test
● Timed Up and Go - Dual Task
● Tinetti Performance-Oriented Mobility Assessment
● University of Illinois at Chicago Fear of Falling
Measure (UICFFM)
22
Outcome Measures Studied in Acute Hospital Setting
● Balance Evaluation System Test (BESTest; BESTmini; BESTbrief)
● Berg Balance Scale
● Community Balance and Mobility Scale
● Conley Scale
● Downton Fall Risk Index
● Dynamic Gait Index
● Figure 8 Walking Test
● Fullerton Advanced Balance Scale (FAB)
● Functional Reach Test
● Gait Speed
● Gorningen Activity Restriction Scale
● Grip Strength
● Hendrich II Fall Risk Model
● High Level Mobility Assessment Tool
● Melbourne Fall Risk Assessment Tool (MFRAT)
● Morse Fall Scale
● Single Leg Stance (Single Limb Standing)
● St. Thomas Risk Assessment Tool (STRATIFY)
● Stroke Assessment Fall Risk
● Tinetti Performance-Oriented Mobility Assessment (POMA)
● World Health Organization Quality of Life (WHOQoL)
23
Outcome Measures Studied in Inpatient Rehab (Rehab Hospital or SNF) Setting
● Balance Evaluation System Test (BESTest; BESTmini; BESTbrief)
● Berg Balance Scale
● Downton Fall Risk Index
● Dynamic Gait Index
● Figure 8 Walking Test
● Fullerton Advanced Balance Scale (FAB)
● Functional Reach Test
● Gait Speed
● Grip Strength
● Hendrich II Fall Risk Model
● High Level Mobility Assessment Tool
● Melbourne Fall Risk Assessment Tool (MFRAT)
● Morse Fall Scale
● Peninsula Health Fall Risk Assessment Tool (PHRAT)
● Shuttle Walk
● Single Leg Stance (Single Limb Standing)
● St. Thomas Risk Assessment Tool (STRATIFY)
● Tinetti Performance-Oriented Mobility Assessment (POMA)
● World Health Organization Quality of Life (WHOQoL)
24
Outcome Measures Studied in Outpatient Setting
● Balance Evaluation System Test (BESTest; BESTmini; BESTbrief)
● Berg Balance Scale
● Community Balance and Mobility Scale
● CONFbal Scale of Balance Confidence
● Dynamic Gait Index
● Fall Perception Questionnaire
● Figure 8 Walking Test
● Fullerton Advanced Balance Scale (FAB)
● Functional Reach Test
● Gait Speed
● Grip Strength
● Hauser Ambulation Index
● Shuttle Walk
● Sickness Impact Profile Physical Dimension
● Single Leg Stance (Single Limb Standing)
● World Health Organization Quality of Life (WHOQoL)
25
Outcome Measures Studied in Home Health Setting
● Balance Evaluation System Test (BESTest; BESTmini; BESTbrief)
● Berg Balance Scale
● Figure 8 Walking Test
● Home Falls and Accidents Screening Tool (HomeFast)
● Missouri Alliance for Home Care (MAHC-10)
● Single Leg Stance (Single Limb Standing)
26
Outcome Measures Studied in Long Term Care Facility Setting
• Activities Specific Balance Confidence Scale
• Bed Rise Difficulty (BRD) Scale
• Berg Balance Scale
• Gait Speed
• Hauser Ambulation Index
• Melbourne Fall Risk Assessment Tool (MFRAT)
• Mobility Interaction Fall Chart
• Morse Fall Scale
• Peninsula Health Fall Risk Assessment Tool (PHRAT)
• Physiological Profile Assessment
• Queensland Fall Risk Assessment Tool (QFRAT)
• Sickness Impact Profile Physical Dimension
• Single Leg Stance (Single Limb Standing)
• St. Thomas Risk Assessment Tool (STRATIFY)
• Subjective Risk Rating of Specific Tasks
• Survey of Activities and Fear of Falling in the Elderly

27
Summary Tables of Each Individual Outcome Measure
(alphabetic order; 92 tables)
Outcome
Measure
Reference
Population/
Diagnosis
Psychometric property
Fall Predictability
Validity
Reliability
MDC
Cutoff score
Sn
Sp
PPV
NPV
2 Minute
Walk Test
Pin et al.,
2014
Systematic
Review, 25 studies
were all adults
with one exception
NA
Moderate to strong evidence
to support the 2MWT as a
reliable, valid, and responsive
outcome measure for adults
with lower limb amputation
and for frail elderly patients.
Important psychometric
information on the 2MWT
such as minimal clinically
important changes and
normative data is still
missing. At present, any
changes in the 2MWT should
be interpreted with caution.
NA
NA
NA
NA
NA
NA
Bohannon et
al.,
2015
Community-
dwelling adults
(age 18-85 y/o,
n=1137)
NA
ICC 0.82
42.5m
NA
NA
NA
NA
NA
Legend:
NA = Not assessed
MDC = Minimum Detectable Change
y/o = years old
s/p = after
Sn = Sensitivity
Sp = Specificity
PPV = Positive Predictive Value
NPV = Negative Predictive

28
Outcome
Measure
Reference
Population/
Diagnosis
Psychometric property
Fall Predictability
Validity
Reliability
MDC
Cutoff score
Sn
Sp
PPV
NPV
21 Item Fall
Risk Index
Ishimoto et
al., 2012
Community-
dwelling adults
(age >65, n=518)
NA
NA
NA
≥ 10 items
NA
NA
NA
NA
Outcome
Measure
Reference
Population/
Diagnosis
Psychometric property
Fall Predictability
Validity
Reliability
MDC
Cutoff score
Sn
Sp
PPV
NPV
25 Question
Geriatric
Locomotive
Function Scale
Seichi et
al.,
2012
Community-
dwelling adults
(age >65, n=711)
NA
Test-retest ICC
(range 0.712–
0.924).
NA
16 for
identifying
locomotive
syndrome
NA
NA
NA
NA
Seichi et
al.,
2014
Community-
dwelling adults
(age >65, n=880)
NA
NA
NA
16
NA
NA
NA
NA
Tavares et
al., 2017
Community-
dwelling adults
(age >60, n=100)
NA
Interobserver and
intra-rater ICC of
97.6% and
98.4%,
respectively
NA
NA
NA
NA
NA
NA
Kimura et
al., 2018
Older adults with
cervical
myelopathy
(mean age 67.2 ±
11.7 y/o, n=360)
NA
NA
NA
NA
NA
NA
GLFS-25 and lower
extremity motor function
score of the JOA score
yielded the areas under the
receiver operating
characteristic curves of
0.674 and 0.607,
respectively, to differentiate
recurrent fallers from non-
recurrent fallers.
NA

29
Outcome
Measure
Reference
Population/
Diagnosis
Psychometric property
Fall Predictability
Validity
Reliability
MDC
Cutoff score
Sn
Sp
PPV
NPV
30 Sec Sit to
Stand
Rikli et al., 1999
Community-
dwelling older
adults
Criterion validity
of the chair stand
compared to
weight adjusted
leg press
performance for
all participants: r
= 0.77, 95% CI =
0.64-0.85
Test-retest: r
= 0.89 (95%
CI 0.79-
0.93)
interrater
reliability r
= 0.95 (95%
CI 0.84-
0.97)
NA
.
NA
NA
NA
NA
Yamada et al., 2015
157 Japanese
community-
dwelling older
adults (76±6 y/o)
NA
NA
NA
OR to fall
prediction =
1.03
NA
NA
NA
NA

30
Outcome
Measure
Reference
Population/
Diagnosis
Psychometric property
Fall Predictability
Validity
Reliability
MDC
Cutoff score
Sn
Sp
PPV
NPV
360 Degree
Turn Time
Dite & Temple,
2002
Community-
dwelling
NA
Inter-rater reliability:
Kappa=096
Intra-rater reliability:
Kappa=0.92
Re-test reliability:
Kappa=0.91
Inter-rater reliability:
kappa=0.97
Intra-rater reliability:
kappa=0.99
Re-test reliability:
Kappa=0.90
NA
4 steps
2.1 SEC
92
81
70
89
NA
NA
Schenkman et al.,
2011
Parkinson’s
Disease
NA
Test-retest reliability:
seconds: ICC = 0.77
steps: ICC = 0.80
NA
NA
NA
NA
NA
NA
Shiu et al., 2016
Stroke survivors
(55 y/o or older)
NA
Excellent intra-rater,
interrater, and test-
retest reliability
(ICC=.824–.993)
-NA
Affected
side:0.76
seconds
Unaffected
side: 1.22
seconds
84
84
91
89
NA
NA

31
Outcome
Measure
Reference
Population/
Diagnosis
Psychometric property
Fall Predictability
Validity
Reliability
MDC
Cutoff score
Sn
Sp
PPV
NPV
4 Square
Step Test
Dite et al., 2002
Community-
dwelling
Strong correlations with the
TUG and Step Test.
The lower correlations found
between the FSST and FRT
Interrater:
ICC=0.99
Re-test:
ICC=0.98
NA
> 15sec
85
100
100
86
Dite et al., 2007
s/p Unilateral
Transtibial
Amputation
NA
NA
NA
24 seconds
92
93
NA
NA
Whitney et al.,
2007
Patients with
vestibular
symptoms
who were
rolled into PT
Good correlations with the other
gait measures (correlation
coefficients for the TUG, .69;
gait speed, .65; DGI, −.51) and
poor correlations with the DHI
and the ABC (DHI, −.13; ABC,
−.12)
IC=9.93; 95CI
0.86–0.96
NA
12 sec
80
92
NA
NA
Blennerhassett et
al., 2008
Older adults
who could
walk at least
50m with
minimal
assistance
Strong inverse relationship with
step test: spearman ρ=−0.73 to
−0.86
Inter-rater
reliability:
0.94–0.99
NA
15 seconds
NA
NA
NA
NA
Duncan et al.,
2013
Individuals
with idiopathic
Parkinson’s
Disease
NA
Interrater ICC =
0.99
Test-retest
reliability ICC
= 0.78
NA
9.68 sec
73
57
31%
from
21%
NA
Goh et al., 2013
Community-
dwelling older
adults with
chronic stroke
Correlation with TUG scores
r=.59; P=.02
Intra-rater
reliability:0.82-
0.83
Interrater
reliability >.99
NA
11
73.3
93.3
NA
NA

32
Wagner et al.,
2013
Relapsing-
remitting,
secondary
progressive,
and primary
progressive
Multiple
Sclerosis
Excellent correlations between
the FSST and BBS (rs = -0.84,
P<0.001), DGI (rs = -0.81, P
<0.001), and ABC (rs = -0.78, P
<0.001). The FSST was also
moderately correlated with
EDSS scores (rs=0.73, P<0.001).
Test–retest,
reliability:0.922
(0.831–0.965)
4.6
sec
NA
NA
NA
NA
NA

33
Outcome
Measure
Reference
Population/
Diagnosis
Psychometric property
Fall Predictability
Validity
Reliability
MDC
Cutoff score
Sn
Sp
PPV
NPV
5 Times Sit
to Stand
(10 Times Sit
to Stand)
Tiedemann et
al.,
2008
Community-
dwelling adults
(age 74-98 y/o, n
= 362)
NA
ICC 0.89 (95% CI =
0.79-0.95)
NA
NA
NA
NA
NA
NA
Buatois et al.,
2008
Community-
dwelling older
adults (>65 y/o,
mean age 70±4)
NA
NA
NA
12 s
Risk Ratio 1.74,
CI=1.24-2.45,
P<.001
55%
65%
NA
NA
Bohannon et
al., 2011
(Systematic
Review)
Community-
dwelling older
adults
NA
ICCs ranged from 0.64
to 0.96. The adjusted
mean ICC calculated
from the reported ICCs
was 0.81
NA
NA
NA
NA
NA
NA
Wallmann, et
al.,
2012
Community-
dwelling older
adults (mean age
65 y/o)
NA
Excellent interrater
reliability among all
three researchers: ICC =
1.000.
NA
NA
NA
NA
NA
NA
Fang Zhang,
et al.,
2013
Community-
dwelling older
adults
NA
NA
NA
Those who
require > 16.6 s to
finish 5TSTS
have significantly
higher likelihood
of developing
IADL-related
disability at 3
year follow-up
NA
NA
NA
NA
Lusardi et al.,
2017
(Systemic
Review)
Community-
dwelling older
adults (age >65
y/o)
n > 30
NA
NA
NA
>12 s
49%
63%
+LR 1.6;
Posttest
Probability if
+ 41
-20

34
Medina-
Mirapeix, et
al.,
2018
Community-
dwelling older
adults s/p
unilateral Total
Knee
Replacement
NA
ICC for inter-observer
reliability of the 5STS
were 0.998 for men and
women combined. For
test-retest 0.982
NA
NA
NA
NA
NA
NA
10 Time Sit
to Stands
Bohannon
2006
(Meta-
analysis)
Healthy older
adults (60+ y/o)
NA
NA
NA
60-69 11.4s
70-79 12.6s
80-89 12.7s
NA
NA
NA
NA
Segura-Ortí,
et al.,
2011
39 adults
undergoing
hemodialysis
(mean age 60
y/o)
NA
Test-retest ICC 0.88
8.4
sec;
STS
10
NA
NA
NA
NA
NA

35
Outcome
Measure
Reference
Population/
Diagnosis
Psychometric property
Fall Predictability
Validity
Reliability
MDC
Cutoff score
Sn
Sp
PPV
NPV
Activity-Based
Balance and Gait
Topper et al.,
1993
17 men and 83 women
volunteers (aged 62-96
y/o) who ADL
independently
NA
NA
NA
NA
NA
NA
NA
NA
Outcome
Measure
Reference
Population/
Diagnosis
Psychometric property
Fall Predictability
Validity
Reliability
MDC
Cutoff score
Sn
Sp
PPV
NPV
Activities
Specific Balance
Confidence Scale
(ABC)
Lajoie Y and
Gallagher S P,
2004
Community-dwelling
older adults
NA
NA
NA
<67
89
96
NA
NA
Steffen T and
Seney M, 2008
Parkinson’s Disease (mean
age=71 y/o)
NA
Test-retest
reliability 0.90
13
NA
NA
NA
NA
NA
Mak M K and
Pang M Y,
2009
NA
NA
NA
NA
<67
93
69
NA
NA
Sakakibara et
al., 2011
Unilateral lower limb
amputation for at least 6
months (age ≥50 y/o)
NA
ICC=0.93
Test-re-test r=
0.84–0.95
NA
NA
NA
NA
NA
NA

36
An et al., 2017
Chronic stroke survivors,
who have ability to
ambulate > 10m without
walking aides, with
absence of lower motor
neuron diseases or
musculoskeletal problems,
and with score of >24 on
the Mini-Mental State
Examination (MMSE).
NA
NA
NA
81
71%
72%
NA
NA

37
Outcome
Measure
Reference
Population/
Diagnosis
Psychometric property
Fall Predictability
Validity
Reliability
MDC
Cutoff score
Sn
Sp
PPV
NPV
Activities
Specific Fall
Caution Scale
Blanchard et
al., 2007
Seniors residing in
nursing homes or
assistive living facility
Convergent
validity: with
functional
measures
(TUG, Berg,
etc.);
Discriminant
validity (with
or without
walking aid):
p<0.05
Test-retest: ICC
(2,1)
=.87; 95% CI, .78−.93
NA
NA
NA
NA
NA
NA
Outcome
Measure
Reference
Population/
Diagnosis
Psychometric property
Fall Predictability
Validity
Reliability
MDC
Cutoff score
Sn
Sp
PPV
NPV
Alternate Step
Test
Tiedemann
et al., 2008
Community-dwelling
adults (age 74-98 y/o, n
= 362)
NA
ICC 0.78 (95% CI =
0.59, 0.89)
NA
> 10sec
69%
56%
NA
NA
Chung et
al., 2014
S/p stroke
NA
Inter-rater (ICC=
0.991– 0.999), intra-
rater (ICC= 0.946–
0.955) and test-retest
reliability (ICC=
0.909–0.952) of the
AST times for the
participants with
stroke
3.26sec
NA
NA
NA
NA
NA

38
Outcome
Measure
Reference
Population/
Diagnosis
Psychometric property
Fall Predictability
Validity
Reliability
MDC
Cutoff score
Sn
Sp
PPV
NPV
Balance
Outcome
Measure for
Elder
Rehabilitation
(BOOMER)
Haines et al.,
2007
Australian adults in 2
states received PT
services (inpatient,
outpatient and
homecare)
Construct
validity with
Modified Elderly
Mobility Scale
(MEMS), (ρ
=.88)
Cronbach
α: .87-.89
NA
NA
NA
NA
NA
NA
Kuys et al.,
2011
Australian rehab
inpatient geriatric
unit patients
Concurrent
validity with
Berg (ρ=.91;
P<.01)
with gait speed
(ρ=.67; P<.01)
NA
NA
NA
NA
NA
NA
NA
Outcome
Measure
Reference
Population/
Diagnosis
Psychometric property
Fall Predictability
Validity
Reliability
MDC
Cutoff score
Sn
Sp
PPV
NPV
Balance Self-
Perception Test
Shumway-
Cook et
al.1997
Community-dwelling
older adults
NA
NA
NA
<50
73
82
NA
NA
Outcome
Measure
Reference
Population/
Diagnosis
Psychometric property
Fall Predictability
Validity
Reliability
MDC
Cutoff score
Sn
Sp
PPV
NPV
Bed Rise
Difficulty Scale
Alexander, et
al., 1992
Women 3 groups:
Young n=17, (24 y/o),
Community-dwelling
n=12, (71 y/o),
Assisted living n=15.
(86 y/o)
NA
NA
NA
0-10 Min
difficulty, 11-
20 Mod
difficulty, 21
30 severe
difficulty
NA
NA
NA
NA
.

39
Outcome
Measure
Reference
Population/
Diagnosis
Psychometric property
Fall Predictability
Validity
Reliability
MDC
Cutoff score
Sn
Sp
PPV
NPV
Berg
Balance
Scale
Godi et al.,
2013
93
individuals
with balance
deficits
(mean age 66
y/o)
With scores of Mini-BESTest
at baseline and follow-up:
r= 0.85
Test-retest reliability:
ICC= 0.92 (95%
CI.87-.97)
Inter-rater reliability:
ICC= 0.97 (95%
CI .96-.99)
MDC=
6.2
(SEM=
2.18)
NA
77%
97%
NA
NA
Major et al.,
2013
n = 30, with
lower
extremity
amputation
(mean age 54
y/o)
NA
Inter-rater reliability:
ICC= 0.94
NA
NA
NA
NA
NA
NA
Wong 2014
5 individuals
with lower
limb
amputations
NA
Inter-rater reliability:
ICC= 0.99 (95%
CI .99-1.00)
Intra-rater reliability:
ICC= 0.99 (95%
CI .96-1.00)
NA
NA
NA
NA
NA
NA
Pickenbrock
et al.,
2015
53 patients
with acute
stroke
With Static Balance test: r =
0.91
Inter-rater reliability:
ICC= 0.87
NA
NA
NA
NA
NA
NA

40
Chan et al.,
2015
92 patients
with total
knee
arthroplasty
At 2 weeks post-op:
With FGA: r= 0.67
With BESTest: r= 0.78
With Mini-BESTest: r= 0.72
With BriefBESTest: r= 0.74
At 12 weeks post-op:
With FGA: r= 0.51
With BESTest: r= 0.68
With Mini-BESTest: r= 0.58
With BESTest Brief: r= 0.64
At 24 weeks post-op:
With FGA: r= 0.43
With BESTest: r= 0.64
With Mini-BESTest: r= 0.55
With BESTest Brief: r= 0.71
Inter-rater reliability:
ICC= 0.98 (95% CI
0.97-0.99)
MDC=
2.00
(SEM=
0.72)
NA
NA
NA
NA
NA
Telenius et
al., 2015
33 nursing
home
patients with
mild to
moderate
dementia (82
y/o)
NA
Inter-rater reliability:
ICC= 0.99
MDC=
1.92
(SEM=
0.97)
NA
NA
NA
NA
NA
Schlenstedt
et al., 2016
85 patients
with
idiopathic
Parkinson’s
Disease
Construct validity:
r= 0.94
NA
NA
To predict
future falls:
Cutoff score
of <52/56
0.64
(95%
CI:
0.47-
0.78)
0.67
(95%
CI:
0.50-
0.80)
NA
NA
Jacome et
al., 2016
46 patients
with COPD
(mean age 75
y/o)
With ABC scale:
rho= 0.75
Inter-rater reliability:
ICC= 0.94 (95%
CI .88-.97)
Intra-rater reliability:
ICC= 0.52 (95%
CI .19-.74)
MDC=
5.9
(SEM=
2.1)
With and
without
history of
falls: Cutoff
score of
52.5/56
0.73
0.77
3.20
0.35

41
Lee at al.,
2016
75
hemiparetic
stroke
patients
(mean age of
58 y/o)
NA
NA
NA
To predict
level of
community
ambulation
(defined as
gait speed >
0.8
meters/sec):
> 46.5/56
79%
76%
72%
82%
Marques et
al., 2016
122
community-
dwelling
older adults
(mean age of
76 y/o)
With ABC scale:
rho= 0.58
Inter-rater reliability:
ICC= 0.88 (95% CI
0.77-0.94)
Test-retest reliability:
ICC= 0.50 (95% CI
0.15-0.73
MDC=
4.6
(SEM=
1.4)
To identify
participant
with or
without
history of
falls:
Cutoff score
of 48.5/56
74%
72%
2.59
0.37
Park et al.,
2017
9,743
individuals
(aged > 60
y/o)
NA
NA
NA
NA
0.73
(95%
CI:
0.65-
0.79)
0.90
(95%
CI:
0.86-
0.93
NA
NA
Jorgensen et
al., 2017
46
individuals
with chronic
spinal cord
injury
With mini-BESTest:
r= .889
With TUG test:
r= -.75
With SCIM:
r= 0.88
With 10 m walk time:
r= -.88
With WISCI II:
r= 0.63
With FES-1:
r= -0.62
NA
NA
Between
walkers
without
walking aids
and those
with walking
aids:
Cutoff score
of >47/56
Between
participant
with
low/high
concerns of
falling:
≤46/56
NA
NA
NA
NA

42
Outcome
Measure
Reference
Population/
Diagnosis
Psychometric property
Fall Predictability
Validity
Reliability
MDC
Cutoff score
Sn
Sp
PPV
NPV
BESTest
Horak et
al., 2009
Adults with
neurological
disorders
With
Activities
Specific
Balance
Confidence
Scale (ABC)
r=.69
Interrater:
BESTest (ICC
= .91)
Components
(.79-.96); n =
22
NA
NA
NA
NA
NA
NA
Leddy et
al., 2011
Adults with
Parkinson’s
Disease (>40
y/o; no
description)
With Berg
Balance Scale
(BBS); r=.87
Interrater:
BESTest [ICC
(2, 1)
= .96];
component
(.79-.96); n =
15;
Test-retest:
BESTest [ICC
(2, 1) = .88];
component
(.63-.87); n =
24
NA
NA
NA
NA
NA
NA
Padgett et
al., 2012
13 adults with
and 13 adults
without
Multiple
Sclerosis
NA
Interrater:
BESTest:
ICC =.99; No
component
reported
NA
77
86%
95%
NA
NA
Duncan et
al., 2013
80 participants
with
Parkinson’s
Disease,
(68.2±9.3 y/o);
Retrospective 6
month;
Prospective 6
month: Prospec
tive 12 month
NA
NA
NA
69%
Retrospective
6 month:
84%;
Prospective 6
month: 93%;
Prospective
12 month:
46%
Retrospective
6 month:
76%;
Prospective 6
month: 84%;
Prospective
12 month:
74%
NA
NA

43
Rodrigues
et al., 2014
Adults with
hemiparesis
(61.1 ±7.5 y/o;
no range)
Against ABC
r=.59 and
BBS r=.78
Interrater:
BESTest
[ICC
(?)
= .93];
component
(.85-.96); n =
16
Test-retest:
BESTest [ICC
= .98];
component
(.71-.94); n =
16
NA
NA
NA
NA
NA
NA
Chinsongkr
am et al.,
2014
12 adults with
subacute stroke
(58.2; 24-90
y/o)
With BBS
(r=.96)
Interrater:
BESTest [ICC
(3, 1)
= .99]; No
component
results
reported; n =
12
Test-retest:
BESTest [ICC
(2, 1) = .96];
No
component
results
reported; n =
12
NA
NA
NA
NA
NA
NA
Chinsongkr
am et al.,
2014
49 adults with
subacute stroke
(58.2 y/o; 24-
90)
NA
NA
NA
10% of
balance
improvement
80.8%
87.5%
NA
NA
Chan and
Pang, 2015
Patients after
total knee
arthroplasty
(65+ y/o)
(n = 46)
Internal
consistency
α=0.98;
validated
against BBS,
Functional
Gait
Interrater:
BESTest [ICC
(2, 1)
= .99];
Component
(.98-1.00); n =
25
Test-retest:
BESTest
MDC =
6.2%
Component
: 22.71%; n
= 46
NA
NA
NA
NA
NA

44
Assessment
(FGA), and
ABC Scale
BESTest [ICC
(2, 1)
= .96];
Component
(.76-.96); n =
45
Huang et
al., 2016
28 community-
dwelling cancer
survivors
(68.4±8.1y/o)
ABC (r=.73)
Interrater:
BESTest [ICC
(2, 1)
= .96]; No
component
results
reported;
Test-retest:
BESTest [ICC
(2, 1) = .92];
No
component
results
reported
BESTest
MDC =
6.9%; No
component
results
reported
NA
NA
NA
NA
NA
Jacome et
al., 2016
46 participants
with COPD
(75.9±7.1 y/o)
Against ABC
(rho = 0.61)
Interrater:
BESTest [ICC
(2, 1)
= .85]; No
component
results
reported;
Intrarater:
BESTest [ICC
(2, 1)
= .87]; No
component
results
reported
6.3%
76.9%
64%
77%
NA
NA
Yingyongy
udha et al.,
2016
200 healthy
adults with or
without fall hx,
(70.2±7.0 y/o)
NA
NA
NA
66%
76%
50%
NA
NA

45
Anson et
al., 2017
58 adults with
fall history and
self-reported
balance
problem,
(78.1±7.0 y/o)
NA
Test-retest:
0.86
8.9
NA
NA
NA
NA
NA
Margues et
al., 2017
66 adults with
Type II Diabetes
Mellitus
(75±7.6 y/o)
Against ABC
(rho = 0.70)
NA
NA
81 points
68%
71%
NA
NA
Wang-Hsu
et al., 2018
Community-
dwelling older
adults (85/5.5
y/o; 70-94)
NA
Interrater:
BESTest [ICC
(2, 1)
= .97];
Component
(.85-.94); N =
32
Test-retest:
BESTest [ICC
(2, 1) = .93];
Component
(.72-.89); N =
70
BESTest
MDC =
8.2-point
(95%CI)
Component
: 2.1-3.4
point
(95%CI);
N = 70
NA
NA
NA
NA
NA

46
Outcome
Measure
Reference
Population/
Diagnosis
Psychometric property
Fall Predictability
Validity
Reliability
MDC
Cutoff score
Sn
Sp
PPV
NPV
BESTest-
Brief
Padgett et
al., 2012
13 adults with and 13
adults without
Multiple Sclerosis
NA
Interrater:
ICC = .99
NA
NA
100%
100%
NA
NA
Duncan et
al., 2013
80 participants with
Parkinson’s Disease,
(68.2±9.3 y/o); also
reported
Retrospective 6
month; Prospective 6
month: and
Prospective 12-
month LR+, LR-,
pretest probability of
falling, 6 month
posttest probability,
and 12 month
posttest probability
of falling
NA
NA
NA
11/24
(45.8%)
Retrospective
6 month:
76%;
Prospective 6
month: 71%;
Prospective
12 month:
53%
Retrospective
6 month:
84%;
Prospective 6
month: 87%;
Prospective
12 month:
93%
NA
NA
Chan and
Pang, 2015
Patients after Total
Knee Arthroplasty
(65+ y/o)
(n = 46) Internal
consistency
α=0.97; validated
against Berg
Balance Scale,
Functional Gait
Assessment
(FGA), and
Activities-
specific Balance
Confidence
(ABC) Scale
Interrater:
[ICC
(2, 1)
= .97]; n =
25
Test-retest:
[ICC
(2, 1)
= .94]; n =
45
MDC
= 3.2
point;
n = 46
NA
NA
NA
NA
NA
Jacobs et
al., 2015
42 adults with
Parkinson’s Disease
(67, range 64-70 y/o)
NA
NA
NA
14
70.6%
76.9%
NA
NA

47
Bravini et
al., 2016
244 adults with
balance disorders
(65.3±14.9 y/o)
Internal construct
validity using
Rasch analysis
demonstrated un-
fit model,
recommend item
1 not fit
Cronbach
α=0.89;
Interrater:
ICC
(2, 1)
= .90;
Test-retest:
ICC
(2, 1)
= .94
4.3
NA
NA
NA
NA
NA
Huang et
al., 2016
28 community-
dwelling cancer
survivors
(68.4±8.1y/o)
ABC (r=.81)
Interrater:
[ICC
(2, 1)
= .92];
Test-retest:
[ICC
(2, 1)
= .94];
MDC
= 2.55
point
NA
NA
NA
NA
NA
Jacome et
al., 2016
46 participants with
COPD (75.9±7.1 y/o)
Against ABC
(rho = 0.53)
Interrater:
[ICC
(2, 1)
= .97];
Intra-rater:
[ICC
(2, 1)
= .82];
MDC
= 4.9
16.5
81%
73%
NA
NA
Margues et
al., 2017
66 adults with Type
II Diabetes Mellitus,
(75±7.6 y/o)
Against ABC
(rho = 0.62)
NA
NA
15.5
67%
71%
NA
NA

48
Outcome
Measure
Reference
Population/
Diagnosis
Psychometric property
Fall Predictability
Validity
Reliability
MDC
Cutoff score
Sn
Sp
PPV
NPV
BESTest-
mini
Horak et al.,
2011
115 adults with
neurological disorders
Using Rasch
analysis to
select 14
items
NA
NA
NA
NA
NA
NA
NA
Padgett et al.,
2012
13 adults with and 13
adults with balance
deficits
NA
Interrater:
ICC = .99
NA
NA
71%
100%
NA
NA
Tsang et al.,
2013
106 post stroke and
48 control adults
participated (55+ y/o)
With BBS
(rho = 0.83)
Interrater:
ICC
(2, 1)
= .97
Test-retest:
ICC
(3, 1)
= .96; n =
22
3 point
17.5
64.0%
64.2%
NA
NA
Duncan et al.,
2013
80 participants with
Parkinson’s Disease,
(68.2±9.3 y/o); also
reported
Retrospective 6
month; Prospective 6
month: and
Prospective 12 month
LR+, LR-, pretest
probability of falling,
6 month posttest
probability, and 12
month posttest
probability of falling
NA
NA
NA
20/32
Retrospective
6 month:
88%;
Prospective 6
month: 86%;
Prospective
12 month:
62%
Retrospective
6 month:
78%;
Prospective 6
month: 78%;
Prospective
12 month:
74%
NA
NA
Godi et al.,
2013
93 participants with
various neurological
disorders (66.2±13.2
y/o)
Correlated to
BBS
Cronback
α=0.90;
Interrater:
ICC
(2, 1)
= .98;
Test-retest:
ICC
(2, 1)
= .96
3.5
NA
94%
81%
NA
NA

49
Chinsongkram
et al., 2014
49 adults with
subacute stroke (58.2
y/o; 24-90);
responsiveness of the
test
NA
NA
3 points
21
84.6%
87.5%
NA
NA
Chan and Pang,
2015
Patients after Total
Knee Arthroplasty
(65+ y/o)
(n = 46)
Internal
consistency
α=0.96;
validated
against BBS,
Functional
Gait
Assessment
(FGA), and
ABC Scale
Interrater:
[ICC
(2, 1)
= .96]
Test-retest:
[ICC
(2, 1)
= .92]; n =
45
MDC =
3.71
point; n
= 46
NA
NA
NA
NA
NA
Jacobs et al.,
2015
42 adults with
Parkinson’s Disease
(67 y/o, 64-70)
NA
NA
NA
21
82.4%
65.4%
NA
NA
Wallen et al.,
2016
112 adults with
Parkinson’s Disease
(72.8±5.5 y/o)
Structure
validity with
exploratory
factor
analysis
(EFA) and
Rasch
analysis;
recommend
omit item 7
NA
NA
NA
NA
NA
NA
NA
Ross et al.,
2016
52 adults with
Multiple Sclerosis
(45.7±5.7 y/o)
With BBS
(r=.79)
None
reported
None
reported
22.5 cutoff
for falls;
AUC = 0.77,
Positive
likelihood
ratio 2.86,
negative
NA
NA
NA
NA

50
likelihood
ratio 0.19
Huang et al.,
2016
28 community-
dwelling cancer
survivors 68.4±8.1y/o
ABC (r=.52)
Interrater:
[ICC
(2, 1)
= .86];
Test-retest:
[ICC
(2, 1)
= .90];
MDC =
2.39
point
NA
NA
NA
NA
NA
Jacome et al.,
2016
46 participants with
COPD
(75.9±7.1 y/o)
Against
ABC (rho =
0.55)
Interrater:
[ICC
(2, 1)
= .85];
Intrarater:
[ICC
(2, 1)
= .88];
MDC =
3.3
21.5
68%
65%
NA
NA
Schlenstedt et
al., 2016
66 adults with
Parkinson’s Disease
NA
NA
NA
19
0.52%
0.70%
NA
NA
Yingyongyudha
et al., 2016
200 healthy adults
with or without fall
history
(70.2±7.0 y/o)
NA
NA
NA
16
85%
75%
NA
NA
Anson et al.,
2017
58 adults with fall
history and self-
reported balance
problem, (78.1±7.0
y/o)
NA
Test-retest:
0.84
4.0
NA
NA
NA
NA
NA
Jorgensen et al.,
2017
46 ambulatory adults
with chronic spinal
cord injury (55±17
y/o)
Correlates to
BBS
(r=0.90)
NA
NA
19
55-82%
54-75%
NA
NA
Margues et al.,
2017
66 adults with Type II
Diabetes Mellitus
(75±7.6 y/o)
Against
ABC (rho =
0.63)
NA
NA
20.5
60%
71%
NA
NA

51
Outcome
Measure
Reference
Population/
Diagnosis
Psychometric property
Fall Predictability
Validity
Reliability
MDC
Cutoff score
Sn
Sp
PPV
NPV
Brunel Balance
Assessment
Tyson &
DeSouza,
2004
Reliability testing (n
= 37, mean age 66)
Validity testing (n =
55, mean age 68 y/o)
Correlation
coefficients 0.83
for Motor
Assessment Scale,
0.97 with Berg
Balance Test and
0.95 with
Rivermead
Mobility Index
100%
agreement (K=
1) for both test
retest reliability
and inter-tester
reliability.
1(stroke)
Score ranges
from 0/12
(lowest) to
12/12
(highest)
NA
NA
NA
NA
Tyson, et al.
2007
Post CVA, n=75,
(mean age 70 y/o)
Findings of this
study confirm the
predictive validity
of the BBA
NA
NA
NA
NA
NA
NA
NA

52
Outcome
Measure
Reference
Population/
Diagnosis
Psychometric property
Fall Predictability
Validity
Reliability
MDC
Cutoff score
Sn
Sp
PPV
NPV
Canadian
Occupational
Performance
Measure
(COPM)
McColl et
al., 2000
Disabled
adults (18-75
y/o);
n = 61
Construct validity with
Satisfaction with Performance
Scaled Questionnaire (SPSQ),
Reintegration to Normal
Living Index (RNL), Life
Satisfaction Scale (LSS) at
p<.0005, correlations .37 - .46
Criterion validity with
Perceived Problem Check List
(PPCL): Frequency of reported
problems: PPCL COPM
Selfcare 60% 46%
Productiv22% 23%
Leisure 9% 31%
NA
NA
NA
NA
NA
NA
NA
Sewell &
Singh,
2001
COPD,
pulmonary
rehabilitation
outpatient
(53-79 y/o)
n = 15
NA
Mean differences:
Performance =.14,
Satisfaction = 42,
CI 95%
Intraclass
correlation
coefficients:
Performance r =
0.92; Satisfaction
r = 0.90, p<.0001
NA
NA
NA
NA
NA
NA
Cup et al.,
2003
Stroke, s/p 2
month, (26-83,
mean 68 y/o)
n = 26
Discriminant validity with: BI,
FAI, SA-SIP30, EQ-5D,
Rankin Scale r = -0.225, -
0.115, 0.102, 0.143, 0.209
respectively
Test-retest
reliability rho =
Performance .89
&
Satisfaction .88 at
p<0.001
NA
NA
NA
NA
NA
NA
Dedding et
al., 2004
Neurological
and orthopedic
adults
n = 99
Divergent validity with SIP68
Performance r = -0.20, p =
0.05; Satisfaction r = -0.19, p
= 0.07; Convergent validity
with Disability & Impact
NA
NA
NA
NA
NA
NA
NA

53
Profile (DIP) 63%
corresponding items
Eyssen et
al., 2011
Various
diagnoses in
adult
outpatient
clinics
n = 138
(51±13 y/o)
Construct validity with SIP68,
DIP & Impact on Participation
and Autonomy (IPA) p =
<0.01
NA
NA
NA
AUC
0.79
to
0.85
NA
NA
NA

54
Outcome
Measure
Reference
Population/
Diagnosis
Psychometric property
Fall Predictability
Validity
Reliability
MDC
Cutoff score
Sn
Sp
PPV
NPV
Clinical
Test of
Sensory
Interaction
& Balance
(CTSIB);
Di Fabio &
Badke,
1990
Stroke
patients,
university
hospital
(29-70 y/o),
n = 10
Construct validity
with Fugl-Meyer
Sensorimotor
Assessment (FMSA)
Sensory rho = .55,
P< .05
Balance rho = .77,
p<.01
Total LE rho = .69,
p<.05
Interrater
reliability
Kappa .95,
P<.05
NA
NA
NA
NA
NA
NA
(also called
SOT in ‘90s
but with
same
protocol on
level
ground)
Anacker &
Di Fabio,
1992
Community-
dwelling
elders; Fallers
& non-fallers
(65-96 y/o)
n = 47
Construct validity
with Get Up and Go
Test (GUGT)
Spearman Rho =
-.67 fallers; -.44
non-fallers
Test retest
reliability r
= .75, p<.05
NA
NA
NA
NA
NA
NA
Cohen et
al., 1993
Healthy adults
3 age groups
vestibular
dysfunction
adults - 4
th
group
Healthy n =
15; (25-85
y/o)
Vestibular n =
17; (30-87
y/o)
Predictive validity
of scores between
the 2 groups.
Condition 5 t = 4.17,
P<.001
Condition 6: t
=5.58, P<.001
Test-retest
reliability &
interrater
reliability r
= .99, p<.01
NA
NA
NA
NA
NA
NA
Di Fabio &
Anacker,
1996
Community-
dwelling
elders
(65 -96 y/o).
16 Fallers, 31
No-Fallers
Construct validity:
Discriminant
functions classified:
Non-fallers: 77%
Fallers: 63%
NA
NA
< 250 sec
Identifying
fallers
44%
90%
NA
NA

55
El-Kashlan
et al., 1998
Two Groups:
Healthy adults
& Vestibular
Dysfunction
Normal: (20-
79 y/o)
N =69
Vestibular:
(20-70 y/o); N
= 35
Construct validity
with Dynamic
Posturography
(SOT) on Balance
Master
Baseline: r = 0.41,
P≤0.018
1 month: r = .74,
P≤0.000
2 months: r = 0.89,
P≤ 0.000
3 months: r = .41,
P≤0.034
NA
NA
NA
Sensitivity
of 60% in
identifying
vestibular
dysfunctio
n
NA
Normal
CTSIB: 89
%
Abnormal
CTSIB:
55%
NA
Bernhardt
et al., 1998
Stroke, acute
IP
(71.8± 10.5
y/o)
N =29
Correlations
( Pearson’s r) with
Locomotion
Measures (Step
Test, gait velocity,
Motor Assessment
Scale ) >.40,
p<0.0036
NA
NA
NA
NA
NA
NA
NA
Freeman
DL, 2018
Parkinson’s
Disease,
Idiopathic
Parkinson’s
Disease
(62.7±13.5
y/o)
N = 26
Concurrent validity
with Instrumented
mCTSIB & SOT
Composite Score =
r=-.43, p=0.03 to
0.64, p=<.001
Condition 1=
r=0.43, p.0.03
Condition 2=
r=0.16, p=0.43
Condition 3 r= -.60,
p=<.001
Condition 4 r= 0.54,
p=<.001
Differentiation
between fallers/non-
fallers mean score
P=0.04
NA
NA
NA
NA
NA
NA
NA

56
Cohen HS,
2019
Community-
dwelling
outpatient
screen for
vestibular
disorders
n=292 healthy
controls
n=90
vestibular
patients
NA
NA
NA
NA
NA
NA
Individual
Test: ROC
values
0.67-0.84
yaw &
pitch head
movements
NA

57
Outcome
Measure
Reference
Population/
Diagnosis
Psychometric property
Fall Predictability
Validity
Reliability
MDC
Cutoff score
Sn
Sp
PPV
NPV
Community
Balance &
Mobility Scale
(CB&M)
Howe et
al, 2006
TBI, undergoing
inpatient and
outpatient
neurorehabilitation
N = 36
Phase 1 (31±9 y/o)
Phase 2 (34±12
y/o)
Content validity with
Therapist Global Rating
Scale r = 0.62, P<0.001
Construct validity with
self-paced gait & max
gait velocity; r =0.53
and r =0.64 at P<0.001
respectively
Inter, inter, test-
retest reliability
& internal
consistency
ICCs of 0.977,
0.977, 0.975 &
Cronbach’s
alpha 0.96
respectively
9.6 (SEM &
Cronbach’s a
NA
NA
NA
NA
NA
Knorr et
al., 2010
Stroke community-
dwelling &
ambulatory
(62.6±12 y/o)
N = 44
Convergent validity
with BBS, TUG,
Chedoke McMaster
Stroke Assessment
(CMSA)
TUG &BBS P<.01, p
= .70 -.83
CMSA, p= .67 at
P<.001
NA
Sensitivity to
change,
SRM = .83
(ratio of mean
change in
scores divided
by SD of
change
scores), P =
<.001
NA
NA
NA
NA
NA
Inness et
al., 2011
Traumatic brain
injury inpatient and
outpatient private
clinic undergoing
neurorehabilitation,
ambulatory
(18-60 y/o)
N = 35
Construct validity with
Spatiotemporal Gait
measures, ABC and
Community integration
Questionnaire (CIQ)
CIQ r = 0.54, p<0.001
ABC r = 0.60, p 0.011
Spatiotemporal Gait
Measures p < 0.05;
moderate to excellent
correlation with
velocity, step length,
step width, step time;
correlation with
dynamic instability, step
time & step with
variability, p<0.001
NA
NA
NA
NA
NA
NA
NA

58
Weber et
al., 2018
adults (60-70 y/o)
participants
correlated with multiple
other outcome measures
including TUG;
Internal consistency
alpha = 0.88
Interrater ICC2,
k = 0.97; Intra-
rater ICC3, k =
1.00
NA
NA
NA
NA
NA
NA
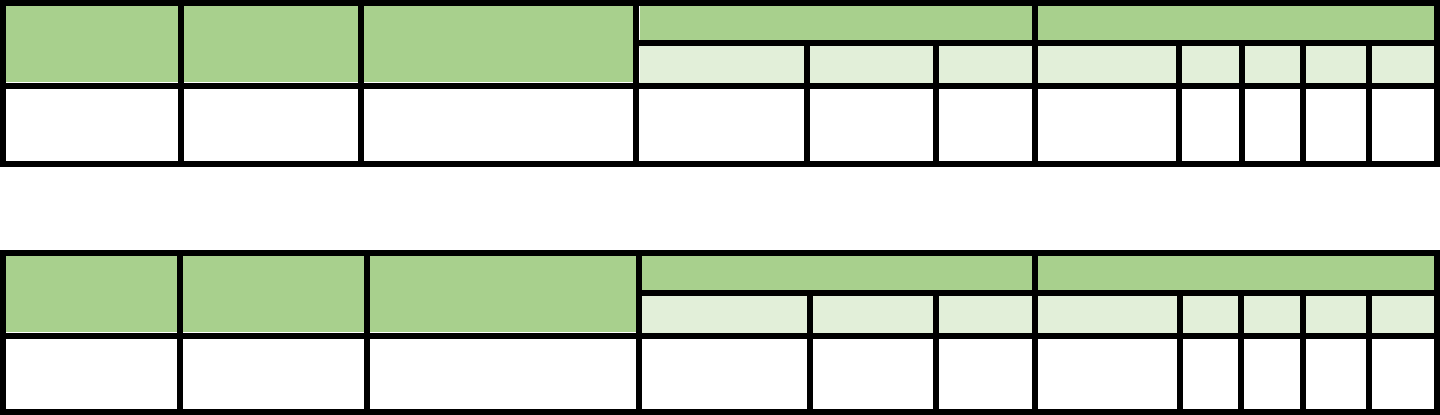
59
Outcome
Measure
Reference
Population/
Diagnosis
Psychometric property
Fall Predictability
Validity
Reliability
MDC
Cutoff score
Sn
Sp
PPV
NPV
CONFbal
Simpson et al
2009
Older people (mean 81 y/o)
in day centers
Cronbachs alpha
0.91
ICC 0.95
3 points
NA
NA
NA
NA
NA
Outcome
Measure
Reference
Population/
Diagnosis
Psychometric property
Fall Predictability
Validity
Reliability
MDC
Cutoff score
Sn
Sp
PPV
NPV
Conley Scale
Palese et al., 2016
Acute Medical Unit (>65
y/o)
Cronbachs alpha
0.465
ICC 0.95
3 points
NA
60.0
55.9
NA
98.5

60
Outcome
Measure
Reference
Population/
Diagnosis
Psychometric property
Fall Predictability
Validity
Reliability
MDC
Cutoff score
Sn
Sp
PPV
NPV
Demura’s
Fall Risk
Assessment
Chart
(DFRA)
Demura et
al., 2010
Healthy
community-
dwelling
adults (≥ 60
y/o)
With Tokyo
Metropolitan
Institute of
Gerontology
(TMIG)
NA
NA
≥ 1 point of
each of 5 risk
factor scores;
14.4% (total
score); 39.7%
(independent
risk factor
scores)
NA
Odds ratios
calculated for
each risk factor
score & total
score; ≥
3 points = odds
ratio of ≥ 5
NA
Demura et
al., 2012
Healthy
community-
dwelling
adults (≥60
y/o)
With TMIG
NA
NA
Overall score
22 pts
PF-3 score 1
point
Pf-4 score 2
pts
.306;
AUC .68(CI
95%)
.869; AUC .797
(CI 95%)
.869; AUC .946
(CI 95%)
.072
.657
.906
NA
NA
Demura et
al., 2011
Healthy
community-
dwelling
adults (≥ 60
y/o)
NA
Total score =
Test –retest
ICC .956, N
= 172
NA
Total Score >2
pts
NA
NA
Total Score OR
5
NA
Demura et
al., 2013
Healthy
community-
dwelling
adults (≥ 60
y/o)
NA
NA
NA
Potential for
falling 1 point
Physical
function 10 pts
Diseases &
Physical 5 pts
Behavior &
character 3 pts
Environment 1
point
.87; AUC .80
(CI 95%)
.40; AUC .63
(CI 95%)
.30; AUC .63
(CI 95%)
.53; AUC .67
(CI 95%)
.78; AUC .54
(CI 95%)
.66
.81
.87
.75
.27
NA
NA

61
Outcome
Measure
Reference
Population/
Diagnosis
Psychometric property
Fall Predictability
Validity
Reliability
MDC
Cutoff score
Sn
Sp
PPV
NPV
Downton
Fall Risk
Index
Nyberg et
al., 1996
Geriatric stroke
rehabilitation unit
≥ 3 high fall risk
91%
27%
44.4%;
Odds ratio
3.5
81.5%
Rosendahl
et al., 2003
Residential care
facility (81± 6 y/o);
47% dementia 45%
depression 32%
stroke
≥ 3 high fall risk
91%
39%
36% fall
risk high
risk group;
5% low
risk group
Vassallo et
al., 2008
Geriatric general
rehabilitation ward
Predictive validity
with STRATIFY
no significant
difference
≥ 3 high fall risk
92.2%
CI
95%;
35/8%
CI
95%
33.1% CI
95%
92.9%
CI
95%
Bueno-
Garcia et
al., 2017
Public hospital; all
diagnoses
Poor external
validity in this
population
58%
62%
1%; odds
ratio 2.31
99%
Mojtaba et
al., 2018
6650 hospitalized
patients
Among individual
modules, only
previous falls (IRR
2.58, 95% CI 2.22
to 3.01) and
unsafe gait (IRR
1.79, 95% CI 1.53
to 2.09) were
associated with
fall-related injuries.
The cutoff
3 points
significantly
associated with
fall-related injury
(IRR 1.94,
95% CI 1.60 to
2.38).
Majtaba et
al., 2019
Australian hospital,
(>65 y/o)
n= 6650
Stratified analysis
by gender
Concurrent validity
with fall-related
injuries & high fall
risk at 6 months
IRR 1.94, 95% CI
1.60-2.38
≥3 pts

62
Stratified Analysis
higher risk for men
95% CI

63
Outcome
Measure
Reference
Population/
Diagnosis
Psychometric property
Fall Predictability
Validity
Reliability
MDC
Cutoff score
Sn
Sp
PPV
NPV
Dynamic
Gait Index
(DGI)
Shumway-
Cook et al.,
1997
Community-
dwelling adults (≥
65 y/o)
Balance Self-
Perceptions Test,
Berg Balance Test r
= .76
Interrater r = .96; Test-
retest r = .98; N = 44
NA
≤ 19 pts
59%
64%
NA
NA
Whitney et
al., 2000
Adults (mean age
62.5 y/o) with
vestibular disorder
NA
NA
NA
≤ 19 pts
Odd
ratio
2.58
at
95%
NA
NA
NA
Whitney et
al., 2003
Outpatient
vestibular and
balance dysfunction
(Ages 14-88 y/o)
With Berg Balance
Scale; r = .71; p < .01
NA
NA
NA
NA
NA
NA
NA
Wrisley et
al., 2003
Outpatient
vestibular disorders
(Ages 27-88 y/o)
NA
Interrater k = .68;
Spearman Rho r = .95,
P < .0001; N = 30
NA
NA
NA
NA
NA
NA
Whitney et
al 2004
Outpatient
vestibular disorders
(Ages 14-90 y/o)
NA
NA
NA
≤ 18 pts for
previous 6
month fall
70%
51%
NA
NA
Hall et al.,
2004
Outpatient
unilateral vestibular
hypofunction (Ages
28-86 y/o)
NA
NA
NA
NA
77%
90%
NA
NA
Legters et
al., 2005
Outpatient,
peripheral
vestibular disorder;
(Ages 24-87 y/o)
With Activities-
specific Balance
Confidence Scale
(ABC); Total Sample:
r = .58 (p < .0001);
Mild-Mod vestibular
weakness: r = .72 (p
< .0001;
NA
NA
NA
NA
NA
NA
NA

64
Severe-Total
vestibular weakness: r
= .48 (p < .0001)
McConvey
et al., 2005
Individuals with
Multiple Sclerosis
With 6.1 m Timed
Walk; -.801, P<.01
Interrater .983 (P<.05);
Intra-rater
reliability .910-.976 (p
= .05); N =10
NA
NA
NA
NA
NA
NA
Dibble &
Lange, 2006
Individuals with
Idiopathic
Parkinson’s
Disease; (Ages 39-
90 y/o)
NA
NA
NA
Previous
research: ≤ 19
Current
research: 22
.75
.89
.30
.48
NA
NA
Hall &
Herdman,
2006
Adults with
peripheral
vestibular disorders
NA
Test-retest ICC 3,1
= .86
NA
NA
NA
NA
NA
NA
Marchetti &
Whitney,
2006
Individuals with
and without
vestibular and
balance dysfunction
(Ages 14-91 y/o)
4-Item Test
Cronbach’s alpha .89
8-Item Test
Cronbach’s alpha .92
Interrater Kappa .54
- .80
NA
4-Item test
<12
8-Item Test <
19
85%
86%
75%
86%
NA
NA
Cattaneo et
al., 2006
Individuals with
Multiple Sclerosis;
(mean age = 45 y/o)
Berg Balance
Scale .78 TUG.72
Hauser De-
ambulation Index .8
Dizziness Handicap
Inventory
-.39; ABC .54
NA
NA
NA
NA
NA
NA
NA
Jonsdottir et
al., 2007
Individuals with
stroke,
rehabilitation
outpatient
With Berg Balance
Scale r = .83
ABC r = .68
Timed Walking Test r
= -.73
TUG r =-.77
Test-retest ICC .96
Interrater reliability
ICC .96
N = 25
NA
NA
NA
NA
NA
NA

65
Cakit et al.,
2007
Individuals with
Idiopathic
Parkinson’s Disease
With UPDRS motor
subscale
r = -.643, p < .01
Fall history
R = .643, p < .01
NA
NA
NA
NA
NA
NA
NA
Landers et
al., 2008
Individuals with
Idiopathic
Parkinson’s Disease
Discriminant: fallers
16.1 SD = 3.4
Non-fallers 19.6 SD =
2.6, p < .01
NA
NA
NA
NA
NA
NA
NA
Lin et al.,
2010
Individuals with
stroke, outpatient
rehabilitation
With DGI-4 &
Functional Gait
Assessment r > .91
Test-Retest ICC .94
(CI 95%)
4.0
NA
NA
NA
NA
NA
Jonsson et
al., 2011
Hospital and
outpatient
rehabilitation center
with fall hx (≥ 65
y/o)
NA
Hospital: Intra-rater
ICC .90
Interrater ICC .92; N
=24
Rehabilitation Center:
Intra-rater ICC .89
Interrater ICC .82: N =
24
NA
NA
NA
NA
NA
NA
Huang et al.,
2011
Outpatient
individuals with
movement disorders
(mean age 67.5 y/o)
NA
Test-Retest ICC .84
(CI 95%)
2.9
(13.3)
NA
NA
NA
NA
NA
Romero et
al., 2011
Community-
dwelling, fall or
near fall history (>
65 y/o)
NA
NA
2.9
(95%)
NA
NA
NA
NA
NA

66
Outcome
Measure
Reference
Population/
Diagnosis
Psychometric property
Fall Predictability
Validity
Reliability
MDC
Cutoff score
Sn
Sp
PPV
NPV
Elderly
Fall
Screening
Test
Cwikel et
al. 1998
Community-
dwelling
adults (> 60
y/o)
Concurrent with
physician examination
Predictive with f/u
interview
NA
NA
2+
83%
physician
69%
physician
66.7%
(physician);
RR > 3.0 for
fall related
parameters
NA
Outcome
Measure
Reference
Population/
Diagnosis
Psychometric property
Fall Predictability
Validity
Reliability
MDC
Cutoff score
Sn
Sp
PPV
NPV
Elderly
Mobility
Scale
Smith et
al., 1994
Frail elderly
(70-93 y/o)
With Barthel Index
(BI) (Spearman’s
Rho .962);
Functional
Independence
Measure (FIM)
(Spearman’s
Rho .948)
NA
NA
NA
NA
NA
NA
NA
Prosser et
al., 1997
Hospitalized
elders; N = 66
With Barthel Index (r
= .79, p < .0001)
Interrater .88,
p < .0001
NA
NA
NA
NA
NA
NA
Spilg et al.,
2003
Community-
dwelling and
residential
care elderly
with mobility
problems
(≥ 60 y/o)
EMS, Functional
Reach and Barthel
Index at discharge,
significantly
associated with the
risk of having two or
more falls (p = 0.008,
0.017 and 0.031)
NA
NA
Low risk ≥
20
for recurrent
falls s/p DC
from
geriatric Day
Program
NA
NA
NA
NA
Yu et al.,
2007
Elders,
residential
homes
NA
NA
NA
Functional
Mobility
13/14
93.3%/CI
95%
93.3%
CI 95%
NA
NA
Nolan et
al., 2008
Acute
hospitalized
(≥ 55 y/o)
Modified Rivermead
Mobility Index
(MRMI)p= .887, p
< .05, CI 95%
Intra-
reliability 0.72
NA
NA
NA
NA
NA
NA

67
Outcome
Measure
Reference
Population/
Diagnosis
Psychometric property
Fall Predictability
Validity
Reliability
MDC
Cutoff score
Sn
Sp
PPV
NPV
Euroqual (EQ-
5D
Brazier J et
al., 1993
General practice
patients; (16-70
y/o); n=1980
Concurrent
validity with SF-
36
Construct validity:
no statistics
presented
Spearman Rank
correlation coefficient
range 0.48-0.60
(p<0.01)
NA
Poor
sensitivity at
the high
ceiling
NA
NA
NA
NA
Van Agt HM
et al., 1994
General population
n=208
NA
Test-retest analysis
NA
NA
NA
NA
NA
NA
Outcome
Measure
Reference
Population/
Diagnosis
Psychometric property
Fall Predictability
Validity
Reliability
MDC
Cutoff score
Sn
Sp
PPV
NPV
Fall Perception
Questionnaire (F
RAQ)
Goncalves et
al., 2017
Community-
dwelling older
adults (> 60 y/o); 3
focus groups of 3-5
participants
Methodological
quantitative study
with VC to evaluate
item content,
representativeness
of the measure
based on analysis of
3 judges
Content validity
coefficient
(VC): .71-.80 for
the 3 categories
NA
NA
NA
NA
NA
NA
NA
Outcome
Measure
Reference
Population/
Diagnosis
Psychometric property
Fall Predictability
Validity
Reliability
MDC
Cutoff score
Sn
Sp
PPV
NPV
Falls Handicap
Inventory
Rai et al.,
1995
28 hospital patients
with fall history (78
± 5.6 y/o)
validated with fall
efficacy scale (r =
-7.5, p< 0.0001)
NA
NA
NA
NA
NA
NA
NA

68
Outcome
Measure
Reference
Population/
Diagnosis
Psychometric property
Fall Predictability
Validity
Reliability
MDC
Cutoff score
Sn
Sp
PPV
NPV
Falls
Prevention
Strategy
Survey
Finlayson ML,
Peterson EW,
Fujimoto KA,
Plow MA,
2009
Adults with
Multiple
Sclerosis
Rasch Validation:
Analysis indicated that the
rating scale structure (i.e.,
response options) was valid. Of
the original 19 items, 8 of them
misfit and needed to be
dropped to obtain a valid
instrument under the Rasch
model. With the final 11 items,
the instrument was able to
distinguish participants of
different ability levels across a
range of 11.58 logits.
NA
NA
NA
NA
NA
NA
NA
Outcome
Measure
Reference
Population/
Diagnosis
Psychometric property
Fall Predictability
Validity
Reliability
MDC
Cutoff score
Sn
Sp
PPV
NPV
Fall Risk for
Older People
in the
Community
(FROP-COM)
Russell, M et
al., 2008
Community-
dwelling
older adults
(> 60 y/o)
27 days post
ED
n = 20
(reliability)
n = 34
(predictive)
n = 20 concurrent study with;
Functional Reach: r = .50 95%
CI
TUG: r =.62 95% CI
Inter-
reliability .8
1 & intra-
reliability.9
3, 95% CI
NA
18/19
71.3
%
95%
CI
56.1
95%
CI
NA
NA

69
Outcome
Measure
Reference
Population/
Diagnosis
Psychometric property
Fall Predictability
Validity
Reliability
MDC
Cutoff score
Sn
Sp
PPV
NPV
Fall
Behavior
Scale
Clemson et
al., 2003
Community-dwelling older
adults. nursing home and
hospital-based residents
excluded
Content validity index
28/30 items, CVI=93;
Construct validity: scores
positively associated with
increasing age (rs = .46,
p <.01);
negatively associated
with physical mobility
(rs = .68, p <.01)
Test-retest
reliability ICC
=.94 (p<.01)
NA
no cutoff
scores
established
NA
NA
NA
NA

70
Outcome
Measure
Reference
Population/
Diagnosis
Psychometric property
Fall Predictability
Validity
Reliability
MDC
Cutoff score
Sn
Sp
PPV
NPV
Falls
Efficacy
Scale - Int
Yardley et
al., 2005
Community-
dwelling
older adults
NA
Excellent
internal and test-
retest reliability
Cronbach’s
alpha .96
(ICC .86)
NA
NA
NA
NA
NA
NA
Delbaere et
al., 2010
Community-
dwelling
older adults
(mean age
77.4 y/o)
Content Validity: .93
Positive associated with associated with
increase in age
(r
s
=46, p<.01)
Neg association with greater physical
mobility (r
s=
-.68, p<.01)
and leaving the home more often in the
past week (r
s=
-.51, p<.01)
ICC=.79
NA
Fall concern:
16-19 low
concern
20-
27=moderate
concern
28-64 high
concern
NA
NA
NA
NA
Hauer et al.,
2010
Cognitively
impaired
older adults
(mean age
82.5 y/o)
NA
Test-retest
ICC .96
NA
NA
NA
NA
NA
NA
Hauer et al.,
2011
Older adults
without
cognitive
impairment
(mean age
81.6 y/o)
NA
Test-retest
ICC .58 to .92
Excellent
internal
consistency
(Cronbach’s
alpha=.92)
NA
NA
NA
NA
NA
NA
Morgan et
al., 2013
Vestibular –
(mean age 54
y/o)
Criterion validity:
excellent correlations with Activities
Balance Confidence Scale (ABC)
(scores: -.84
Dizziness Handicap Inventory (DHI)
r=.75
Vestibular Activities and Participation
(VAP) (r=.78)
Adequate correlations: gait speed
(r=-.55)
Dynamic Gait Index (DGI) (r=-.55)
Test-retest
ICC .94
8.2
NA
NA
NA
NA
NA

71
Dewan and
MacDermid,
2014
Community-
dwelling
older adults
NA
Test-retest
ICC .96
NA
NA
NA
NA
NA
NA
Visschedijk
et al., 2015
Older adults
s/p hip
fracture
(mean age
83.1 y/o)
Internal consistency 3rd or 4th week
after SNF admission = (Cronbach’s
alpha = .94)
Inter-rater
reliability
ICC.72
17.7
NA
NA
NA
NA
NA
FES-I
short
Kempen et
al., 2008
Community-
dwelling
older adults
(> 60 y/o)
Correlation with FES-I = .97
Internal and test-
retest reliability
excellent with
Cronbach’s
alpha .92
(ICC .83)
NA
NA
NA
NA
NA
NA

72
Outcome
Measure
Reference
Population/
Diagnosis
Psychometric property
Fall Predictability
Validity
Reliability
MDC
Cutoff score
Sn
Sp
PPV
NPV
Fear
Avoidance
Beliefs
Questionnaire
Chugh EJ et
al., 2013
55 patients
with LBP
(mean age =
46 y/o, range
19-76)
Construct Validity
FABQ-P
-with FABQ-W significant
correlation (r=0.496 p=0.00)
-with VAS significant
correlation (r=0.0320
p=0.017)
-with FABQ total significant
correlation (r=0.794 p=0.00
-with RMDQ Roland Morris
Disability Questionnaire
significant correlation
(r=0.372 p=0.005)
-with Osteresky Disability
Questionnaire
no significant correlation
(r=0.199 p=0.146)
NA
NA
NA
NA
NA
NA
NA
Dedering &.
Börjesson,
2013
46 patients
with cervical
radiculopathy
(Age-49± 9.8
y/o); 41
healthy
participants
(Age-44±6.6
y/o)
FABQ has concurrent validity
for patients with cervical
radiculopathy
Good correlation (spearman
correlation coefficient >0.50)
between FABQ-PA with TSK
(0.62)
Poor correlation between TSK
with FABQ-W (0.32) and
FABQ-SUM (0.47)
Test retest
reliability:
Good to moderate
for FABQ
Weighted kappa
values (k-value is
good if >0.60)
FABQ-PA -0.50
FABQ-W-0.67
(good)
FABQ SUM-0.68
ICC of FAQB SUM
-0.93
Internal consistency
Cronbach’s Alpha =
0.89
NA
NA
NA
NA
NA
NA

73
Merrill et al.,
2016
64
participants
with or
without
pathology
ROC Curves & area under
curve:
Fallers at 1yr after assessment,
95%CI 0.62-0.91;
frequent fallers at 1 year after
assessment, 95%CI 0.70-0.95
Predictor variables used:
Physical -BBS, TUGT, SSGS,
DGI, SOT
: Psychological -ABC, FABQ,
FES
ABC and FABQ were the best
at predicting future falls both
independently and when
compared against other
predictor variables.
NA
NA
NA
NA
NA
NA
NA

74
Outcome
Measure
Reference
Population/
Diagnosis
Psychometric property
Fall Predictability
Validity
Reliability
MDC
Cutoff score
Sn
Sp
PPV
NPV
Figure 8
Walk
Test
Hess et al.,
2010
51
community-
dwelling older
adults
(Mean
age=76.8±5.5
y/o)
NA
Interrater reliability
ICC (95% CI)
For time: 0.90
For number of steps: 0.92
For smoothness: 0.85
Test retest reliability
ICC values (95%CI)
For time: 0.84
For number of steps: 0.82
For smoothness: 0.64
NA
NA
NA
NA
NA
NA
Wong et
al., 2013
64 subjects
(35 with
chronic stroke
and 29 healthy
elderly)
NA
Excellent intra-rater, inter-
rater and test–retest
reliabilities (CC range
0.944–0.999)
NA
8.2 seconds
100
%
89.2
%
NA
NA
Welch et
al., 2016
428 primary
care patients
(>65 y/o,
Median age =
76.5 y/o)
NA
NA
NA
poorer
performance
of F8WT by
1 second was
associated
with 8%
greater rate
of falls
(RR=1.08,
CI: 1.03–
1.14)
NA
NA
NA
NA
Barker et
al., 2019
74 older adults
(> 55 y/o) one
year s/p Total
Knee
Arthroplasty
in both home
care and
outpatient
setting
F8W and TUG were
correlated for the overall
sample (r = 0.921) and
subgroups: Home (r = 0.945)
and Clinic (r = 0.911). F8W
and Timed walk test were
correlated for the overall
sample (r = 0.834) and
subgroups, Home (r = 0.864)
and Clinic (r = 0.793)
Intra-rater reliability at
95% - 1.8 sec.
Inter-rater reliability at
95%, 1.2 sec.
NA
NA
NA
NA
NA
NA

75
Outcome
Measure
Reference
Population/
Diagnosis
Psychometric property
Fall Predictability
Validity
Reliability
MDC
Cutoff score
Sn
Sp
PPV
NPV
Floor Rise
Test (Supine
to stand
test)
Klima et al
2016
Community-
dwelling adults
NA
gait speed (r =
−.61; p < .001)
grip strength (r =
−.30; p < .05)
Timed Up and Go
(TUG) performance
(r = .71; p < .001)
NA
NA
NA
NA
NA
NA
Outcome
Measure
Reference
Population/
Diagnosis
Psychometric property
Fall Predictability
Validity
Reliability
MDC
Cutoff score
Sn
Sp
PPV
NPV
Fullerton
Advanced
Balance
Scale (FAB)
Rose et al.,
2006
46 community-
dwellers
31 with known
balance issues
and 15 without
balance issues
NA
Test re-test
0.96
Inter-rater
0.94-0.97
Intra-rater
0.97-1.00
NA
NA
NA
NA
NA
NA
Hernandez
& Rose,
2008
Independently
functioning older
adults
NA
NA
NA
25/40 points
74.6%
52.6%
8% increase
in chance of
falls with
each 1 point
decrease in
score
NA
Schlenstedt
et al., 2015
Idiopathic
Parkinson’s
Disease
(>40 y/o)
Spearman 0.87
Inter and intra 0.99
NA
NA
NA
NA
NA
NA
Chauhan &
Padnani,
2019
Post-stroke,
independent
ambulatory
Concurrent
validity with
BBS Spearman
correlation
coefficient (r)
0.86 p < 0.01
Spearman correlation
coefficient (r) for intra
rater reliability is 0.96;
p <0.01; inter rater
reliability Spearman
correlation coefficient
(r) is 0.972, p < 0.01.
NA
NA
NA
NA
NA
NA

76
Outcome
Measure
Reference
Population/
Diagnosis
Psychometric property
Fall Predictability
Validity
Reliability
MDC
Cutoff score
Sn
Sp
PPV
NPV
Functional
Ambulation
Category
Mehrholz et
al., 2007
Acute stoke,
inpatient
rehabilitation
setting
NA
Test re-test
Kappa .950
Inter-rater
Kappa .905
NA
FAC score ≥4
predicted community
ambulation following
4 weeks of rehab at 6
months
100% for
community
ambulation
78%
for
community
ambulation
NA
NA

77
Outcome
Measure
Reference
Population/
Diagnosis
Psychometric property
Fall Predictability
Validity
Reliability
MDC
Cutoff score
Sn
Sp
PPV
NPV
Functional
Gait
Assessment
Wrisely et
al 2004
Vestibular
(mean age
58.7 y/o)
Criterion Validity:
Excellent concurrent validity
with: Perception Dizziness
Symptoms: (r=-.70);
Dizziness Handicap
Inventory (r=-.64)
ABC (r=.64); number of falls
in previous 4 weeks (r=-.66),
DGI (r=.80); adequate with
TUG (r=-.50)
Excellent
interrater
reliability
(ICC.84)
8 points
from
admissio
n to
follow up
NA
NA
NA
NA
NA
Walker et
al., 2007
Community-
dwelling
adults
healthy (aged
40-89 y/o)
NA
Excellent
Interrater
reliability
(ICC=.93;
p<.001)
NA
NA
NA
NA
NA
NA
Thieme et
al., 2009
Adults (mean
age 69.9 y/o)
max 6 month
s/p CVA
Construct validity:
excellent correlation (p<.001)
with Functional Ambulatory
Category (.83), gait speed
(.82), Berg Balance Scale
(.93), Rivermead Mobility
Index (.85), Barthel Index
(.71).
Excellent
Interrater
reliability
(ICC=.94)
NANA
NA
NA
NA
NA
NA
Wrisley &
Kumar,
2010
Community-
dwelling
older adults
Concurrent Validity and
statistical significance
excellent with BBS r=.84
(P<.000); TUG r=.84
(P<.000); with ABC scale
r=.53 (P<.001).
Predictive validity: correctly
identified 6/7 unexplained
falls in the 6 months s/p the
test
NA
NA
<22/30
predicting falls
<20/30 predict
falls in next 6
months
85%
100
%
86%
76%
(+) LR
3.6
PPV:
58%
(+) LR
5.8
PPV:
43%
(-) LR
0
(-) LR
NPV
100%

78
Lin et al.,
2010
Adults (mean
age 54.9 y/o)
acute and
chronic CVA
Convergent validity:
Excellent statistical
association at 1st week, 2
months and 5 months post
therapy with 10MWT
(r=.61-.87) and PASS
(r=.74-.85)
Excellent test-
retest
reliability
(ICC=.95,
95% CI)
4.2 (5
point)
14.4%
change
NA
NA
NA
NA
NA
Leddy et
al., 2011
Community-
dwelling
older adults
with
Parkinson’s
Disease
NA
Test-retest
reliability
administered
by student:
excellent (ICC
=.80; 95%
CI=.58-.91)
administered
by a PT
excellent
(ICC=.9; 95%
CI=.80-.96
Interrater
reliability
(ICC=.93;
95% CI
=.84-.98)
NA
<15/30
predictive of
fall
72%
78%
(+) LR
3.24
PPV
59.6%
(-) LR
.36
NPV
14.1%
Ellis et al.,
2011
Adults with
Parkinson’s
Disease
Concurrent validity and
statistical sig Excellent with:
Berg Balance Scale (r=.77),
PDQ-39 mobility subsection
(r=. -66), postural instability
score (r=-.68)
Adequate with PDQ39 total
score (r=-.57), age (r=-.44),
bradykinesia composite score
(r=-.55), freezing of gait
score (r=-.54), functional
reach (r=.52), 9 hole peg test
(r=-.52)
NA
NA
NA
NA
NA
NA
NA

79
Duncan et
al., 2012
Adults with
Parkinson’s
Disease
NA
NA
NA
<15/30
6-month
prospective
falls
12 months
prospective
falls
64%
46%
81%
81%
(+) LR
3.37
PPV
56%
(+) LR
2.42
PPV
54%
(-) LR
.44
NPV
15%
(-) LR
.67
NPV
24%

80
Outcome
Measure
Reference
Population/
Diagnosis
Psychometric property
Fall Predictability
Validity
Reliability
MDC
Cutoff score
Sn
Sp
PPV
NPV
Functional
Independence
Measure (FIM)
Hobart JC
et al., 2001
Inpatient Neuro
rehabilitation; n =
149 (age 16-77 y/o,
mean 46.2 y/o)
Item Validity:
Disability- 0.82,
Cronbach’s alpha;
Handicap, physical
health status, mental
health status
psychological distress,
global cognitive
function,
responsiveness ranged
0.10-0.48
Internal Consistency:
0.53-0.87, Alpha
coefficient 0.95
Concurrent Validity
with Barthel Index, 18-
item FIM, 30-item
FIM+FAM: Pearson’s
r=0.96-0.996, ICC
=0.95-0.995
Intra-rater
reproducibility:
0.98, ICC
NA
NA
NA
NA
NA
NA

81
Outcome
Measure
Reference
Population/
Diagnosis
Psychometric property
Fall Predictability
Validity
Reliability
MDC
Cutoff score
Sn
Sp
PPV
NPV
Functional
Reach Test
Katz-
Leurer, et
al.,
2009
Older adults s/p
acute CVA
Reliability n=10,
(mean age 63 y/o)
Validity n=35,
mean age 60 y
Responsiveness to
paretic side (effect
size 0.80) forward
and nonparetic side
(effect size 0.57 –
0.60)
test-retest ICC
range 0. 90 –
0.95
NA
NA
NA
NA
NA
NA
Merchán-
Baeza, et
al.,
2014
Older adults s/p
acute CVA
n=5
(mean age 76.7 y/o)
NA
Inter-rater 0.987
intra-rater 0.983
NA
NA
NA
NA
NA
NA
Bohannon,
et al.,
2017
Hypertensive
adults, n=199
(mean age 80.6 y/o)
Consolidated data
from 20 studies,
n=7535
NA
NA
NA
Hypertensive
grp 27.5 cm
(SD 7.2cm)
Consolidated
data 27.2 cm
(SD 0.9cm)
NA
NA
NA
NA
Modified
Functional
Reach Test
Thomas &
Lane, 2005
Frail elderly
(>65y/o); n=30;
fallers (79.7 y/o)
non-fallers (81.4
y/o)
NA
Intra-rater
reliability: .087,
ICC
NA
18.5 cm; OR
5.28, CI 95%,
P=.076
75%
at CI
95%
67%
at CI
95%
Fallers vs.
non-fallers:
t=2.024,
P=.053,
Power=.46
NA

82
Outcome Measure
Reference
Population/
Diagnosis
Psychometric property
Fall Predictability
Validity
Reliability
MDC
Cutoff score
Sn
Sp
PPV
NPV
Modified
Gait Abnormality
Rating Scale
VanSwearingen
et al., 1996
Community-
dwelling
Concurrent
validity: gait
speed r = -
0.679
Intra-rater
reliability: Kappa
0.493-0.676
ICC 0.95-0.984
Interrater
Reliability:
Kappa 0.789-0.886
ICC 0.968-0.975
NA
NA
NA
NA
NA
NA
Outcome Measure
Reference
Population/
Diagnosis
Psychometric property
Fall Predictability
Validity
Reliability
MDC
Cutoff score
Sn
Sp
PPV
NPV
Gait Efficacy Scale
(modified)
Newell et al.,
2012
Community-
dwelling
older adults
FES r 0.80
ABC Scale
0.88, and
Late Life
FDI Overall
functional
Subscale r =
0.88
Test-retest
reliability: ICC 0.
93 (95% CI 0.85-
0.97)
SEM 5.23
NA
NA
NA
NA
NA
NA

83
Outcome
Measure
Reference
Population/
Diagnosis
Psychometric property
Fall Predictability
Validity
Reliability
MDC
Cutoff score
Sn
Sp
PPV
NPV
Gait
Speed
Verghese J
et al., 2009
Community-
dwelling older
adults (mean
age 80 ±5.4
y/o). n=597
NA
NA
NA
Risk ratio (RR) for
falls per 10 cm/s
decrease gait speed
<70 cm/s = slow gait,
RR 1.540, 95% CI
1.095-2.150
70-100 cm/s, RR
1.276, 95% CI 0.906-
1.768
NA
NA
NA
NA
Peel et al.,
2012
Community-
dwelling adults,
hospital
inpatient,
outpatient
settings
NA
NA
NA
Community-dwellers
0.58 m/s usual pace
and 0.89 m/s maximal
pace; acute inpatient
0.46 m/s; outpatient
settings 0.74 m/s
NA
NA
NA
NA
Kon et al.,
2012
Community-
dwelling older
adults with
COPD (Gold
Stage II-IV)
NA
Inter-rater:
ICC 0.99
Test-
retest: ICC
0.97
Slow:
<0.8m/s
Normal:
>0.8m/s
NA
NA
NA
NA
NA
Hiengkaew
et al., 2012
Individuals with
chronic stroke
+6 months from
initial event
(63.5±10.0 y/o)
NA
Comfortab
le speed:
0.96
Fast
speed:
0.98
(MDC 95%)
Comfortable
speed:
0.18m/s
Fast speed:
0.13 m/s
NA
NA
NA
NA
NA
Peters et al.,
2013
Healthy older
adults
0.99-1.00
between
stopwatch
and
automatic
timer
Test re-
test ICC
10 m
walk: 0.98
4 m walk:
0.97
4m: 0.02
m/s
10m: 0.01
m/s
NA
NA
NA
NA
NA

84
Elbers et al.,
2013
Community
ambulators with
Parkinson’s
Disease
(67±7.54 y/o)
NA
NA
NA
0.88m/s to predict
community
ambulation (70%
accurate)
NA
NA
NA
NA
Blankevoort
et al., 2013
Older adults
with dementia
from nursing
homes/day care
centers (82.57
±5.31 y/o)
NA
6 m walk
test ICC
0.86
6 m walk
test = 0.27
m/s
NA
NA
NA
NA
NA
Bijleveld-
Uitman et
al., 2013
Community
ambulatory with
history of stroke
who completed
both an inpatient
and outpatient
program
NA
NA
NA
NA
0.89
(CI
95%;0.
85–
0.91)
0.70
(CI
95%;0.
58–
0.80)
0.92 (CI
95%; 0.89-
0.95)
0.61
(CI
(95%;
(0.51–
0.70)
Bohannon et
al., 2013
Stroke patients
in inpatient
rehab
(62.0±13.7 y/o)
NA
NA
MDIC 0.13
m/s
NA
0.810
0.714
NA
NA
Bongers et
al., 2015
Community-
dwelling older
adults; (mean
age 76.2 y/o)
n=352
NA
NA
NA
NA
NA
NA
Gait speed
for falls:
AUC 0.53
Gait speed
for recurrent
falls: AUC
0.59
Gait speed
with age,
gender & fall
hx for falls:
AUC 0.64
and for
recurrent
falls:
AUC0.69
NA

85
Outcome
Measure
Reference
Population/
Diagnosis
Psychometric property
Fall Predictability
Validity
Reliability
MDC
Cutoff score
Sn
Sp
PPV
NPV
Geriatric Fear of
Falling Measure
Huang et al.,
2006
Summary of 2
descriptive cross-
sectional studies in
Taiwanese
community dwelling
older adults (pilot
study n=100 and
follow up validation
n=354)
R=0.29
p=0.002
with FES
Test-retest 0.88
(p<0.0001), paired T-
tests determined no
significant difference in
mean scores
Inter-rater 0.91 for Risk
prevention, 0.94 for
psychosomatic
symptoms, and 0.89 for
modifying behavior
subscales at p<0.001 for
all
NA
NA
NA
NA
NA
NA
Outcome
Measure
Reference
Population/
Diagnosis
Psychometric property
Fall Predictability
Validity
Reliability
MDC
Cutoff score
Sn
Sp
PPV
NPV
Global
Deterioration
Scale (dementia
assessment
instrument)
Reisberg et al.,
1982
Elderly (65 y/o or
older) with stages of
dementia
Stage
progression
correlated
with CT
scan:
p<0.05
NA
NA
NA
NA
NA
NA
NA
Reisberg et al.,
1988
38 dementia patients
NA
Test-retest: Pearson’s
correlation
coefficient:0.92
NA
NA
NA
NA
NA
NA
Gottlieb et al.,
1988
43 possible
Alzheimer’s
Disease patients
NA
Inter-rater: ICC = 0.82
NA
NA
NA
NA
NA
NA

86
Outcome
Measure
Reference
Population/
Diagnosis
Psychometric property
Fall Predictability
Validity
Reliability
MDC
Cutoff score
Sn
Sp
PPV
NPV
Gorningen
Activity
Restriction Scale
Kempen et al.,
1996
4789
community-
based
participants
(age 57-85 y/o)
Concurrent
validity against
SF-20 (0.79)
0.91
NA
NA
NA
NA
NA
NA
Metzelthin et al
2011
Older adults
(over 70 y/o)
With GFI:
r = 0.57
With TFI:
r = 0.61
With SPQ:
R = 0.46
NA
NA
NA
NA
NA
NA
NA
Wales et al.
2017
Hospitalized
older adults
NA
NA
MDC: 7.04
NA
NA
NA
NA
NA

87
Outcome
Measure
Reference
Population/
Diagnosis
Psychometric property
Fall Predictability
Validity
Reliability
MDC
Cutoff score
Sn
Sp
PPV
NPV
Grip
Strength
Sayer et al.,
2006
2148 participants
from UK (59-73
y/o); falls had
significantly
lower grip
strength
NA
NA
NA
NA
NA
NA
NA
NA
Pijappels et
al., 2008
17 healthy older
adults (70±4.5
y/o)
NA
NA
NA
Discriminative
model fallers vs
non-fallers, no
value reported
86%
80%
NA
NA
Xue et al.,
2011
352 women (74
y/o) declined grip
strength inversely
correlated with
rate of falls
NA
NA
NA
NA
NA
NA
NA
NA
Silva et al.,
2015
24 with
Parkinson’s (65.5
± 6.2 y/o) and 26
healthy subjects
(63.4 ± 7.2 y/o)
NA
Inter-rater
reliability
ICC
(2, 1)
=
0.79-0.89
6.34-
7.4mmHg
NA
NA
NA
NA
NA
Bertrand et
al., 2015
34 adults with
acute stroke (18-
80 y/o)
NA
Test-retest
reliability
ICC = 0.95-
0.99
2.73-
4.68Kg
NA
NA
NA
NA
NA
Agular et al.,
2016
12 adults with
subacute stroke
Concurrent
validity with
Berg (ρ=.91;
P<.01)
with gait
speed (ρ=.67;
P<.01)
Intra-rater
reliability
ICC
(2, 1)
=
0.64-0.99
Inter-rater
reliability
ICC
(2, 1)
=
0.66-0.99
95% CI
0.96-
6.12Kg
NA
NA
NA
NA
NA

88
Vasconcelos
et al., 2016
1374 community-
dwelling frail
older adults in
Brazil
NA
NA
NA
Predict mobility
limitation
Men= 25.8Kg
Women=17.4Kg
Men
69%
Women
60%
Men
73%
Women
66%
NA
NA
Jenkins et
al., 2017
257 older adults
with sarcopenia
(98 men, 159
women)
NA
Test-retest
reliability
ICC = 0.93-
0.97
2.67-5.5
Kg
NA
NA
NA
NA
NA
Sampaio et
al., 2017
578 older adults
from community
centers of south
Brazil (70±6.7
y/o)
NA
NA
NA
Predict fear of
falling
Men=30Kgf;
Women= 21.7 Kg
Men
39%
Women
29%
Men
94%
Women
73%
Men
0.81
Women
0.67
Men
0.71
Women
0.36
Ikegami et
al., 2019
415 community
older adults
(Japan)
NA
NA
NA
Shift of one
Standard deviation
increased fall risk
by 39%
NA
NA
NA
NA

89
Outcome
Measure
Reference
Population/
Diagnosis
Psychometric property
Fall Predictability
Validity
Reliability
MDC
Cutoff score
Sn
Sp
PPV
NPV
Hauser
Ambulation
Index
Syndulko et
al., 1996
Patients with
chronic
progressive
Multiple
Sclerosis
NA
Test-retest:
ICC= 0.91
NA
NA
NA
NA
NA
NA
Sharrack et
al., 1999
64 individuals
with Multiple
Sclerosis
NA
Intra-rater:
ICC= 0.93
Interrater:
ICC= 0.96
NA
NA
NA
NA
NA
NA
Cattaneo et
al., 2006
51 patients
with Multiple
Sclerosis
With Berg
Balance Scale: r=
0.74
With Dynamic
Gait Index:
r=0.80
With TUG: r=
0.74
With ABC scale:
r=0.45
With Dizziness
Handicap
Inventory: r=0.32
With
Functional
Independence
Measure:
r=0.73
With Barthel
Index = r-0.72
With SF-36
physical
functioning:
r=0.87
NA
NA
NA
NA
NA
NA

90
Outcome
Measure
Reference
Population/
Diagnosis
Psychometric Property
Fall Predictability
Validity
Reliability
MDC
Cutoff Score
Sn
Sp
PPV
NPV
Hendrich II
Fall Risk
Model
Ivziku et al.
2011
Older adults
(65+ y/o) in
geriatric
unit of
hospital
NA
Inter-rater
reliability: 0.87
(CI 95%: 0.71-
1.00)
NA
Score of >
or equal to
5 = at risk
for falling
0.86
(CI
95%:
0.67-
1.04)
0.43
(CI
95%:
0.34-
0.51)
0.11
(CI
95%:
0.051-
0.17)
0.97
(CI
95%:
0.94-
1.01)
Aranda-
Gallardo et
al
2013
Acutely
hospitalized
adults
(n=13,284
included in
analysis)
NA
NA
NA
NA
0.628
(CI
95%:
0.549-
0.702)
0.640
(CI
95%:
0.630-
0.651)
NA
NA
Nassar et al.
2013
Adult patients
on the
medical,
surgical,
oncology, and
critical care
units at a
medical center
NA
NA
NA
NA
55.2%
89.3%
16.5%
98.3%
Jung and
Park
2018
Acutely
hospitalized
adults (15,480
total included
in analysis)
NA
NA
NA
NA
0.80
(maximum
point)
0.59
(maximum
point)
NA
NA

91
Outcome
Measure
Reference
Population/
Diagnosis
Psychometric property
Fall Predictability
Validity
Reliability
MDC
Cutoff score
Sn
Sp
PPV
NPV
Home Falls and
Accidents
Screening Tool
Mackenzie et
al., 2002
40 home visits, in
urban and rural
settings, by pairs
of raters, one of
whom was an
expert rater.
NA
Inter-rater
reliability: 0.62
NA
NA
NA
NA
NA
NA
Vu et al.,
2012
Community-
dwelling older
adults (over 65
y/o)
NA
Inter-rater: 0.82
(95% CI, 0.66-
0.91)
Test-retest: 0.77
(95% CI, 0.57-
0.88)
NA
NA
NA
NA
NA
NA
Mackenzie et
al., 2018
567 older women
(mean 77.5 y/o)
survey
NA
NA
NA
9
73.9%
37.9%
30.6%
79.7%
Outcome
Measure
Reference
Population/
Diagnosis
Psychometric property
Fall Predictability
Validity
Reliability
MDC
Cutoff score
Sn
Sp
PPV
NPV
High Level
Mobility
Assessment Tool
Kleffelgaard
et al. 2013
Patients with
mild TBI at Oslo
University
Hospital
NA
Inter-rater
reliability: 0.99
(95% CI = .98-
1.00)
Intra-rater
reliability: 0.95
(95% CI
= .89-.98)
+/- 3.25
points
NA
NA
NA
NA
NA

92
Outcome
Measure
Reference
Population/
Diagnosis
Psychometric property
Fall Predictability
Validity
Reliability
MDC
Cutoff score
Sn
Sp
PPV
NPV
International
Physical
Activity
Questionnaire
Kurtze, et
al., 2008
108 men (aged 20–39
y/o)
Vigorous PA, hours
per week and days
were most strongly
correlated
(respectively 0.41,
0.40 and 0.36, r= p ≤
0.01) with VO2max
ICC 0.30 for
moderate
activity hours,
0.80 for sitting
hours
NA
NA
NA
NA
NA
NA
Short version
Lee et al.,
2018
(systematic
review)
23 studies from USA,
Japan, Hong Kong,
Switzerland, Canada,
etc.
Populations include
military, chronic fatigue
syndrome,
schizophrenia,
fibromyalgia, school
students
Small effect size
when validated
against other fitness
measurements
NA
NA
NA
NA
NA
NA
NA
Outcome
Measure
Reference
Population/
Diagnosis
Psychometric property
Fall Predictability
Validity
Reliability
MDC
Cutoff score
Sn
Sp
PPV
NPV
L Test of
Functional
Mobility
Barry, et
al., 2005
93 people with unilateral
amputations (74%
transtibial, 26%
transfemoral; 78% male,
22% female; mean
age=55.9 y/o) from
outpatient clinic
NA
ICC .96 for
interrater
reliability
and .97 for
intra-rater
reliability
NA
NA
NA
N
A
NA
NA
Rushton, et
al., 2015
33 adults with LE
amputation (mean age
60 ± 13.0 y/o)
NA
NA
MCID
4.5 s
NA
NA
N
A
NA
NA

93
Outcome
Measure
Reference
Population/
Diagnosis
Psychometric property
Fall Predictability
Validity
Reliability
MDC
Cutoff score
Sn
Sp
PPV
NPV
LASA
Fall Risk
Profile
Pluijm et
al., 2006
1365 community
-dwelling 65
years and older
(mean age
75.3±6.4 y/o)
NA
NA
NA
cutoff point of
5 (range 0–30)
cutoff point of
10
59%
31%
71%
92%
NA
NA
Peeters, et
al., 2010
408 adults (mean
age 77.9 ±
7.1y/o) 73.3%
female
Area under
the receiver
operating
(AUC)
characteristic
curve was
0.65(95% CI:
0.58, 0.72)
NA
NA
8
56.6%
(CI: 51.8,
61.4),
71.4%
(CI: 67.0,
75.8),
34.1%
(CI: 29.5,
38.7),
85.6%
(CI: 82.2,
89.0)

94
Outcome
Measure
Reference
Population/
Diagnosis
Psychometric property
Fall Predictability
Validity
Reliability
MDC
Cutoff score
Sn
Sp
PPV
NPV
Late-Life
Function
and
Disability
Instrument
Jette et al.,
2002
150
community-
dwelling
older adults,
(mean age
75.9±8.5 y/o)
NA
Test-retest
ICC (.68–.82)
NA
NA
NA
NA
NA
NA
Haley et
al., 2002
150
community-
dwelling
older adults,
(mean age
75.9±8.5 y/o)
NA
Test-retest
ICC (.91
to .98).
NA
NA
NA
NA
NA
NA
Sayers et
al., 2004
101 men and
women (aged
80.8 + 0.4
y/o)
Moderately associated with the
SPPB (r 5 0.65, Po.001), 400-m
W gait speed (r 5 0.69, Po.001)
NA
NA
NA
NA
NA
NA
NA
Beaucham
p, et al.,
2014
17,301 adults
There is extensive evidence to
support the construct validity and
sensitivity to change of the
LLFDI among various clinical
populations of community-
dwelling older adults. Further
work is needed on predictive
validity and values for clinically
important change.
NA
NA
NA
NA
NA
NA
NA
Pandya et
al., 2016
181 African
American
breast cancer
survivors
(59.7 ± 7.2
y/o)
Cronbach alpha 0.91
NA
NA
NA
NA
NA
NA
NA

95
Outcome
Measure
Reference
Population/
Diagnosis
Psychometric property
Fall Predictability
Validity
Reliability
MDC
Cutoff score
Sn
Sp
PPV
NPV
Missouri
Alliance for
Home Care
(MAHC-10)
Calys et al.,
2012*
Homecare
retrospective
analysis (n = 2247)
Correlated
with CT
scan:
p<0.05
NA
None
reported
≥ 4
96.9
%
13.3%
NA
NA
Outcome
Measure
Reference
Population/
Diagnosis
Psychometric property
Fall Predictability
Validity
Reliability
MDC
Cutoff score
Sn
Sp
PPV
NPV
Melbourne
Fall Risk
Assessment
Tool (MFRAT)
Barker et al.,
2009*
87 hospital and
nursing home
residents,
(81.6±10.7 y/o)
NA
Kappa k =
0.21
NA
NA
NA
NA
NA
NA
Outcome
Measure
Reference
Population/
Diagnosis
Psychometric property
Fall Predictability
Validity
Reliability
MDC
Cutoff score
Sn
Sp
PPV
NPV
Minimal Chair
Height
Standing
Ability
Reider et al.,
2015
167 community-
dwelling older
adults (83.6±1.3
y/o)
NA
NA
NA
34 cm Fallers vs Non-
Fallers
75%
62%
NA
NA
Outcome
Measure
Reference
Population/
Diagnosis
Psychometric property
Fall Predictability
Validity
Reliability
MDC
Cutoff score
Sn
Sp
PPV
NPV
Mobility
Interaction Fall
Chart
Lundin-Olsson
et al., 2000
78 residential care
facility residents 82
y/o (66-99) in
Sweden
NA
80%
agreement
(Kappa k =
0.6)
NA
Classified as high risk of
falling, i.e., stopped
walking at turns
(log rank test 39.1;
p<0.001; hazard ratio
12.1; 95% CI 4.6–31.8).
NA
NA
78%
(CI
67-
87%)
88%
(CI =
79-
95%)

96
Outcome
Measure
Reference
Population/
Diagnosis
Psychometric property
Fall Predictability
Validity
Reliability
MDC
Cutoff score
Sn
Sp
PPV
NPV
Morse Fall
Scale
Baek et al.,
2013
Retrospective
inpatient (hospital
data)
51 (AUC = 0.77)
0.72
0.91
0.63
0.94
Nassar et al.,
2013
1815
inpatient/hospital
data
Cronbach’s
alpha r = 0.64
Inter-rater
reliability ICC =
0.9
51
0.37
0.54
0.124
0.98
McKechnie et
al., 2016
Systematic review
Reliability
established prior
to 2015
< 25 pts low fall risk
25-44 points; moderate
fall risk;
> 45 high fall risk
78%
83%
10%
99%
Sardo et al.,
2016
8356 hospital
patients
45 correlated with
diagnosis and length of
say
Bórikova et
al., 2018
Long term care
residents
44 correlated with fall
history
Outcome
Measure
Reference
Population/
Diagnosis
Psychometric property
Fall Predictability
Validity
Reliability
MDC
Cutoff score
Sn
Sp
PPV
NPV
Motor
Fitness
Scale
Kinugasa et
al., 1998
Community
dwellers n=62
NA
0.92
NA
NA
NA
NA
NA
NA
Aoyama et al.,
2015
Community
dwellers n=99
NA
No associate with
fallers or non-
fallers
NA
NA
NA
NA
NA
NA
Outcome
Measure
Reference
Population/
Diagnosis
Psychometric property
Fall Predictability
Validity
Reliability
MDC
Cutoff score
Sn
Sp
PPV
NPV
Multiple
Lunge Test
Wagenaar et
al., 2012
n=130 community
dwellers
NA
0.79-0.88
NA
NA
73
%
63
%
NA
NA

97
Outcome
Measure
Reference
Population/
Diagnosis
Psychometric property
Fall Predictability
Validity
Reliability
MDC
Cutoff score
Sn
Sp
PPV
NPV
Multiple
Sclerosis
Walking Scale-
12
Nilsagard et
al., 2009
Community-
dwellers with
Multiple Sclerosis
n=82
NA
NA
NA
≥ 75 pts
52
82
83
50
Motl et al.,
2010
Community-
dwellers with
Multiple Sclerosis
Comfortable
walking speed
0.64;
Fast walking
speed 0.62
NA
NA
NA
NA
NA
NA
NA
Cavanagh et
al., 2011
Community-
dwellers with
Multiple Sclerosis
n=21
BBS -0.78
NA
NA
NA
NA
NA
NA
NA
Motl et al.,
2011
Community-
dwellers with
Multiple Sclerosis;
N = 260
NA
6 month
0.86; 12
month 0.87
NA
NA
NA
NA
NA
NA
Learmonth et
al., 2014
Community-
dwellers with
Multiple Sclerosis
n=82
NA
NA
22 points for
functional
mobility
NA
NA
NA
NA
NA
Motl et al.,
2014
Community-
dwellers with
Multiple Sclerosis
n=82
NA
NA
4-6 points
with changes
in walking
ability
NA
NA
NA
NA
NA
Goldman et al.,
2017
159 people with
Multiple Sclerosis
Benchmark scores
reflect to levels of
function
NA
NA
NA
NA
NA
NA
NA

98
Outcome
Measure
Reference
Population/
Diagnosis
Psychometric property
Fall Predictability
Validity
Reliability
MDC
Cutoff score
Sn
Sp
PPV
NPV
Norwegian
General Motor
Function
(NGMF)
assessment
scale
Linghammer et al.,
2016
Community-dwelling
older adults
Falls were not
correlated to
NGMF
NA
dependence
2.8 points,
pain 4.9
points and
insecurity 6.1
points→ but
none for falls
NA
NA
NA
NA
NA
Outcome
Measure
Reference
Population/
Diagnosis
Psychometric property
Fall Predictability
Validity
Reliability
MDC
Cutoff score
Sn
Sp
PPV
NPV
Peninsula
Health Fall
Risk
Assessment
Tool (PHRAT)
Stapleton et al., 2009
Multi-campus
setting of an Aged Care
and Rehabilitation
Peninsula includes
inpatient rehabilitation,
hospital, nursing home,
and psychogeriatric
beds (mean age 78.8
y/o)
NA
high
reliability
(ICC =
0.79)
NA
NA
NA
NA
NA
NA

99
Outcome
Measure
Reference
Population/
Diagnosis
Psychometric property
Fall Predictability
Validity
Reliability
MDC
Cutoff score
Sn
Sp
PPV
NPV
Physical Activity
Questionnaire
(CHAMPS
Physical Activity
Questionnaire)
Stewart et al.,
2001
Underactive
community-
dwelling older
adults, (65-90 y/o)
n = 249
Construct validity
with 6 Min Walk
Test, Self-Reported
Physical
Functioning, 0.22-
0.30, P < .001
Test-retest
reliability 6 month
N = 91:
Caloric expenditure
ICCs 0.67 - 0.66;
Frequency
measures ICCs
0.58 -0.62
NA
NA
NA
NA
NA
NA
Harada et al.,
2001
Older community-
dwelling and
retirement home
adults, (64+ y/o)
n = 87
Construct validity
with Physical
Activity Survey for
the Elderly (PASE)
&Yale Physical
Activity Survey
(YPAS) 0.58- 0.68,
P < 0.0001
Test-retest
reliability 2 weeks:
All physical
measures ICCs =
0.59-0.69
Moderate-intensity
measures ICCs =
0.72-0.79
NA
NA
NA
NA
NA
NA
Hekler et al.,
2012
Older community-
dwelling adults
(65+ y/o)
n = 870
Concurrent validity
with accelerometer,
n = 850; Spearman
rank-order p = 0.06
-0.40, P < .001
Test-retest
reliability, N = 748
ICCs = 0.56-.70
NA
NA
NA
NA
NA
NA

100
Outcome
Measure
Reference
Population/
Diagnosis
Psychometric property
Fall Predictability
Validity
Reliability
MDC
Cutoff score
Sn
Sp
PPV
NPV
Physical
Mobility
Scale
Nitz et al.,
2006
Adults,
residential care
(35-90 y/o)
n = 9
Physical
Therapists n =
19
Concurrent validity
Rivermead Mobility
Index (RMI) &
Clinical Outcomes
Variable Scale
(COVS)
ICC .69-.90, P <
0.001
Inter-rater
reliability ICC
0.68-0.88
NA
NA
NA
NA
NA
NA
Barker et
al., 2008
Older adults,
residential care
facilities
Cohort 1 –
(85.22±5.1
y/o); Cohort 2
(dementia
>50%)
(81.59±10.69
y/o) n = 189
Internal construct
validity
Rasch analysis:
residual mean value
both cohorts = 0,
SD=1.21 & 1.52
respectively, P>.05
Inter-rater
reliability (28
participants)
k ≥.60 all
items except;
sitting, stand to
sit, mobility
with k
= .46-.59
CI 95%
4.39 pts,
90%
confidence
NA
NA
NA
NA
NA
Pike et al.,
2010
Older adults,
long term care
(81.4 ± 6.3 y/o)
n = 70
NA
Intra-rater
reliability ICC
= 0.982
MDC 3.98
pts, 95%
confidence
MCID 5 pts
(n = 60)
NA
NA
NA
NA
NA
Barker et
al., 2012
Older adults,
long term care
n = 87
NA
NA
NA
NA
NA
NA
High fall risk:
PMS score 28-
36; Hazard
Ration 1.98,
95%, CI 1.30-
3.03
Low fall
risk: PMS
score 0-9;
hazard Ratio =
0.05 95% CI
0.01- 0.32
NA

101
Outcome
Measure
Reference
Population/
Diagnosis
Psychometric property
Fall Predictability
Validity
Reliability
MDC
Cutoff score
Sn
Sp
PPV
NPV
Physical
Performance
Test (PPT)
7 & 9 item
tests
Reuben et
al., 1990
Community
and
retirement
home
dwelling
older adults;
one cohort of
Parkinson’s
Disease;
(mean age
79, range 46-
94 y/o)
N = 183; 106
9-item, 179
7-item test
Concurrent validity 9
& 7-item tests:
Roscow Breslau r =
0.80 & 0.69
Tinetti Gait score r =
0 .78 & 0.69
KATZ Activities of
Daily Living r = 0.65
& 0.50
Reliability 9
& 7-item
tests:
Cronbach’s
alpha = 0.99
& 0.93
Inter-rater
reliability: p =
0.99 & 0.93
NA
NA
NA
NA
NA
NA
Brown et
al., 2000
Community-
dwelling
older adults,
(83 ± 4 y/o)
N = 107
Concurrent validity
9-item test:
Balance – obstacle
course, Berg Test,
Full Tandem,
Functional Reach r =
-.793, .710, .600, .51
1 with P =
<.005, .005, .001, .00
5 respectively
Gait –
Preferred gait speed,
Fast gait speed,
cadence, stride
length, % gait cycle
spent in stance,
double stance time r
= .528, .518, .427, .4
43, .487, .375 with
P =
< .05, .05, .005, .05, .
05, .001 respectively
NA
NA
Frailty Cutoff Scores:
Not frail 32-36
Mild frailty 25-31
Moderate frailty 17-24
NA
NA
NA
NA

102
Lusardi et
al., 2003
Community-
dwelling
older adults
(82.7 ± 7.9
y/o)
n = 76
NA
NA
NA
Cutoff Frailty Scores:
9-item test –
32-36 not frail
25-32 mild frailty
17-24 moderate frailty
< 17 unlikely to function in
community
7-item test –
< 19.4 moderate frailty
19.4-24.8 mild frailty
NA
NA
NA
NA
Delbaere
et al.,
2006
Community-
dwelling
older adults,
(60+ y/o)
n= 257
NA
NA
NA
NA
NA
NA
OR
4.16,
95%
CI
2.22-
7.79, P
<0.001
NA
Paschal et
al., 2006
Community-
dwelling
older adults
with
Parkinson’s
disease,
(62.4 ±6.3
y/o)
n = 14
Test-retest reliability
ICC 7-item test
0.818; 9-item test
o.895, 95% CI
NA
2.5 pts
NA
NA
NA
NA
NA
Farrell et
al., 2011
Community-
dwelling
older adults
with mild to
moderate
dementia,
(76/6±9.5
y/o)
n= 34
7-Item Test:
Intra-tester ICC .99,
95% CI
Test-retest reliability
ICC .90, 95%CI
NA
NA
Cutoff score with best
sensitivity & specificity 19
pts
83%
41%
1.41,
95%
CI
.41
95%
CI

103
Outcome
Measure
Reference
Population/
Diagnosis
Psychometric property
Fall Predictability
Validity
Reliability
MDC
Cutoff score
Sn
Sp
PPV
NPV
Physiological
Profile
Assessment
(PPA)
Lord et
al., 2003
Community
and
institutional
older adults
(59-99 y/o)
Individual item
validation
performed from
1989-1996
Individual item
reliability performed
from 1989-1996
NA
NA
NA
NA
75%
accuracy in
determining
elders at fall
risk
NA
Lorbach et
al., 2007
Community-
dwelling
older adults
with mild to
moderate
Alzheimer’s
Disease (63-
91 y/o)
n = 21
Long version
PPA
NA
Test-retest reliability
for visual acuity,
contrast sensitivity,
knee extension
strength, stability and
max balance
range ICC = 0.78-
0.90
ICCs for tactile
sensitivity, ankle
dorsiflexion strength,
hand reaction time,
sway/foam/EC,
overall fall risk score
0.43-0.75
ICCs for
proprioception, foot
reaction time,
sway/floor EO & EC,
sway/foam/EO 0.18-
0.39
NA
NA
NA
NA
NA
NA
Liston et
al., 2012
Older adult
fallers
referred to
fall risk
clinics (60-
90+ y/o)
n = 865
Short version
PAA
Sig difference
between all age
groups for
contrast
sensitivity, knee
extensor
strength,
Sway/foam, fall
risk score
P<0.01
NA
Sway Test of
under 2500
mm
2
had
significantly
better contrast
sensitivity,
proprioception
, grip strength
and lower fall
risk scores
NA
NA
NA
NA
NA

104
Sampaio
et al.,
2014
Brazilian
community
dwelling
older adults
(75.2±5.17
y/o)
n = 10
Short version
PPA
NA
Intra-rater reliability
-
composite score .55
contrast
sensitivity .94
proprioception .74
strength .93
reaction time .25
sway .24
Inter-rater reliability
–
composite score .69
contrast
sensitivity .93
proprioception .92
strength .95
reaction time .54
sway .62
ICC composite PPA
& test components
p<.005
NA
NA
NA
NA
NA
NA
Gunn et
al., 2018
Outpatient PT
clinics with
Multiple
Sclerosis n =
416
(51±12.0 y/o)
NA
NA
NA
NA
NA
NA
Independent
prediction
of fallers
odds ratio
1.30, 95%
CI 1.17-1.46
NA
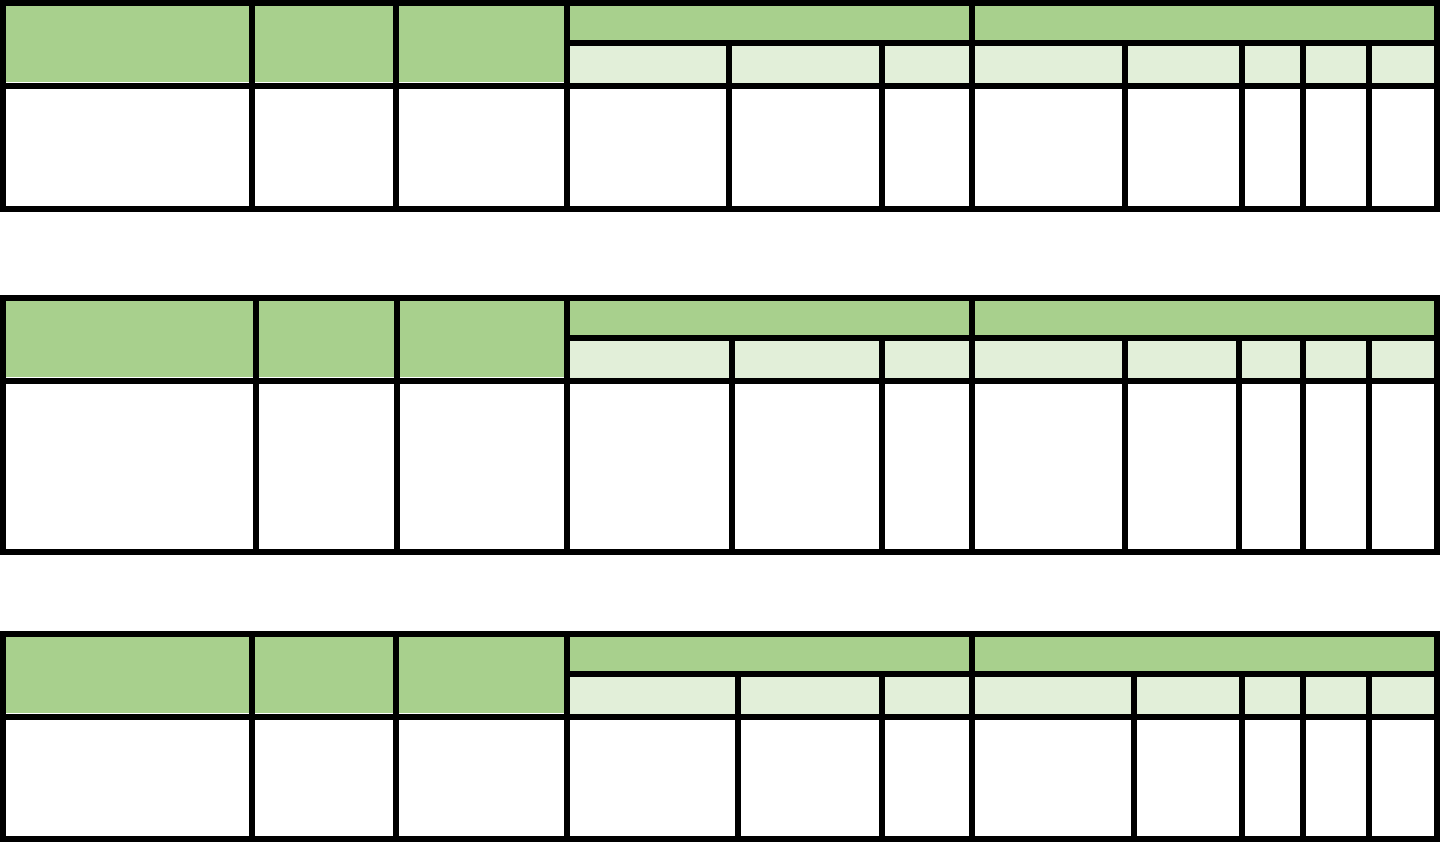
105
Outcome Measure
Reference
Population/
Diagnosis
Psychometric property
Fall Predictability
Validity
Reliability
MDC
Cutoff score
Sn
Sp
PPV
NPV
Push and Release Test
Jacobs et al.,
2006
Community-
dwellers with
Parkinson’s
Disease
NA
ICC: 0.84-
0.83
NA
NA
Trial 1:
100%
Trial
3:91%
NA
NA
NA
Outcome Measure
Reference
Population/
Diagnosis
Psychometric property
Fall Predictability
Validity
Reliability
MDC
Cutoff score
Sn
Sp
PPV
NPV
Queensland Fall Risk
Assessment Tool
(QFRAT)
Barker et al.,
2009
87 long term
care residents
(81.59 ± 10.59
y/o)
NA
Test-retest
agreement
k=0.88; Inter-
rater
agreement
k=0.51
7.34
NA
61%
49%
NA
NA
Outcome Measure
Reference
Population/
Diagnosis
Psychometric property
Fall Predictability
Validity
Reliability
MDC
Cutoff score
Sn
Sp
PPV
NPV
Rivermead Mobility
Index
Cho et al.,
2015
(modified
version)
Post-stroke
patients;
389±236 days
Correlation of
0.545 to FES
and 0.703 to
BBS
NA
NA
NA
NA
NA
NA
NA

106
Outcome
Measure
Reference
Population/
Diagnosis
Psychometric property
Fall Predictability
Validity
Reliability
MDC
Cutoff score
Sn
Sp
PPV
NPV
Romberg
Test
Olsson
Moller et
al., 2012
152 Sweden
community
older adults
(81.5±6.3
y/o)
NA
NA
NA
15 s
Sensitivity
=22%
Specificity
= 91%
NA
NA
Grass et
al., 2017
n = 100
Mean Age:
71.8±7.8
y/o)
Convergent
validity:
SR EO:
correlation with
BBS (Pearson’s
Correlation
coefficient with
95% CI=0.635)
and TUG (-
0.647); correlated
with SR EC
(0.496) and 10
MWT (0.447),
p<0.01
Inter-rater reliability
Eyes open–
ICC =1.0
Eyes Closed-
ICC=0.999
Intra-rater Reliability
Eyes open-
ICC=0.786
Eyes closed test
ICC=0.701
Test retest reliability
Eyes Open-ICC
=0.589
Eyes Closed-
ICC=0.670
NA
cutoff:>/=15
s (Only 8%
of
individuals
could
perform
TRT)
Sensitivity
=94%
Specificity
=12%
NA
NA

107
Outcome
Measure
Reference
Population/
Diagnosis
Psychometric property
Fall Predictability
Validity
Reliability
MDC
Cutoff score
Sn
Sp
PPV
NPV
Self-
Efficacy
Scale (SES)
Doba et al.,
2016
257 elderly
people
(82.3±3.8
y/o)
Correlation between self-efficacy and
score on clinical frailty scale
Significant relationships between
self-efficacy and non-parametric
variables like Beck depression
inventory score(p<0.001), physical
strength or stamina and cognition or
memory(p<0.001)
Cronbach’s
alpha = 0.79
NA
NA
NA
NA
NA
NA
Outcome
Measure
Reference
Population/
Diagnosis
Psychometric property
Fall Predictability
Validity
Reliability
MDC
Cutoff score
Sn
Sp
PPV
NPV
Short
Physical
Performan
ce Battery
Stookey et
al., 2014
43 patients
with stroke
(61.5 +/-9.8
y/o)
Significant correlation between SPPB
and 6 MWT(0.76; P < .001) and
between SPPB and peak O2
consumption during a graded exercise
test(r = 0.52; P < .001)
NA
NA
NA
NA
NA
NA
NA
Bernabeu-
Mora et al.,
2015
137 patients
with COPD
Mean Age:
(66.9 y/o,
46-80)
Convergent Validity:
Positive Moderate co-relation with
Quadriceps strength
Correlation Coeff-0.49
Divergent Validity:
Positive but weak correlation with
hand grip strength
(Correlation Coeff-0.28)
NA
NA
10
77%
70%
NA
NA
Lauretani et
al., 2018
451 frail
older adults
(82.1 ± 6.8
y/o) in a
geriatric
outpatient
clinic
Association with POMA; association
with fallers OR 0.83; AUC = 0.676
NA
NA
NA
NA
NA
NA
NA

108
Outcome
Measure
Reference
Population/
Diagnosis
Psychometric property
Fall Predictability
Validity
Reliability
MDC
Cutoff score
Sn
Sp
PPV
NPV
Shuttle
Walk
Bloemendaal et
al., 2012
75 rehab center after
stroke patients (58.8
± 9.8 y/o);
Netherland
correlated to 6-
min walk test
Test-retest: ICC
2, 1
= 0.961 (0.936-
0.977)
SEM = 6%
NA
NA
NA
NA
NA
Houchen-
Wolloff et al.,
2015
220 outpatient
cardiac rehab patients
(65 ± 10.5 y/o); UK
NA
NA
70.0 meters or
25%
NA
NA
NA
NA
NA
Costa et al.,
2018
45 outpatient patients
with difficult to
control asthma (47 ±
13.8 y/o); Brazil
NA
Test-retest: ICC
2, 1
= 0.98 (0.96-0.98)
NA
NA
NA
NA
NA
NA

109
Outcome
Measure
Reference
Population/
Diagnosis
Psychometric property
Fall Predictability
Validity
Reliability
MDC
Cutoff score
Sn
Sp
PPV
NPV
Sickness
Impact
Profile
Physical
Dimension
(SIP)
Carter et
al., 1976
25 health
professionals –
n = 1973
108 care
providers &
1975 patients;
(18-74 y/o)
Validation of scaled
values by two different
judgement groups,
correlation r = 0.092;
p≤0.00001
Reliability &
consistency of judges of
scaled items via deviate
score was good for 284
items with 28 dropped
or revised
NA
NA
NA
NA
NA
NA
Bergner et
al., 1976
278 adults in 4
outpatient
settings
(18 - 75 y/o)
Criterion validity
Category scores
discriminated among
subsamples ANOVA F
= 57.48, p < 0.001
Categories ambulation,
mobility and
confinement and leisure
pastimes high
correlation to sickness &
dysfunction r = .54, p,
0.001
Concurrent validity with
Activities of Daily
Living Index r = .46,
P< 0.001
Concurrent validity with
National Health
Interview Survey Data
(NHIS) r = .61, p <
0.001
NA
NA
NA
NA
NA
NA
NA
Bergner et
al., 1981
1976 field test
of adults
enrolled in
prepaid group
practice n =
696; family
practice
outpatient n =
199
Concurrent validity
with:
Self-assessment &
dysfunction r = 0.63 &
0.69
National Health
Interview Survey Data
(NHIS) r = .55 p < 0.001
53 subjects used for test-
retest reliability 0.92;
internal consistency
Cronbach’s alpha 0.94
NA
NA
NA
NA
NA
NA

110
Gerety et
al., 1994
Older adults
residents in
nursing homes
(≥ 60 y/o, mean
age 78.2 y/o), n
= 231
NA
Convergent validity of
SIP-NH Physical
Dimension with: SIP
Physical Dimension r
= 0.97, p < .001
Katz Activities of Daily
Living r = .28, p≤ .0002
Physical Index r = -.35,
p≤ .0001
Geriatric Depression
Scale r = .21, p ≤ .0002
Folstein Mini-Mental
State Exam r = -.08
NA
NA
NA
NA
NA
NA
Morishita
et al., 1995
Older adults
outpatient of
geriatric clinic,
(mean age 77.3;
range 60-94
y/o), n = 31
NA
Concurrent validity of
SIP:Physical
Functioning Dimension
(PFD) with Geriatric
Depression Scale by
Telephone r = .90, p
< .001
NA
NA
NA
NA
NA
NA

111
Outcome
Measure
Reference
Population/
Diagnosis
Psychometric property
Fall Predictability
Validity
Reliability
MDC
Cutoff score
Sn
Sp
PPV
NPV
Single Leg
Stance
Adkin et al.,
2003
Parkinson’s
Disease
UPDRS posture
and gait score
explained a
significant
amount of
variation in
stance duration
for the 1 leg
stance test
(r20.50; P 0.01
NA
NA
NA
NA
NA
NA
NA
Jacobs et al.,
2006
Parkinson’s
Disease
NA
NA
NA
10 seconds
75%
74%
NA
NA
Springer et
al., 2007
NA
NA
Inter-rater reliability ICC-
0.994 (95% CI 0.989 to
0.996) for eyes open best
of 3 trials, ICC=0.998
(95% CI 0.996-0.999) for
eyes closed best of 3 trials,
ICC=0.951 (95% CI 0.926
to 0.969) for eyes open
mean of 3 trials, and ICC=
0.832 (95% CI 0.748 to
0.895) for eyes closed
mean of 3 trials
NA
NA
NA
NA
NA
NA
Goldberg et
al., 2011
Adults (60-
89 y/o)
NA
NA
MDC at
95%
confiden
ce level
was
24.1
seconds
NA
NA
NA
NA
NA
Chomiak et
al., 2015
Parkinson’s
Disease
NA
test retest reliability ICC
0.82 (95% CI: 0.64-0.91, P
<0.01) and an ICC 0.83
(95% CI: 0.66-0.92,
P<0.01) for right and left
legs respectively
NA
NA
NA
NA
NA
NA
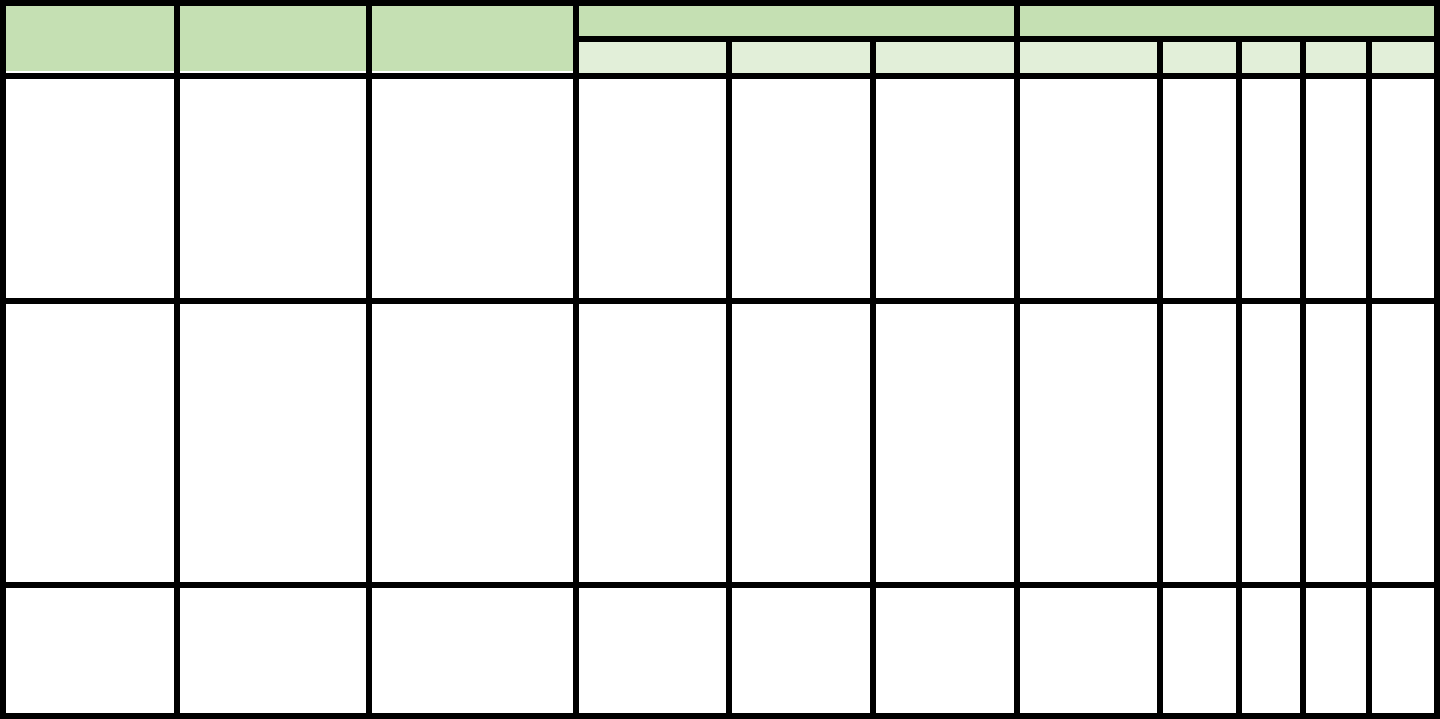
112
Outcome
Measure
Reference
Population/
Diagnosis
Psychometric property
Fall Predictability
Validity
Reliability
MDC
Cutoff score
Sn
Sp
PPV
NPV
St. Thomas
Risk
Assessment
Tool
(STRATIFY)
Oliver et al., 1997
Elderly hospital
inpatients (aged >65
y/o):
116 cases and 116
controls in phase 1,
217 patients in
phase 2, and 331 in
phase 3.
NA
NA
NA
>2 points
>3points
93%
92%
88%
68%
NA
NA
Smith et al., 2005
620 patients (over
the age of 65 y/o)
admitted to acute
care center/teaching
hospital
during a 6 month
period.
acute stroke,
baseline at rehab
at DC
NA
NA
NA
>/= 2 points
>/=2 points
11.3
16.3
89.5
86.4
25.0
38.2
76.6
66.5
Aranda-Gallardo
2018
647 nursing home
residence in Spain,
(411 fallers); (mean
age 81.8 y/o)
NA
NA
NA
1 point or
more
47.6%
85%
NA
NA

113
Outcome
Measure
Reference
Population/
Diagnosis
Psychometric property
Fall Predictability
Validity
Reliability
MDC
Cutoff score
Sn
Sp
PPV
NPV
Stopping
Elderly
Accidents,
Deaths, &
Injuries
(STEADI)
Shumway-
Cook A et
al., 2000
Community-
dwelling older
adults
n = 15 non
fallers, (mean
age 78, range
65-85 y/o)
n = 15 ≥2 falls,
(mean age
86.2, range 76-
95 y/o)
NA
NA
NA
≥ 13.5 sec
(only uses
TUG
portion)
Fallers 87%
Nonfallers
87%
.77
NA
Rubenstein
LZ et al.,
2011
Community-
dwelling older
adults (≥ 65
y/o), n = 40
Concurrent validity
of the Fall Risk
Questionnaire
(FRQ) with an
independent
geriatrician clinical
fall risk
examination items:
fall past 6 month
= Kappa 0.800 p
<.0001
Fall concern =
Kappa 0.700
p<.001
Feel unsteady =
Kappa 0.500
p<0.001
Medication use =
Kappa0.832
p<.0001
Depressed = Kappa
0.694 p<.001
Assistive device =
Kappa 0.698
p<.0001
Overall FRQ
items alpha
=.795
NA
Indicated fall
risk ≥ 4
96-100% for
original &
Revision 2
66.7-
83.3% for
original &
Revision
2
NA
NA

114
Rest of items =
Kappa 0.139 = .466
Panzer VP
et al., 2011
Community-
dwelling older
adults (64-94
y/o), n = 74
Full Clinical
Measures Set
Concurrent validity
with: Tinetti
Performance
Oriented Mobility
Assessment
(POMA) 0.5 – 1.0,
Sensory
Organization Test
(SOT).41 - .79
Mobility
Battery; 5
clinical
variables
ICC >0.6
NA
NA
AUC .80
.74
NA
NA
Stevens et
al., 2013
Health care
providers n =
18
6 geriatricians,
6 PCPs, 4 RNs,
2 NPs
NA
Quantitative
approach
using focus
groups to
identify
STEADI
components
NA
NA
NA
NA
NA
NA
Lohman
MC et al.,
2017
Older US
adults (≥ 65
y/o), n = 7,392
NA
NA
NA
NA
Discriminate
between
fallers AUC
= 0.641
NA
Moderate
Fall Risk
OR =
2.62,
High Fall
Risk OR
= 4.76,
Moderate
Multiple
Fall Risk
Category
OR =
4.05,
High
Multiple
Fall Risk
Category
OR =
13.7,
NA

115
Outcome
Measure
Reference
Population/
Diagnosis
Psychometric property
Fall Predictability
Validity
Reliability
MDC
Cutoff score
Sn
Sp
PPV
NPV
Stroke
Assessment Fall
Risk
Breisinger
2014
419 stroke patients 68 fallers, 351
non-fallers; (age 67.5 ± 15.5 y/o)
admitted to inpatient rehab
NA
NA
NA
27;
AUC=0.73
0.78
0.63
0.29
0.94
Outcome
Measure
Reference
Population/
Diagnosis
Psychometric property
Fall Predictability
Validity
Reliability
MDC
Cutoff score
Sn
Sp
PPV
NPV
Stroop Stepping
Test
Schoene et
al., 2014
103 independent-living older
adults (70-93 y/o);
NA
NA
NA
NA
game error
associated
with fall
history OR
1.65 (1.17-
2.34)
NA
NA
NA
Outcome
Measure
Reference
Population/
Diagnosis
Psychometric property
Fall Predictability
Validity
Reliability
MDC
Cutoff score
Sn
Sp
PPV
NPV
Subjective Risk
Rating of
Specific Scales
Hashidate
et al., 2011
30 elderly adults (aged ≥ 65 y/o),
in senior day care center
NA
Intra-rater
ICC=727-
0.914
NA
≥2
82
64
1.8
0.3
Outcome
Measure
Reference
Population/
Diagnosis
Psychometric property
Fall Predictability
Validity
Reliability
MDC
Cutoff
score
Sn
Sp
PPV
NPV
Survey of
Activities and
Fear of Falling
in Elderly
(SAFFE)
Jonasson et
al., 2014
102 participants with Parkinson’s
Disease (Mean Age=73±8 y/o)
NA
Internal
Consistency
Cronbach’s
alpha= 0.94
Test retest
Reliability:
ICC(95%
CI)=0.85
NA
NA
NA
NA
NA
NA

116
Outcome
Measure
Reference
Population/
Diagnosis
Psychometric property
Fall Predictability
Validity
Reliability
MDC
Cutoff score
Sn
Sp
PPV
NPV
The
Obstacle
Course
Means et
al., 1996*
22 older adults
(68.8±5 y/o) with
fall history and 22
older adults
(73.3±4 y/o) no
fall history
NA
Inter-rater
correlation 0.999;
intra-rater
correlation 0.98
NA
NA
NA
NA
NA
NA
Shamay et
al., 2017
29 people
(57.9±5.5 y/o)
with stroke and 30
healthy adults
(63.6±5.6 y/o)
Positive
correlation
between
obstacle course
completion time
(s) and TUG
Intra-rater
reliability ICC
2,2
0.937 (0.871-
0.970)
Inter-rater
reliability ICC
2,2
0.991 (0.980-
0.996)
Test-retest
reliability ICC
2,2
0.968 (0.932-
0.985)
2.37 seconds
15.43 sec
AUC = 0.975
96.6%
90.0%
NA
NA

117
Outcome
Measure
Reference
Population/
Diagnosis
Psychometric property
Fall Predictability
Validity
Reliability
MDC
Cutoff score
Sn
Sp
PPV
NPV
Timed Up
and Go
(TUG)
Barry et al,
2014
Community-
dwelling older
adults
NA
NA
NA
≥13.5 Sec
32%
73%
NA
NA
Vance et al.,
2015
Adults with
Parkinson’s
Disease
NA
NA
NA
≥12 Sec
41%
73%
NA
NA
Rolenz &
Reneker,
2016
Community-
dwelling older
adults with mild
cognitive
impairment
With the 8-Foot
Up and Go (r =
0.92)
NA
NA
≥13.5 Sec
23.6%
91.7%
NA
NA
Rolenz &
Reneker,
2016
Community-
dwelling older
adults without mild
cognitive
impairments
With the 8-Foot
Up and Go (r =
0.85)
NA
NA
≥13.5 Sec
12.5%
100%
NA
NA
Lusardi et
al., 2017
Community-
dwelling older
adults
NA
NA
NA
≥12 Sec
31%
85%
NA
NA
Quinn et al,
2018
Adults with
Multiple Sclerosis
NA
NA
NA
≥9 Sec
82%
34%
NA
NA
Chow et al.,
2018
Adults (≥65 y/o)
presenting in the
emergency
department
NA
NA
NA
≥12 Sec
70.6%
28.4%
26.3%
72.7%

118
Outcome
Measure
Reference
Population/
Diagnosis
Psychometric property
Fall Predictability
Validity
Reliability
MDC
Cutoff score
Sn
Sp
PPV
NPV
TUG
Dual
Task-
Cognitive
Vance et al., 2015
Adults with
Parkinson’s
Disease
NA
NA
NA
≥14.7 Sec
76.5%
73.7%
NA
NA
Lusardi et al.,
2017 (Based on
data from
Shumway-Cook
et al., 2000)
Community-
dwelling older
adults
NA
Interrater reliability
for both cog and
manual: ICC .99
NA
>13.5 sec
80%
93%
84
8
Quinn et al., 2018
Adults with
Multiple
Sclerosis
NA
NA
NA
≥11 Sec
77%
30%
NA
NA
TUG
Dual
Task-
Manual
Vance et al., 2015
Adults with
Parkinson’s
Disease
NA
NA
NA
≥13.2
29.55%
68.4%
NA
NA
Lusardi et al.,
2017
(Based on data
from Shumway-
Cook et al., 2000)
Community-
dwelling older
adults
NA
Interrater reliability
for both cog and
manual: ICC .99
NA
>13.5 sec
80%
93%
84
8

119
Outcome
Measure
Reference
Population/
Diagnosis
Psychometric property
Fall Predictability
Validity
Reliability
MDC
Cutoff score
Sn
Sp
PPV
NPV
Tinetti
Performance-
Oriented
Mobility
Assessment
(Tinetti POMA);
Tinetti Balance
and Gait
Rehab Measure
updated until 2011-
2013
(Faber et al 2006,
Harada et al 2005,
Baloh et al 2008, van
Iersel et al, Thomas et
al 2005, Lin et al,
Soyuer et al 2007, Daly
et al 2006, Corriveau et
al 2004, Kegelmeyer et
al 2007, Behrman et al
2002, Gray et al 2009,
Kloos et al 2004, Shore
et al 2005
Older adults,
stroke,
Parkinson’s
Disease, ALS
Criterion
validity
against TUG,
FR, walking
speed
ICC = 0.4-
0.96
4
19-21
(Balance =
10-14)
64-85%
51-79%
NA
NA
Contreras & Grandas
2012
160
Parkinson’s
Disease; 72
men, 88
women;
(72±9.5 y/o)
NA
NA
NA
17.5
(Balance
11.5/16; Gait
10.5/12)
60%
(Balance
71%;
Gait
71%)
86%
(Balance
79%;
Gait
74%)
NA
NA
Canbek et al., 2013
55 inpatient
stroke patients
(75±11 y/o)
Criterion
validity
against FIM
motor
domain;
correlate
with gait
speed
NA
6
NA
NA
NA
NA
NA
Knobe et al., 2016
34 older adults
(79.5, range
66-93 y/o)
NA
NA
NA
20
45%
69%
NA
NA
Rovilta et al., 2019
90 patients of
rehab centers
in Italy;
(69.3±16.8 y/o)
NA
NA
NA
18
0.71
0.81
NA
NA

120
Outcome
Measure
Reference
Population/
Diagnosis
Psychometric property
Fall Predictability
Validity
Reliability
MDC
Cutoff score
Sn
Sp
PPV
NPV
The University
of Illinois in
Chicago Fear of
Falling Measure
(UIC FFM)
Velozo et al.,
2001*
106 community-
dwelling older
adults using Rasch
Analysis
NA
Cronbach α
= 0.93
NA
NA
NA
NA
NA
NA
Chen et al., 2014
(ISPRM
proceeding)
13 American and
24 Chinese
community-
dwelling older
adults (aged 60-97,
mean = 81.9 y/o)
NA
NA
NA
37 (total score =
48)
US AUC=0.80
China
AUC=0.85
0.64
0.67
0.80
0.86
3.21
4.67
0.45
0.39
121
Discussion
The Outcome Measure Toolkit project took over two years to complete. After scouring the literature available to us, 245
different outcome measures were identified. Upon closer inspection of the psychometrics and levels of aid in predictability of
falls, 150 of these measures, i.e., MMSE, were deemed irrelevant, as they were not directly related to balance, falls, or
functional mobility. The remaining 107 measures were retained with varying degrees of applicability as genuine measures of
fall risk. The taskforce performed a meticulous review of the psychometrics published for each of these measures, including the
more recent studies effected within the last five years. Seminal work, published between ten and twenty years ago, was also
included in the summary tables if the outcome measure had no recent evidence. There are 92 summary tables presented in this
document, due to there being no evidence in 16 of the outcome measures of psychometrics related to balance and fall
assessment.
Our taskforce purposefully focused on proffering recent publications, that is, within the last ten years. Consequentially, some
archaic but significant publications may have been omitted from this document. For optimal benefit, we recommend using this
in conjunction with other resources. Although we did our best to be thorough in the reviewing process, some articles may have
been missed, despite constant cross validation and updates. All feedback and suggestions are welcome! Ideally, the document
must be updated every three to five years to remain topical; please do consider joining the taskforce to help our project stay up
to date!
Psychometric analysis categorizes the measures into four groups: outcome measures with evidence of psychometric properties
and fall risk predictability, outcome measures not supported in relation to falls/balance assessment in the older adult, outcome
measures related to balance and fall risk assessment but warranting additional research for further validation, and outcome
measures that are widely utilized, but with limited recent supporting evidence. Broken down, there were 14 (13%), 29 (27%),
46 (43%), and 18 (17%), respectively. Quality of statistical analysis in the area of fall risk predictability was not commonly
found in publications released before 2008.
Several widely used outcome measures are not targeted at fall prediction in the older adults but do show emerging fall risk
evidence and methods for fall prediction in pediatrics, dementia, Parkinson's Disease, and Multiple Sclerosis.
We hope this anthology alludes the gap of knowledge and kindles the drive towards prospective research focusing on fall risk
predictability.
122
Appendix
a. Compiled List of Outcome Measures found during Phase 1 Search
1. 10 meter Walk Test
2. 10 m Maximal Walking Speed
3. 10 m Timed Walk Test
4. 100% Limits of Stability
5. 10 Minute Walk Test
6. 10 Times Sit to Stand
7. 2 Min Salk
8. 2 Step Test
9. 21 Item Fall Risk Index
10. 25 Question Geriatric
Locomotive Function Scale
11. 30 Second Chair Stand Test
12. 360 Degree Turn Time
13. 4 Meter Walk Test
14. 4 Stair Climbing Test
15. 4 Step Square Test
16. 4 Stage Test (STEADI)
17. 5 m Walk Time
18. 5 Times Sit to Stand
19. 50 ft Speed Walk
20. 6 Minute Walk Test
(6MWT)
21. 8 Foot Up and Go Test
22. Activities Specific Balance
Confidence Scale (ABC)
23. Activities Specific Fall Caution
Scale
24. Activity-Based Balance and Gait
25. Alternate Step Test
26. Activity Measure for Post-Acute
CARE (AM-PAC ADL)
27. AM-PAC Functional
28. Ankle Dorsiflexor Strength
29. Anxiety and Depression Scale
(HADS-A)
30. Area Ellipse of Postural Sway
31. Attitudes to Falls-Related
Interventions Scales
32. Back Scratch Test
33. Balance Evaluation Systems Test
(BESTest)
34. Balance Outcome Measure for
Elder Rehabilitation (BOOMER)
35. Balance Self-Efficacy Test
36. Balance Self-Perceptions Test
37. Barthel Index
38. Bed Rise Difficulty (BRD) Scale
39. Berg Balance Scale
40. BESTest
41. Brief BESTest
42. Brunel Balance Assessment
43. Canada Occupational
Performance Measure
44. Chair Stand Time
45. Clinical Test of Sensory
Interaction and Balance (CTSIB)
46. Community Balance and
Mobility Scale
47. CONFbal Scale of Balance
Confidence
48. Conley Scale
49. CSDD (Cornell Scale for
Depression in Dementia)
50. Demura's Fall Risk Assessment
Chart (DFRA)
51. Dizziness Handicap Inventory
52. Downton Fall Risk Index
53. Dual Task Gait Speed
54. Timed Up and Go – Dual Task
55. Dual Task Assessments
56. Dynamic Gait Index
57. Elderly Fall Screening Test
58. Elderly Mobility Scale
59. Established Populations for the
Epidemiologic Study of the
Elderly
60. Euroqual
61. Fall Assessment and Intervention
Record (FAIR)
62. Fall Assessment Risk and
Management Tool (FARAM)
63. Fall Perception Questionnaire
64. Fall Risk Assessment Tool
65. Fall Risk Assessment Tool for
Older People
66. Fall Risk for Older People in the
Community Assessment
67. Fall Risk Questionnaire
123
68. Falls Behavioral Scale
69. Falls Efficacy Scale (FES)
70. Falls Efficacy Scale -
International
71. Falls Prevention Strategy Survey
72. Falls Risk Assessment Tool
73. Falls-Efficacy Scale
74. Fast Gait Speed
75. Fear Avoidance Beliefs
Questionnaire (FABQ)
76. Fear of Falling (yes, no)
77. Fear of Falling Measure
78. FES
79. FES-1
80. FHI (Falls Handicap Inventory)
81. FICSIT-4 Balance Test
82. Figure 8 Walking Test
83. Functional Independence
Measure (FIM)
84. Floor Rise Test
85. Floor Transfer
86. Frenchay Activity Index
87. Fugl-Meyer Motor Assessment
88. Fullerton Advanced Balance
Scale (FAB)
89. Fulllerton Advanced Balance
Scale
90. Functional Ambulation Category
91. Functional Fitness Test
92. Functional Gait Assessment
93. Functional Independence
Measure
94. Functional Mobility Assessment
Tools (FMA)
95. Functional Reach Test
96. Gait Abnormality Rating Scale
97. Gait Efficacy Scale
98. Gait Initiation Time
99. Gait-Related Dual Task Tests
100. Gait Speed (m/s)
101. Gait Step Width
102. Geriatric Depression Scale
(GDS)
103. GDS-20
104. GDS-5
105. Geriatric Depression Scale
106. Geriatric Depression Scale Short
Form (GDS-15)
107. Geriatric Fear of Falling
Assessment
108. Global Deterioration Scale
109. Goal Attainment Scale
110. Grip Strength
111. Groningen Activity Restriction
Scale
112. Guralnik Test Battery
113. Habitual Gait Speed
114. Hospital Anxiety and Depression
Scale (HADS)
115. Hand Grip Test
116. Hauser Ambulation Index
117. Health-Related Quality of Life
(HRQOL)
118. Hendrich II Fall Risk Model
119. High Level Mobility Assessment
Tool
120. Home Falls and Accidental
Screening Tool
121. Illinois Fear of Falling
122. International Physical Activity
Questionnaire
123. Katz Activities of Daily Living
Index
124. Knee Extension Strength (KES)
125. L Test
126. LASA Fall Risk Profile
127. Late Life Function and Disability
Instrument
128. Lateral Plank Time
129. Lateral Reach Test
130. Lawton's Instrumental Activities
of Daily Living scale
131. LE Strength/MMT
132. Limits of Stability
133. Missouri Alliance for Home Care
(MAHC-10)
134. Maximal Walking Speed
135. Maximum Step Length Test
136. Melbourne Fall Risk Assessment
Tool (MFRAT)
137. mFES
138. Mini BESTest
139. Mini International
Neuropsychiatric Interview
140. Mini Mental Assessment
141. Mini Cog
142. Minimal Chair Height Standing
Ability
143. Mini Mental State Examination
(MMSE)
144. Mobility Interaction Fall Chart
145. Modified Clinical Test of
Sensory Interaction and Balance
(mCTSIB)
124
146. Modified Falls Efficacy Scale
(MFES)
147. Modified Falls Efficacy Scale/
Short Falls Efficacy Scale
148. Modified Functional Reach
149. Modified Gait Efficacy Scale
150. Montly Fall Diaries
151. Morse Fall Scale
152. Motor Fitness Scale
153. Multi-Directional Reach Test
154. Multiple Lunge Test
155. Multiple Sclerosis Walking Scale
- 12
156. Muscle Power
157. NeuroCom Balance Tests
158. Norwegian General Motor
Function Assessment
159. One Leg Stance Test
160. Parameters of Gait
161. Patient Specific Functional Scale
162. Penisual Health Fall Risk
Assessment Tool (PHRAT)
163. Perceived Participation and
Autonomy
164. Performance Oriented Mobility
Assessment (POMA)
165. Performance Oriented Mobility
Assessment - Balance
166. Peter James Centre Fall Risk
Assessment Tool
167. Physical Activity Questionnaire
168. Physical Mobility Scale
169. Physical Performance Scale
170. Physical Performance Test
171. Physiological Profile Assessment
172. Push and Release Test
173. Quadriceps Strength
174. Quantitative Gait Assessment
175. Queensland Fall Risk
Assessment Tool (QFRAT)
176. RAFS II
177. Rapid Step Test
178. Reaction Time Tests
179. rFES
180. Rhomberg Stance
181. Rivermead Mobility Index
182. Rogers Modular Obstacle Course
183. Romberg Test
184. SAFFE (Survey of Activities and
Fear of Falling in the Elderly)
185. Self-Reported Missteps (defined
as a trip, slip, or other loss of
balance in which recovery
occurred to prevent a fall)
186. Self-Selected Gait speed
187. Self-Selected Walking Speed
188. Self-Efficacy Scale (SES)
189. Sensory Organization testing
190. SF-12
191. SF36
192. Short Falls Efficacy Scale
International
193. Short Form Berg Balance Scale -
3 Point
194. Short Physical Performance
Battery (SPPB)
195. Short Form 12
196. Short Form 36
197. Short Form Health Survey (SF-8)
198. Shuttle Walk
199. Sickness Impact Profile Physical
Dimension
200. Single Leg Stance
201. Single Limb Stance
202. Single Stance Time
203. Sit and Reach Test
204. 6 Minute Walk Test
205. St. Thomas's Risk Assessment
Tool (STRATFY)
206. Stage 3 Balance Test
207. Stair Climb Power Test (SCPT)
208. Static Posturography
209. STEADI
210. Step Quick Turn
211. Step Reaction Time
212. Step Test
213. Step Up Test
214. STRATIFY (St Thomas Risk
Assessment Tool)
215. Strength Frail Older Adults
Outcome Measure
216. Stride to Stride Variability
217. Stroke Assessment of Fall Risk
218. Stroop Stepping Test
219. Subjective Risk Rating of
Specific Tasks (SRRT)
220. Tandem Gait
221. Tandem Stance
222. Tandem Test
223. The Obstacle Course
224. The Step Test
225. Time to Walk 10 m
226. Timed 25 Foot Walk Test
227. Timed Get Up and Go Test
228. Timed Tandem Stance
125
229. Timed Up and Go
230. Timed Up and Go - Dual Task
231. Tinetti Balance and Gait
Assessment
232. Tinetti Balance and Gait
Evaluation
233. Tinetti Gait and Balance Measure
234. Tinetti Performance-Oriented
Mobility Assessment
235. Toe Elevation Angles
236. TUG Dual Tasking
237. 2 Minute Walk Test
238. Unipedal Stance
239. University of Illinois at Chicago
Fear of Falling Measure (UIC
FFM)
240. Walking and Remembering Test
241. Walking While Talking Test
242. Wall Sit Test
243. Weight Bearing Symmetry
244. Western Ontario and McMaster
Osteoarthritis Index (WOMAC)
245. World Health Organization
Quality of Life (WHOQoL)
126
b. Outcome Measure Toolkit Project Article Review Instructions
1. Each month, each taskforce member received five outcome measures to review with suggested search terms/keywords
2. At the end of the month (or as finished), members sent back the results in a word document (one table per outcome measure)
a. Template was provided as well as two examples
3. Members were instructed:
a. If, in your research, you find that an outcome measure may not be appropriate, please flag it as such and let us know.
b. If you are finished early and have extra time to dedicate to the project, please let us know and we can send you additional measures to
look up
c. If you cannot find evidence for a certain aspect (like reliability) don’t worry! It’s possible that many of these measures don’t have
psychometrics to support their use in certain areas.
d. We recommend that you use the name of the test as well as any similar names as listed in the Excel sheet. If you find a similar term used
to describe the test, please let us know so we can add it to the main list.
e. It is also helpful to search the following keywords in addition to the name of the test:
. Validity
Reliability
MDC/MCID
Cutoff Score
Sensitivity
Specificity
Positive Predictive Value
Negative Predictive Value
f. Use “ “ to ensure your search terms come up in your search results and narrow down extraneous items
4. Each month, members had a conference call (2nd week of each month) to follow up on each person’s progress. It was at this time that
taskforce shared aberrant findings such as:
• Validated outcome measures without current (<5yr) evidence
• Measures that might not be appropriate for consideration
• Additional measures that should be included
• Measures that were grouped d/t terminology but which should be separated
• Measures that should be grouped with other measures d/t overt similarities
• Not having access to an article (language, needing to pay for the article, access to data base)
• Other problems that were identified

127
c. Outcome Measure Summary Table Template
Outcome
Measure
Reference
Population/
Diagnosis
Psychometric property
Fall Predictability
Validity
Reliability
MDC
Cutoff score
Sn
Sp
PPV
NPV
Legend:
* indicates the original article of the outcome measure.
NA = Not assessed
MDC = Minimum Detectable Change
Sn = Sensitivity
Sp = Specificity
PPV = Positive Predictive Value
NPV = Negative Predictive Value
