
How to Read and Interpret my
PFAS Laboratory Data Report
MAINE DEPARTMENT OF ENVIRONMENTAL PROTECTION
www.maine.gov/dep
Laboratory data reports may at first seem difficult to read and interpret. Although required
information is included in the report, each laboratory may present the information in differing ways.
In general, each laboratory report must include a cover page, a list defining abbreviations used in
the report, a summary of issues that the laboratory may have had during sample analysis, a report of
sample results including dates and times of sample collection, sample receipt, sample preparation
and analysis, several sections summarizing laboratory quality control measurements, and a copy of
the chain of custody form and related sample receipt documentation.
Example Report of Sample Results:
Result = The concentraon of the
compound detected
This number is compared to Maine’s
Interim Drinking Water Standard, which is
currently 20 parts per trillion
Parameter Result Units Qualier RL MDL Diluon
Factor
Peruorooctanoic Acid (PFOA) 21.2 ng/L 1.95 0.230 1
Peruorooctane Sulfonic Acid
(PFOS)
ND ng/L U 1.95 0.491 1
ND = Non-Detect
ND means the compound
was not detected at a level
high enough for the
laboratory equipment to
detect
RL = Reporng Limit
The RL is the limit to which the
laboratory equipment can
reliably report under normal
laboratory condions
MDL = Method Detecon Limit
The MDL is the lowest
concentraon that the laboratory
test equipment can detect a
contaminant
Note: ng/L = Nanograms per liter or parts per trillion (ppt)
Laboratory Quality Control
A testing laboratory is required to implement a series of practices to ensure that results generated
during the testing of samples are accurate and complete. Each laboratory report will include several
pages of quality control information. This information can easily be confused with actual sample
results. Actual sample results will be labelled as such and include a specific sample identification
number, client identification number, and sample location. Quality control data will include
terminology such as method blank analysis, batch quality control, lab quality control analysis, matrix
spike analysis, and lab duplicate analysis. Each laboratory report is reviewed by qualified DEP staff
prior to sending you the data to ensure that the data are of high quality and dependable. If not, DEP
staff may ask to repeat the sampling and testing.
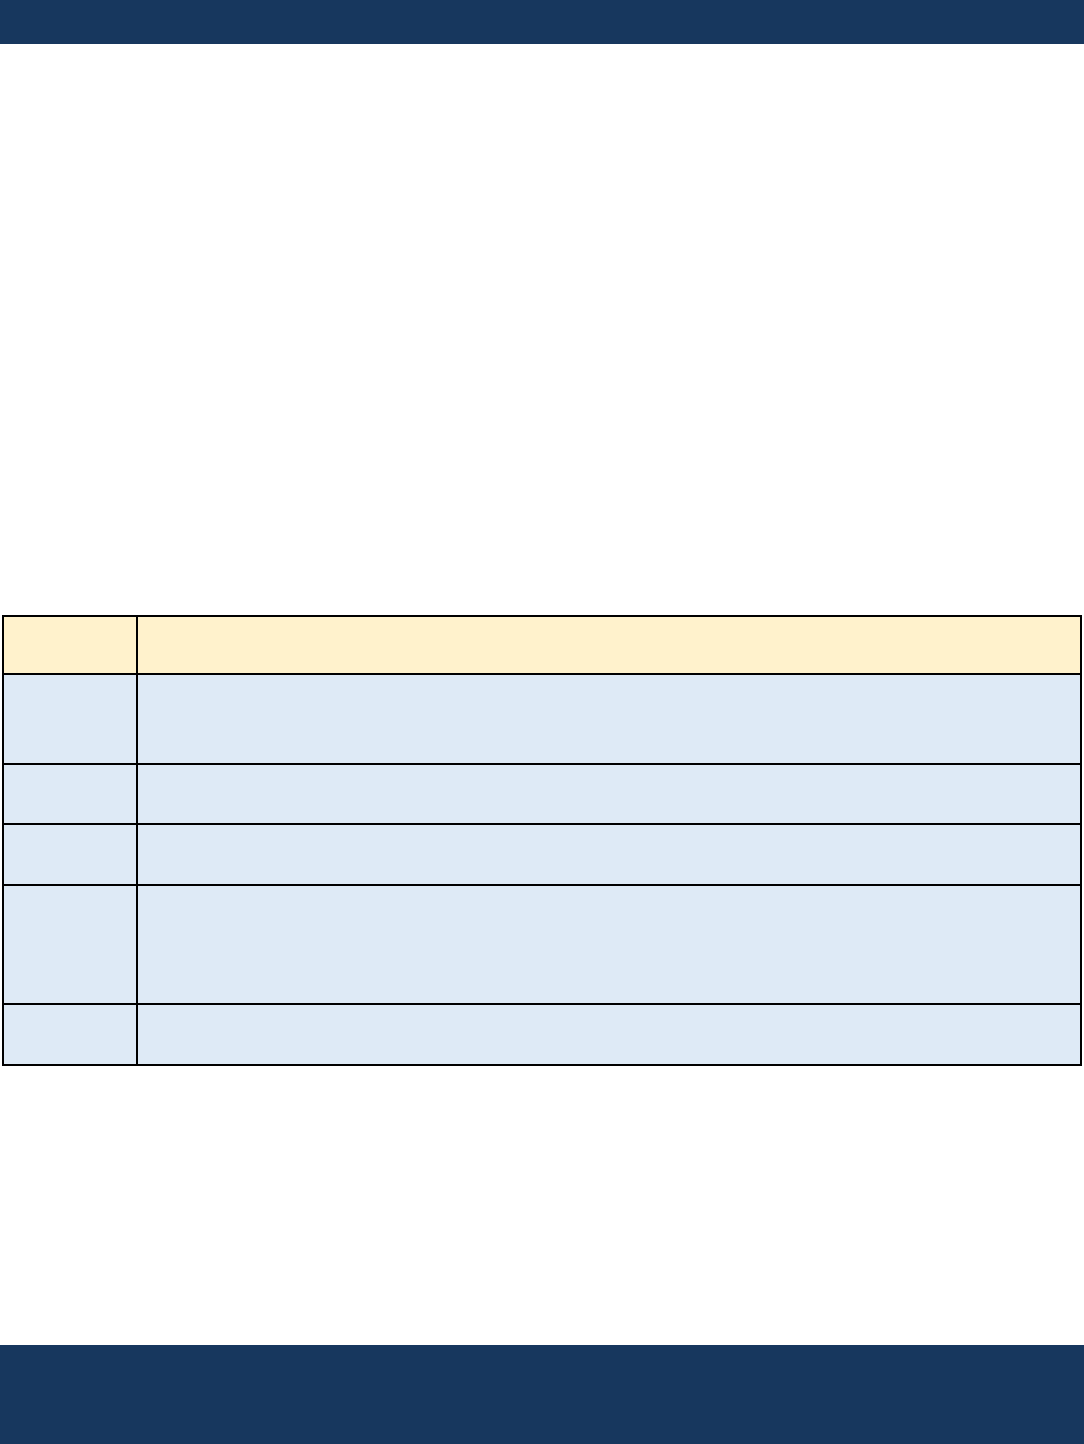
Common Laboratory Data Qualifiers
Each laboratory report should include a list defining abbreviations used in the report. Laboratories do
not all use the same abbreviations, so it is important to check the list included in the report. The
most common abbreviations, called data qualifiers, used by a laboratory are as follows:
MAINE DEPARTMENT OF ENVIRONMENTAL PROTECTION
www.maine.gov/dep
Qualier Denion
B
The compound was detected in a blank sample. This is a quality control measure that denes
whether there is uncertainty in the source of contaminaon. B qualiers indicate the sample
result may be biased high.
U
The compound was not detected at a level greater than the laboratory method detecon limit
(MDL).
J
The compound was detected at a level greater than the laboratory MDL and less than the
reporng limit. J qualiers indicate an unknown bias to the sample result.
E
The compound was detected at a level that exceeded the laboratory instrument calibraon
curve. E qualiers generally indicate a low bias to the sample result. Compounds with an E
qualier will have another result reported for a diluted analysis to bring the compound within
the laboratory calibraon curve. This result is generally on a subsequent page in the report.
F, Q or I
F, Q or I qualiers generally indicate a high bias to the sample result and the reported result
should be considered a maximum concentraon.

Where can I find more information?
PFAS Laboratory Questions:
General PFAS Inquiries: pfas.dep@maine.gov
Maine DEP PFAS webpage: www1.maine.gov/dep/spills/topics/pfas/index.html
How is the Sum of 6 Calculated?
In June 2021, the Department began applying an interim standard of 20 ppt (ng/L) for the sum of 6
PFAS in drinking water. These compounds are PFOA, PFOS, PFNA, PFHpA, PFHxS and PFDA.
Results above the reporting limit are used in the calculation as reported in the laboratory report.
Results reported with a “J” qualifier are below the reporting limit and above the laboratory method
detection limit (MDL) and are used in the calculation as shown in the laboratory report. Non-detect
(ND) results are below the laboratory MDL, and a value of zero is used in the calculation.
The table below illustrates how the Sum of 6 is calculated:
MAINE DEPARTMENT OF ENVIRONMENTAL PROTECTION
www.maine.gov/dep
Compound Result from Lab
Report (ng/L)
Qualier Reporng Limit (ng/L) Result used in Calculaon
(ng/L)
PFOA 170 1.8 170
PFOS 185 B 1.8 185
PFNA 10 1.8 10
PFHpA 142 1.8 142
PFHxS 0.242 J 1.8 0.242
PFDA ND U 1.8 0
Calculated Sum of 6 507
