REPORTED ROAD CRASHES
IN WESTERN AUSTRALIA 2011
Reported Road Crashes in Western Australia 2011 i
Road Safety Council of Western Australia
Document Retrieval Information
___________________________________________________________________________
Date
Pages
ISSN
September 2013
133
1836-1927
___________________________________________________________________________
TITLE
Reported Road Crashes in Western Australia 2011
___________________________________________________________________________
AUTHOR(S)
Thompson PE, Hill DL, Beidatsch KP, Bramwell J
___________________________________________________________________________
PERFORMING ORGANISATION
Data Analysis Australia
97 Broadway
NEDLANDS WA 6009
Tel: (08) 9386 3304
Fax: (08) 9386 3202
___________________________________________________________________________
SPONSOR
Office of Road Safety
Main Roads WA
Waterloo Crescent
East Perth WA 6004
Tel: (08) 9323 4688
Fax: (08) 9323 4995
___________________________________________________________________________
ABSTRACT
This report presents information on road crashes that occurred in Western Australia in 2011.
There were 39,457 police-reported road crashes involving 76,182 vehicles and 2,644 persons
killed or seriously injured.
___________________________________________________________________________
KEYWORDS
Road crash statistics, Crash severity, Blood alcohol concentration, Drink driving, Drugs,
Fatality, Helmet use, Injury, Restraint use, Road environment, Metropolitan area, Regional
area, Remote area, Seat belt, Speeding, Urban area, Vehicle type, Western Australia.
___________________________________________________________________________
NOTE
This report is distributed in the interests of information exchange and is available on the Internet at the
Office of Road Safety web site < http://www.officeofroadsafety.wa.gov.au/ >. On the Main Roads
Western Australia web site < http://www.mainroads.wa.gov.au >, intersection rankings and metropolitan
traffic flows can be viewed. This publication is also available in alternative formats (e.g. audio tape,
computer disc, large print or Braille) by contacting the Office of Road Safety on 138 138.

Reported Road Crashes in Western Australia 2011 ii
FOREWORD
In 2011, 175 police-reported road crash fatalities occurred on Western Australian roads. This figure was
eight per cent lower than the 2010 figure of 193. The number of people seriously injured in police-
reported road crashes also dropped by two per cent, from 2,531 in 2010 to 2,469 in 2011.
While any reduction in road crash fatalities or serious injuries is good news, it does not give us a reason
to be complacent. Western Australia still has a higher fatality rate per 100,000 residents (7.4) than the
whole of Australia (5.7) and is ranked second worst of all Australian states and territories. This is
largely due to the high proportion of Western Australian fatalities (58%) occurring on regional and
remote roads.
Launched in 2008, the State Government’s Towards Zero strategy ambitiously aims to reduce the
number of deaths and serious injuries on our roads by 11,000 by 2020. Based on the Safe System
approach, it recognises that driver behaviour is not the only contributing factor to road trauma. Instead,
it focuses on the four key cornerstones of Safe Road Use, Safe Roads and Roadsides, Safe Speeds
and Safe Vehicles.
Produced annually, this crash book helps track our progress in the fight to reduce road trauma and is a
useful tool for the road safety community. It provides us with a clear breakdown of the road safety
statistics for each year and gives us the opportunity to target areas of high priority with education
campaigns and other supporting initiatives.
In 2011, speed and alcohol remained contributing factors in many of the fatal and serious injury
crashes.
Speed played a role in 27% of the fatal crashes and 68% of these were single vehicle incidents. These
figures were even higher when considering motorcycles only, with 55% of motorcyclist fatalities
occurring in speed-related crashes.
More than one-fifth (22%) of police-attended fatal crashes and 10% of serious injury crashes involved a
driver or rider with a blood alcohol limit of 0.05g/100ml or above. The clear majority (89%) of these
were male.
When considering the age of those killed on our roads, the number of fatalities among drivers aged 60-
plus increased by 34% but those in the 25 to 39 and 40 to 59 year age brackets dropped by 24% and
22% respectively.
While this may be some indication that our road safety messages are reaching younger road users,
males continue to display more careless and high risk behaviours than their female counterparts.
Of all fatalities reported in 2011, 74% were male while the number of fatalities for females actually
dropped by 21%. Almost one-third of the males killed in road crashes were not wearing a seatbelt,
compared to 17% of females.
Failure to wear helmets also contributed to one of the 25 motorcylist fatalities and two of the three
cyclist fatalities. Furthermore, more than one-fifth of cyclists seriously injured in crashes were not
wearing a helmet.
This is a senseless and tragic loss of life that may have been prevented with a simple change of
behaviour.
With support from the State Government, community and other road agencies, the Road Safety Council
will continue to implement the four cornerstones of Towards Zero for a safe system to reduce the
devastating effects of road trauma.

Reported Road Crashes in Western Australia 2011 iii
In addition to speed and impaired driving, we will be giving priority to the improvement of urban
intersections, which are the scene of more than one-quarter of metropolitan fatal crashes. Initiatives
that counteract the high numbers of fatal ‘run-off road’ crashes in regional and remote areas and inform
the market to demand safer vehicles are high on our agenda going forward.
Professor Murray Lampard APM
Independent Chair
Road Safety Council

Reported Road Crashes in Western Australia 2011 iv
KEY ROAD CRASH FACTS FOR 2011
Fatalities
In 2011, there were 175 police-reported road crash fatalities in Western Australia, which was 16
lower than in 2010.
The number of fatalities was 8% lower than the previous year.
Persons Seriously Injured
In 2011, there were 2,469 people seriously injured in police-reported road crashes, compared
to 2,531 in 2010.
The number of persons seriously injured was 2% lower than the previous year.
Trends in Crashes
The fatality rate per 100,000 population for Western Australia was 7.4 (ranked 7th out of all
Australian States and Territories), compared to 5.7 for the whole of Australia.
Of fatal crashes, 42% occurred in the Metropolitan region, 35% occurred in Regional areas and
23% in Remote areas.
Of hospitalisation crashes, 70% occurred in the Metropolitan region, 19% occurred in Regional
areas and 11% in Remote areas.
In 2011, the number of fatalities in the 60 years or older age group was 34% higher than the
previous year, where the 25 to 39 year and 40 to 59 year ages groups were lower by 24% and
22%, respectively. The number of fatalities for females decreased by 21% from 2010.
All Road Users
Of all fatalities, 74% were male and 26% were female.
Of all fatalities, 25% were aged between 17 and 24 years and 24% were aged between 25 and
39 years.
Almost half (49%) of all fatalities were drivers, 21% were passengers, 14% were motorcyclists
and 14% were pedestrians.
Child Road Users
Children aged 16 years and under made up 8% of all persons killed or seriously injured.
The highest proportion of child road users who were killed or seriously injured were passengers
(57%) followed by pedestrians with 28%.
Of child motor vehicle occupants in police-attended crashes who were killed or seriously
injured, 18% were not wearing a seat belt, compared to 7% of all persons.
Five of the seven (71%) child bicyclists who were killed or seriously injured were not wearing
helmets.
Of all children killed or seriously injured, 34% were killed or seriously injured between 3pm to
6pm.
Of all accidents where children were killed or seriously injured, 22% occurred on a Saturday.
Reported Road Crashes in Western Australia 2011 v
Young Adult Road Users
Persons aged 17 to 24 years made up 24% of all persons killed or seriously injured.
Of young adult road users who were killed or seriously injured, 54% were drivers, 26% were
passengers and 12% were motorcyclists.
Of young adult road users who were killed or seriously injured in police-attended crashes, 19%
were in crashes where speed was a factor. In comparison, of all persons killed or seriously
injured in police-attended crashes, 14% were in crashes where speed was factor.
Of young adult road users who were killed or seriously injured in police-attended crashes, 13%
were in alcohol-related crashes (i.e. involving a driver/rider with a BAC of 0.05 g/100mL or
above), compared to 10% for all persons killed or seriously injured in police-attended crashes.
Mature Adult Road Users
Persons aged 25 to 59 years accounted for 51% of all persons killed or seriously injured.
Over half (54%) of mature adult road users who were killed or seriously injured were drivers,
21% were motorcyclists and 14% were motor vehicle passengers.
Senior Adult Road Users
Persons aged 60 years and over made up 12% of all persons killed or seriously injured.
Of senior adult road users who were killed or seriously injured, 65% were drivers, 14% were
passengers, 9% were motorcyclists and 9% were pedestrians.
More than half (59%) of senior adult drivers/riders involved in serious crashes were in
‘Intersection’ crashes. This compares with 48% of all drivers/riders involved in serious crashes.
Speed
Speed was a factor in 27% of police-attended fatal crashes.
The percentage of police-attended fatal crashes that were speed-related was highest in the
Metropolitan region (35%) and lowest in the Regional Towards Zero region (19%).
More than half (55%) of motorcyclist fatalities occurred in speed-related crashes attended by
police.
More than two thirds (68%) of speed-related fatal crashes attended by police were
single-vehicle crashes and 80% of these were ‘Hit Object’ crashes.
Alcohol
More than one fifth (22%) of police-attended fatal crashes involved a driver/rider with a BAC of
0.05 g/100mL or above.
Among road users killed or seriously injured, 11% were involved in alcohol-related crashes
attended by police (i.e. crashes involving a driver/rider with a BAC of 0.05 g/100mL or above).
The majority (89%) of drivers/riders involved in alcohol-related police-attended fatal crashes
were male.
Seven of the 24 pedestrian fatalities in police-attended crashes had a BAC of 0.05 g/100mL or
above.
Reported Road Crashes in Western Australia 2011 vi
Illegal Drugs
Almost one fifth (17%) of the 161 fatalities matched to the crash data had illegal drugs detected
in their systems.
More than a third (36%) of the 42 fatalities from age group 17 to 24 matched to the crash data
had illegal drugs detected in their systems.
More than a fifth (22%) of the 23 motorcyclist fatalities matched to the crash data had illegal
drugs detected in their systems. Just over one fifth (21%) of the pedestrian fatalities matched
to the crash data had illegal drugs detected in their systems.
Seat Belts
More than one quarter (26%) of motor vehicle occupant fatalities in police-attended crashes
were not wearing a seat belt.
Thirty per cent of male and 17% of female motor vehicle occupant fatalities in police-attended
crashes were not wearing a seat belt.
Helmets
One of the 25 motorcyclist fatalities in police-attended crashes was not wearing a helmet.
Of the three bicyclist fatalities in police-attended crashes, two were not wearing helmets.
More than one fifth (21%) of bicyclists seriously injured in crashes attended by police were not
wearing a helmet.
Crash Nature
Single-vehicle crashes constituted 66% of all fatal crashes.
Single-vehicle crashes accounted for 87% of fatal crashes in Remote areas, 74% of fatal
crashes in Regional areas and 47% of fatal crashes in the Metropolitan region.
More than a quarter (27%) of fatal crashes in the Metropolitan region occurred at an
intersection.
In Remote areas, 68% of fatal crashes were ‘Run Off Road’ crashes, compared to 60% of fatal
crashes in Regional areas and 31% of fatal crashes in the Metropolitan region.
In Remote areas, 5% of fatal crashes were ‘Head On’ crashes, compared to 18% in the
Metropolitan region and 11% in Regional areas.
Hospital Inpatient Data
Hospital inpatient data showed there were 4,234 people admitted to hospital due to road
crashes, of whom 32 people died after admission to hospital.
Indigenous Australians made up 7% of hospital inpatients resulting from road crashes.
Almost two thirds (32%) of hospital inpatients were motor vehicle drivers and 22% were
motorcyclists.

Reported Road Crashes in Western Australia 2011 vii
Key Performance Indicators
The key performance indicators below provide a more detailed breakdown of the broader performance indicators that are set out in Towards Zero, the State
Government’s road safety strategy for 2008-2020. The indicators have been approved by the Road Safety Council, and will be the means by which the
annual progress of the Strategy is monitored. The indicators are subject to regular review, and may change during the life of the Strategy.
Year
2011 Change from
2010
KPI
2006
2007
2008
2009
2010
2011
Number of hospitalised bed days
Cumulative length of stay (days)
28,213.71
28,755.76
31,219.20
31,561.40
29,886.48
26,716.54
-10.6
Average length of stay (days)
8.3
8.0
8.1
8.0
7.4
6.3
-15.2
Cost of crashes to the WA community (2011 dollars)
1
Cost ($m) – Human Capital
2,257.0
2,391.6
2,329.9
2,121.9
2,146.8
2,085.0
-2.9
Cost ($m) – Willingness to pay
-
3,229.4
2,975.3
2,793.6
2,826.8
2,711.9
-4.1
Number of serious crashes by Towards Zero regions
Metropolitan
1,542
1,617
1,685
1,482
1,464
1,467
0.2
Regional
446
465
500
427
459
444
-3.3
Remote
316
319
279
274
282
258
-8.5
Number of persons killed or seriously injured
Persons KSI
2,965
3,019
3,095
2,759
2,722
2,644
-2.9
Percentage of vehicles exceeding the speed limit by speed zone
2
60 km/h
n/a
51.0
41.2
38.2
46.6
48.2
3.4
70 km/h
n/a
41.4
26.0
21.3
37.4
37.0
-1.1
80 km/h
n/a
37.3
29.2
23.5
39.9
34.0
-14.8
90 km/h
n/a
24.6
34.5
33.7
26.6
27.8
4.5
100 km/h
n/a
33.8
35.0
43.3
20.2
32.3
59.9
110 km/h
n/a
23.6
28.1
30.3
23.8
15.5
-34.9
Injury rates for persons killed or seriously injured
3
Persons KSI per 100,000 population
144.0
142.8
142.1
122.8
118.5
112.4
-5.2
Persons KSI per 10,000 registered vehicles
18.5
18.0
17.7
15.1
14.6
13.8
-5.0
Persons KSI per 100 million km travelled
3
13.1
12.4
12.2
10.7
10.4
9.9
-4.5
1. For details on data sources and methodology, refer to Section 2.2 on page 16.
2. For details on data sources and methodology, refer to section 4.3 on page 76.
3. The 2008 and 2009 KSI rates per 100 million km travelled is based on average kilometres travelled (interpolated between 2007 and 2010 figures) and number of registered vehicles in each year.

Reported Road Crashes in Western Australia 2011 viii
Year
2011 Change from
2010
2006
2007
2008
2009
2010
2011
KPI
n
%
n
%
n
%
n
%
n
%
n
%
%
Number and percentage of persons killed or seriously injured in police-attended crashes involving illegal behaviour
4,5,6
Speed a factor
4
497
19.5
494
18.7
477
17.6
412
17.1
340
14.2
334
14.3
-1.8
Alcohol a factor
4
308
12.1
400
15.2
313
11.6
334
13.9
282
11.7
253
10.8
-10.3
Seat belt not worn
5
196
9.9
186
9.1
157
7.7
157
9
132
7.5
119
7
-9.8
Helmet not worn (motorcyclists)
29
9
41
12.2
37
10.1
38
11.1
36
9.9
22
6
-38.9
Helmet not worn (bicyclists)
23
33.8
23
33.3
22
21.6
23
27.1
19
23.2
19
22.4
0.0
Illegal drugs (fatalities)
6
42
20.9
61
26.0
46
24.9
38
21.6
37
21.3
28
17.4
-24.3
Number and percentage of persons killed or seriously injured by road user type
Driver
1,493
50.4
1,570
52.0
1,532
49.5
1,282
46.5
1,328
48.8
1,271
48.1
-4.3
Passenger
763
25.7
747
24.7
736
23.8
700
25.4
607
22.3
584
22.1
-3.8
Pedestrian
202
6.8
180
6.0
200
6.5
236
8.6
204
7.5
213
8.1
4.4
Bicyclist
86
2.9
92
3.0
119
3.8
112
4.1
111
4.1
105
4.0
-5.4
Motorcyclist
373
12.6
376
12.5
420
13.6
386
14.0
421
15.5
424
16.0
0.7
Scooter/Moped user
4
0.1
5
0.2
6
0.2
7
0.3
-
0.0
1
0.0
N/A
Heavy vehicle occupant
44
1.5
49
1.6
82
2.6
36
1.3
51
1.9
46
1.7
-9.8
Number and percentage of persons killed or seriously injured in crashes at intersections by Towards Zero areas
Metropolitan
983
83.2
1055
82.9
1108
83.0
1003
83.7
942
83.2
884
81.0
-6.2
Regional
150
12.7
167
13.1
162
12.1
142
11.8
151
13.3
161
14.8
6.6
Remote
48
4.1
51
4.0
65
4.9
54
4.5
39
3.4
46
4.2
17.9
Number and percentage of persons killed or seriously injured in head on crashes by Towards Zero areas
Metropolitan
91
55.8
124
61.1
89
56.7
79
52.0
86
52.8
86
57.3
0.0
Regional
48
29.4
46
22.7
55
35.0
55
36.2
45
27.6
42
28.0
-6.7
Remote
24
14.7
33
16.3
13
8.3
18
11.8
32
19.6
22
14.7
-31.3
Number and percentage of persons killed or seriously injured run off road crashes by Towards Zero areas
Metropolitan
436
40.5
451
41.7
454
41.0
398
42.7
350
36.7
388
42.9
10.9
Regional
325
30.2
301
27.8
361
32.6
287
30.8
311
32.6
281
31.0
-9.6
Remote
316
29.3
329
30.4
292
26.4
248
26.6
293
30.7
236
26.1
-19.5
4. Speed and alcohol-related crashes refer to police-attended crashes only.
5. Motor vehicle occupants in police-attended crashes only.
6. Illegal drug data obtained from the Forensic Science Laboratory, Chemistry Centre of Western Australia for fatalities only.

Reported Road Crashes in Western Australia 2011 ix
TABLE OF CONTENTS
LIST OF TABLES .................................................................................................................. xi
LIST OF FIGURES ............................................................................................................... xvi
LIST OF MAPS ...................................................................................................................xviii
1. INTRODUCTION ............................................................................................................. 1
1.1 DATA SOURCES AND ACKNOWLEDGEMENTS ................................................................ 1
1.2 READING AND INTERPRETING THE REPORT.................................................................. 2
1.3 TOWARDS ZERO PRIORITY CRASH TYPES ................................................................... 3
1.4 REPORTING REGIONS AND ACCESSIBILITY/REMOTENESS INDEX OF AUSTRALIA ............. 4
1.5 SELECTED WESTERN AUSTRALIAN STATISTICAL INDICATORS ....................................... 8
2. ROAD CRASH AND INJURY SUMMARIES ................................................................. 10
2.1 HISTORICAL INFORMATION ....................................................................................... 10
2.2 COST OF CRASHES .................................................................................................. 16
2.3 COMPARISON WITH OTHER STATES AND TERRITORIES ............................................... 18
2.4 GENDER AND AGE ................................................................................................... 19
2.5 ROAD USER TYPES .................................................................................................. 23
3. BROAD AGE GROUPS ................................................................................................ 30
3.1 CHILD ROAD USERS – 0 TO 16 YEARS ....................................................................... 30
3.2 YOUNG ADULT ROAD USERS – 17 TO 24 YEARS ........................................................ 33
3.3 MATURE ADULT ROAD USERS – 25 TO 59 YEARS....................................................... 38
3.4 SENIOR ADULT ROAD USERS – 60 YEARS OR OLDER ................................................. 44
4. SAFE SYSTEM ............................................................................................................. 48
4.1 SAFE ROAD USER BEHAVIOURS ............................................................................... 48
4.1.1 Speeding ........................................................................................................ 48
4.1.2 Alcohol ........................................................................................................... 56
4.1.3 Illegal Drugs ................................................................................................... 61
4.1.4 Seat Belts ....................................................................................................... 64
4.1.5 Helmets .......................................................................................................... 69
4.2 SAFE ROADS AND ROADSIDES .................................................................................. 71
4.2.1 Road Factors ................................................................................................. 71
4.2.2 Crash Nature .................................................................................................. 72
4.3 SAFE SPEEDS ......................................................................................................... 76
4.3.1 Speed Zones .................................................................................................. 76
4.3.2 Speed Compliance ......................................................................................... 76
4.4 SAFE VEHICLES ....................................................................................................... 78
4.4.1 ANCAP Safety Ratings ................................................................................... 78
4.4.2 Vehicle Type .................................................................................................. 80
4.4.3 Airbags ........................................................................................................... 81
5. OTHER FACTORS ........................................................................................................ 82
5.1 TEMPORAL FACTORS ............................................................................................... 82
6. REGIONAL SUMMARIES ............................................................................................. 84
6.1 REGIONAL COMPARISONS ........................................................................................ 84
6.2 REGIONAL CRASH AND CASUALTY RATES ................................................................. 91
6.3 GOLDFIELDS .......................................................................................................... 100
6.4 GREAT SOUTHERN ................................................................................................ 103
6.5 KIMBERLEY ........................................................................................................... 106

Reported Road Crashes in Western Australia 2011 x
6.6 MID WEST ............................................................................................................. 110
6.7 PILBARA-GASCOYNE .............................................................................................. 114
6.8 SOUTH WEST ........................................................................................................ 118
6.9 WHEATBELT NORTH ............................................................................................... 121
6.10 WHEATBELT SOUTH ............................................................................................... 125
7. HOSPITAL INPATIENT DATA .................................................................................... 129
Appendix A Trends Over Time .................................................................................. 134
Appendix B Additional Crash and Injury Tables ...................................................... 138
Appendix C P72 Form ................................................................................................ 143
Appendix D Safe Systems Diagram ................................... Error! Bookmark not defined.
Appendix E Road Safety-Related Legislation and Other Initiatives ........................... 144
GLOSSARY OF TERMS ..................................................................................................... 152

Reported Road Crashes in Western Australia 2011 xi
LIST OF TABLES
Introduction
Table 1 ARIA Scores and Categories ............................................................................................... 4
Table 2 2011 Western Australian Population by ARIA Category ..................................................... 4
Table 3 Statistical Indicators of the Western Australian Economy by Year ...................................... 8
Table 4 Western Australian Population by Gender and Age Group by Year ................................... 9
Road Crash and Injury Summaries
Table 5 Crash Severity by Year ...................................................................................................... 13
Table 6 Injury Severity by Year ....................................................................................................... 13
Table 7 Injury Rates per 100,000 Population by Severity and Year ............................................... 14
Table 8 Injury Rates per 10,000 Registered Vehicles by Severity and Year .................................. 14
Table 9 Injury Rates per 100 Million Kilometres Travelled by Severity and Year .......................... 14
Table 10 Crash Severity by Towards Zero Region ........................................................................... 15
Table 11 Injury Severity by Towards Zero Region ........................................................................... 15
Table 12 Crash Severity by ARIA Category ..................................................................................... 15
Table 13 Injury Severity by ARIA Category ...................................................................................... 15
Table 14 Estimated Cost of Crashes to the Western Australian Community ................................... 17
Table 15 Fatality Rates per 100,000 Population by Year - Australian States and Territories .......... 18
Table 16 Fatalities by Gender and Age Group by Year .................................................................... 19
Table 17 Fatalities by Age Group and Gender ................................................................................. 20
Table 18 Fatalities by Age Group Subtotals and Gender ................................................................. 21
Table 19 Persons Seriously Injured by Gender and Age Group by Year ......................................... 21
Table 20 Persons Seriously Injured by Age Group and Gender ...................................................... 22
Table 21 Persons Seriously Injured by Age Group Subtotals and Gender ...................................... 22
Table 22 Fatalities by Road User Type by Year ............................................................................... 24
Table 23 Persons Seriously Injured by Road User Type by Year .................................................... 25
Table 24 Persons Killed or Seriously Injured by Road User Type by ARIA Category ..................... 25
Table 25 Persons Killed or Seriously Injured by Road User Type by Gender and Age Group – State
........................................................................................................................................... 26
Table 26 Persons Killed or Seriously Injured by Road User Type by Gender and Age Group –
Metropolitan ....................................................................................................................... 27
Table 27 Persons Killed or Seriously Injured by Road User Type by Gender and Age Group –
Regional ............................................................................................................................. 28
Table 28 Persons Killed or Seriously Injured by Road User Type by Gender and Age Group –
Remote .............................................................................................................................. 29
Broad Age Groups
Table 29 Children Killed or Seriously Injured by Road User Type and Age Group .......................... 30
Table 30 Children Killed or Seriously Injured by Speed a Factor and Age Group, Police-Attended
Crashes .............................................................................................................................. 30
Table 31 Child Motor Vehicle Occupants Killed or Seriously Injured by Seat Belt Usage and Age
Group, Police-Attended Crashes ....................................................................................... 31
Table 32 Child Bicylists Killed or Seriously Injured by Helmet Usage and Gender .......................... 31
Table 33 Children Killed or Seriously Injured by Time of Day and Age Group................................. 32
Table 34 Children Killed or Seriously Injured by Day of Week and Age Group ............................... 32
Table 35 Young Adults Killed or Seriously Injured by Road User Type and Age Group .................. 33
Table 36 Young Adults Killed or Seriously Injured by Speed a Factor and Age Group, Police-
Attended Crashes .............................................................................................................. 33

Reported Road Crashes in Western Australia 2011 xii
Table 37 Young Adults Killed or Seriously Injured by Highest Driver/Rider BAC in Crash and Age
Group, Police-Attended Crashes ....................................................................................... 34
Table 38 Young Adult Drivers/Riders Involved in Serious Crashes by Driver/Rider BAC and Age
Group, Police-Attended Crashes ....................................................................................... 35
Table 39 Young Adult Motor Vehicle Occupants Killed or Seriously Injured by Seat Belt Usage and
Age Group, Police-Attended Crashes ............................................................................... 35
Table 40 Young Adult Drivers/Riders Involved in Serious Crashes by Crash Nature and Age Group
........................................................................................................................................... 36
Table 41 Young Adult Drivers/Riders Involved in Serious Crashes by High Priority Crash Type and
Age Group .......................................................................................................................... 36
Table 42 Young Adults Killed or Seriously Injured by Time of Day and Age Group......................... 37
Table 43 Young Adults Killed or Seriously Injured by Day of Week and Age Group ....................... 37
Table 44 Mature Adults Killed or Seriously Injured by Road User Type and Age Group ................. 38
Table 45 Mature Adults Killed or Seriously Injured by Highest Driver/Rider BAC in Crash and Age
Group, Police-Attended Crashes ....................................................................................... 39
Table 46 Mature Adult Drivers/Riders Involved in Serious Crashes by Crash Nature ..................... 40
Table 47 Mature Adult Drivers/Riders Involved in Serious Crashes by Driver/Rider BAC and Age
Group, Police-Attended Crashes ....................................................................................... 41
Table 48 Mature Adult Drivers/Riders Involved in Serious Crashes by High Priority Crash Type and
Age Group .......................................................................................................................... 42
Table 49 Mature Adult Motor Vehicle Occupants Killed or Seriously Injured by Seat Belt Usage and
Age Group, Police-Attended Crashes ............................................................................... 43
Table 50 Senior Adults Killed or Seriously Injured by Road User Type and Age Group .................. 44
Table 51 Senior Adult Drivers/Riders Involved in Serious Crashes by Crash Nature ...................... 45
Table 52 Senior Adult Drivers/Riders Involved in Serious Crashes by High Priority Crash Type and
Age Group .......................................................................................................................... 46
Table 53 Senior Adults Killed or Seriously Injured by Day of Week and Age Group ....................... 46
Table 54 Senior Adults Killed or Seriously Injured by Time of Day and Age Group......................... 47
Safe System
Table 55 Speed a Factor by Crash Severity, Police-Attended Crashes – State .............................. 48
Table 56 Speed a Factor by Crash Severity, Police-Attended Crashes - Metropolitan ................... 48
Table 57 Speed a Factor by Crash Severity, Police-Attended Crashes - Regional ......................... 48
Table 58 Speed a Factor by Crash Severity, Police-Attended Crashes - Remote ........................... 49
Table 59 Fatal Crashes by Speed a Factor by Year, Police-Attended Crashes .............................. 49
Table 60 Serious Crashes by Speed a Factor by ARIA Category, Police-Attended Crashes .......... 50
Table 61 Drivers/Riders Involved in Fatal Crashes by Speed a Factor by Gender and Age Group,
Police-Attended Crashes ................................................................................................... 50
Table 62 Drivers/Riders Involved in Hospitalisation Crashes by Speed a Factor by Gender and Age
Group, Police-Attended Crashes ....................................................................................... 51
Table 63 Persons Killed or Seriously Injured by Speed a Factor by Gender and Age Group, Police-
Attended Crashes .............................................................................................................. 52
Table 64 Fatalities by Road User Type by Speed a Factor, Police-Attended Crashes .................... 52
Table 65 Fatal Crashes by Speed a Factor by Crash Nature, Police-Attended Crashes -
Metropolitan ....................................................................................................................... 53
Table 66 Fatal Crashes by Speed a Factor by Crash Nature, Police-Attended Crashes - Regional 53
Table 67 Fatal Crashes by Speed a Factor by Crash Nature, Police-Attended Crashes - Remote. 54
Table 68 Fatal Crashes by Speed a Factor by Speed Zone, Police-Attended Crashes .................. 54
Table 69 Hospitalisation Crashes by Speed a Factor by Speed Zone, Police-Attended Crashes ... 55
Table 70 Highest Driver/Rider BAC in Crash by Crash Severity, Police-Attended Crashes ............ 56
Table 71 Fatal Crashes by Highest Driver/Rider BAC in Crash by Year, Police-Attended Crashes 57
Table 72 Serious Crashes by Highest Driver/Rider BAC by ARIA Category, Police-Attended
Crashes .............................................................................................................................. 58

Reported Road Crashes in Western Australia 2011 xiii
Table 73 Drivers/Riders Involved in Fatal Crashes by Driver/Rider BAC by Gender and Age Group,
Police-Attended Crashes ................................................................................................... 58
Table 74 Drivers/Riders Involved in Hospitalisation Crashes by Driver/Rider BAC by Gender and
Age Group, Police-Attended Crashes ............................................................................... 59
Table 75 Persons Killed or Seriously Injured by Gender and Age Group by Highest Driver/Rider
BAC in Crash, Police-Attended Crashes ........................................................................... 60
Table 76 BAC of Pedestrian Fatalities by Area of Crash, Police-Attended ...................................... 60
Table 77 Fatalities by Drug Use and Gender ................................................................................... 61
Table 78 Fatalities by Drug Use and Age Group .............................................................................. 62
Table 79 Fatalities by Drug Use and Road User Type ..................................................................... 62
Table 80 Fatalities by Drug Use and Day of Week ........................................................................... 63
Table 81 Motor Vehicle Occupant Fatalities by Seat Belt Usage by Year ....................................... 64
Table 82 Motor Vehicle Occupants Killed or Seriously Injured by Seat Belt Usage by ARIA
Category, Police-Attended Crashes .................................................................................. 65
Table 83 Motor Vehicle Occupant Fatalities by Seat Belt Usage by Gender and Age Group, Police-
Attended Crashes .............................................................................................................. 65
Table 84 Motor Vehicle Occupants Seriously Injured by Seat Belt Usage by Gender and Age
Group, Police-Attended Crashes ....................................................................................... 66
Table 85 Seat Belt Usage by Motor Vehicle Occupant Type and Injury Severity, Police-Attended
Crashes - State .................................................................................................................. 66
Table 86 Seat Belt Usage by Motor Vehicle Occupant Type and Injury Severity, Police-Attended
Crashes - Metropolitan ...................................................................................................... 67
Table 87 Seat Belt Usage by Motor Vehicle Occupant Type and Injury Severity, Police-Attended
Crashes - Regional ............................................................................................................ 67
Table 88 Seat Belt Usage by Motor Vehicle Occupant Type and Injury Severity, Police-Attended
Crashes - Remote .............................................................................................................. 68
Table 89 Helmet Usage by Injury Severity, Police-Attended Crashes - State .................................. 69
Table 90 Helmet Usage by Injury Severity, Police-Attended Crashes - Metropolitan ...................... 69
Table 91 Helmet Usage by Injury Severity, Police-Attended Crashes - Regional ............................ 70
Table 92 Helmet Usage by Injury Severity, Police-Attended Crashes - Remote ............................. 70
Table 93 Motorcyclist Fatalities by Helmet Usage by Age Group, Police-Attended Crashes .......... 70
Table 94 Road Factors by Crash Severity ........................................................................................ 71
Table 95 Fatal Crashes by Crash Nature and Area of Crash ........................................................... 73
Table 96 Fatal Crashes by High Priority Crash Type and Area of Crash ......................................... 73
Table 97 Hospitalisation Crashes by Crash Nature and Area of Crash ........................................... 74
Table 98 Hospitalisation Crashes by High Priority Crash Type and Area of Crash ......................... 74
Table 99 Serious Crashes by Crash Nature by ARIA Category ....................................................... 75
Table 100 Serious Crashes by High Priority Crash Type by ARIA Category ..................................... 75
Table 101 Speed Zone by Crash Severity .......................................................................................... 76
Table 102 Percentage of Vehicles Exceeding the Speed Limit by Speed Zone ................................ 77
Table 103 New Passenger, Sports Utility and Light Commercial Vehicles Purchased by ANCAP
Safety Rating and Vehicle type, WA Fleet ......................................................................... 79
Table 104 Vehicle Type by Crash Severity ......................................................................................... 80
Table 105 Airbag Usage by Injury Severity ........................................................................................ 81
Table 106 Motor Vehicle Occupants Killed or Seriously Injured by Airbag Usage by Area ............... 81
Table 107 Motor Vehicle Occupants Killed or Seriously Injured by Airbag Usage by Occupant Type
........................................................................................................................................... 81
Other Factors
Table 108 Crash Month by Crash Severity ......................................................................................... 82
Table 109 Crash Month by Injury Severity .......................................................................................... 82
Table 110 Day of Week by Crash Severity ......................................................................................... 83

Reported Road Crashes in Western Australia 2011 xiv
Regional Summaries
Table 111 2011 Estimated Resident Population by Region ............................................................... 84
Table 112 Crash Severity by Region .................................................................................................. 85
Table 113 Injury Severity by Region ................................................................................................... 85
Table 114 Drivers/Riders Involved in Serious Crashes by Gender by Region ................................... 86
Table 115 Drivers/Riders Involved in Serious Crashes by Age Group by Region ............................. 86
Table 116 Serious Crashes by Speed a Factor by Region ................................................................ 87
Table 117 Serious Crashes by Highest Driver/Rider BAC in Crash by Region, Police-Attended
Crashes .............................................................................................................................. 87
Table 118 Motor Vehicle Occupants Killed or Seriously Injured by Seat Belt Usage by Region,
Police-Attended Crashes ................................................................................................... 88
Table 119 Serious Crashes by Crash Type by Region ...................................................................... 88
Table 120 Serious Crashes by Other Contributing Factors by Region .............................................. 89
Table 121 Serious Crashes by Month and Day of Week by Region .................................................. 90
Table 122 Age and Gender Standarised Rates of those Killed or Seriously Injured by Region ........ 98
Table 123 Persons Killed or Seriously Injured by Age Group and Gender - Goldfields ................... 101
Table 124 Crash Nature by Crash Severity – Goldfields .................................................................. 102
Table 125 High Priority Crash Type by Crash Severity – Goldfields ................................................ 102
Table 126 Persons Killed or Seriously Injured by Age Group and Gender - Great Southern .......... 104
Table 127 Crash Nature by Crash Severity – Great Southern ......................................................... 105
Table 128 High Priority Crash Type by Crash Severity – Great Southern ....................................... 105
Table 129 Persons Killed or Seriously Injured By Age Group And Gender - Kimberley .................. 107
Table 130 Highest Driver/Rider BAC in Crash by Crash Severity, Police-Attended Crashes –
Kimberley ......................................................................................................................... 108
Table 131 Seat Belt Usage by Injury Severity, Police-Attended Crashes - Kimberley ..................... 108
Table 132 Crash Nature by Crash Severity – Kimberley .................................................................. 108
Table 133 High Priority Crash Type by Crash Severity – Kimberley ................................................ 109
Table 134 Persons Killed or Seriously Injured by Age Group and Gender - Mid West .................... 111
Table 135 Speed a Factor by Crash Severity, Police-Attended Crashes – Mid West...................... 112
Table 136 Highest Driver/Rider BAC in Crash by Crash Severity, Police-Attended Crashes – Mid
West ................................................................................................................................. 112
Table 137 Seat Belt Usage by Injury Severity, Police-Attended Crashes - Mid West ...................... 112
Table 138 Crash Nature by Crash Severity – Mid West ................................................................... 113
Table 139 High Priority Crash Type by Crash Severity – Mid West ................................................. 113
Table 140 Persons Killed or Seriously Injured by Age Group and Gender - Pilbara-Gascoyne ...... 115
Table 141 Speed a Factor by Crash Severity, Police-Attended Crashes – Pilbara-Gascoyne ........ 116
Table 142 Highest Driver/Rider BAC in Crash by Crash Severity, Police-Attended Crashes –
Pilbara-Gascoyne ............................................................................................................ 116
Table 143 Seat Belt Usage by Injury Severity, Police-Attended Crashes - Pilbara-Gascoyne ........ 116
Table 144 Crash Nature by Crash Severity – Pilbara-Gascoyne ..................................................... 117
Table 145 High Priority Crash Type by Crash Severity – Pilbara-Gascoyne ................................... 117
Table 146 Persons Killed or Seriously Injured by Age Group by Gender - South West .................. 119
Table 147 Crash Nature by Crash Severity - South West ................................................................ 120
Table 148 High Priority Crash Type by Crash Severity – South West ............................................. 120
Table 149 Persons Killed or Seriously Injured by Age Group and Gender - Wheatbelt North ......... 122
Table 150 Speed a Factor by Crash Severity, Police-Attended Crashes – Wheatbelt North .......... 123
Table 151 Highest Driver/Rider BAC in Crash by Crash Severity, Police-Attended Crashes –
Wheatbelt North ............................................................................................................... 124
Table 152 Crash Nature by Crash Severity – Wheatbelt North ........................................................ 124
Table 153 High Priority Crash Type by Crash Severity – Wheatbelt North ...................................... 124

Reported Road Crashes in Western Australia 2011 xv
Table 154 Persons Killed or Seriously Injured by Age Group and Gender - Wheatbelt South ........ 126
Table 155 Speed a Factor by Crash Severity, Police-Attended Crashes – Wheatbelt South .......... 127
Table 156 Seat Belt Usage by Injury Severity, Police-Attended Crashes - Wheatbelt South .......... 127
Table 157 Crash Nature by Crash Severity – Wheatbelt South ....................................................... 127
Table 158 High Priority Crash Type by Crash Severity – Wheatbelt South ..................................... 128
Hospital Inpatient Data
Table 159 Hospital Inpatients by Injury Severity by Year ................................................................. 130
Table 160 Hospital Inpatients by Road User by Year ....................................................................... 130
Table 161 Hospital Inpatients by Age Group and Gender ................................................................ 130
Table 162 Hospital Inpatients by Road User Group by Gender ....................................................... 131
Table 163 Hospital Inpatients by Road User Group by Age Group .................................................. 131
Table 164 Hospital Inpatients by Indigenous Status by Year ........................................................... 131
Table 165 Hospital Inpatients by Indigenous Status by Gender ...................................................... 131
Table 166 Hospital Inpatients by Indigenous Status by Age Group ................................................. 132
Table 167 Hospital Inpatients by Indigenous Status by Road User Group ...................................... 133

Reported Road Crashes in Western Australia 2011 xvi
LIST OF FIGURES
Road Crash and Injury Summaries
Figure 1 Fatalities by Year, 1961 to 2011 ........................................................................................ 10
Figure 2 Fatality Rates by Year, 1961 to 2011 ................................................................................ 11
Figure 3 Persons Seriously Injured by Year, 1980 to 2011 ............................................................. 11
Figure 4 Serious Injury Rates by Year, 1980 to 2011 ...................................................................... 12
Figure 5 Reported Crash Rates by Year, 1976 to 2011 .................................................................. 12
Figure 6 Fatality Rates per 100,000 Population - Australian States and Territories ....................... 18
Figure 7 Fatalities by Gender and Age Group ................................................................................. 20
Figure 8 Fatalities by Road User Type ............................................................................................ 23
Figure 9 Persons Seriously Injured by Road User Type .................................................................. 24
Figure 10 Persons Killed or Seriously Injured by Road User Type by Gender .................................. 25
Broad Age Groups
Figure 11 Children Killed or Seriously Injured by Road User Type ................................................... 30
Figure 12 Young Adults Killed or Seriously Injured by Road User Type ........................................... 33
Figure 13 Mature Adults Killed or Seriously Injured by Road User Type .......................................... 38
Figure 14 Senior Adults Killed or Seriously Injured by Road User Group ......................................... 44
Safe System
Figure 15 Fatal Crashes With Speed a Factor by Year, Police-Attended Crashes ........................... 49
Figure 16 Fatal Crashes by Highest Driver/Rider BAC in Crash by Year, Police-Attended Crashes 57
Figure 17 Motor Vehicle Occupant Fatalities Where Seat Belts Were Not Worn by Year ................ 64
Figure 18 Crash Nature by Crash Severity ........................................................................................ 72
Figure 19 New Passenger, Sports Utility and Light Commercial Vehicles Purchased by ANCAP
Safety Rating and Vehicle Type, WA Fleet ....................................................................... 79
Regional Summaries
Figure 20 Fatal Crashes and Fatalities by Year – Goldfields .......................................................... 100
Figure 21 Persons Killed or Seriously Injured by Road User Type – Goldfields ............................. 101
Figure 22 Fatal Crashes and Fatalities by Year - Great Southern .................................................. 103
Figure 23 Persons Killed or Seriously Injured by Road User Type - Great Southern ..................... 104
Figure 24 Fatal Crashes and Fatalities by Year – Kimberley .......................................................... 106
Figure 25 Persons Killed or Seriously Injured by Road User Type – Kimberley ............................. 107
Figure 26 Fatal Crashes and Fatalities by Year - Mid West ............................................................ 110
Figure 27 Persons Killed or Seriously Injured by Road User Type - Mid West ............................... 111
Figure 28 Fatal Crashes and Fatalities by Year - Pilbara-Gascoyne .............................................. 114
Figure 29 Persons Killed or Seriously Injured by Road User Type - Pilbara-Gascoyne ................. 115
Figure 30 Fatal Crashes and Fatalities by Year - South West......................................................... 118
Figure 31 Persons Killed or Seriously Injured by Road User Type - South West............................ 119
Figure 32 Fatal Crashes and Fatalities by Year - Wheatbelt North ................................................. 122
Figure 33 Persons Killed or Seriously Injured by Road User Type - Wheatbelt North .................... 123
Figure 34 Fatal Crashes and Fatalities by Year - Wheatbelt South ................................................ 125
Figure 35 Persons Killed or Seriously Injured by Road User Type - Wheatbelt South ................... 126
Hospital Inpatient Data
Figure 36 Hospital Inpatients by Indigenous Status by Age Group ................................................. 132


Reported Road Crashes in Western Australia 2011 xviii
LIST OF MAPS
Map 1 ARIA Categories by Local Government Area ...................................................................... 6
Map 2 Towards Zero Regions by Local Government Area ............................................................ 7
Map 3 Serious Crash Rate per 100,000 Population by Region .................................................... 92
Map 4 Multi-vehicle Serious Crash Rate per 100,000 Population by Region............................... 93
Map 5 Single-Vehicle Serious Crash Rate per 100,000 Population by Region ........................... 94
Map 6 Speed-Related Serious Crash Rate per 100,000 Population by Region, Police-Attended
Crashes .............................................................................................................................. 95
Map 7 Alcohol-Related Serious Crash Rate per 100,000 Population by Region, Police-Attended
Crashes .............................................................................................................................. 96
Map 8 Seat Belt Not Worn KSI Rate per 100,000 Population by Region, Police-Attended Crashes
........................................................................................................................................... 97
Map 9 Age and Gender Standardised KSI Rate per 100,000 Population by Region ................... 99

Reported Road Crashes in Western Australia 2011 1
1. INTRODUCTION
This report, published annually, is produced by the Office of Road Safety and distributed on behalf
of Road Safety Council of Western Australia member agencies. The report provides road crash
statistics for 2011 in Western Australia. Some historical data and road crash statistics for the rest
of Australia are also included in the report to help readers to interpret the statistics in an
appropriate context.
A crash is classified as a road crash if the following conditions hold: the crash resulted in bodily
injury or property damage, the crash occurred on a road and the road was open to the public at the
time of the crash, the crash involved at least one moving vehicle and the crash was not a result of
a medical condition, a deliberate act (such as a suicide attempt) or a police chase. Crashes that
do not meet these criteria (e.g. off-road crashes) have been excluded from the report.
As a result of applying these criteria, four fatalities from four fatal crashes have been excluded
from this document, so that this document provides information on a total of 175 fatalities from 163
crashes, compared to 179 fatalities from 167 crashes in other sources.
Two of the four excluded crashes did not meet the definition of being on a road that was open to
the public because they involved a bicyclist struck by a car on private property and a motorcyclist
killed in a crash on a bush track. In the third excluded crash, the fatally injured driver was observed
to have collapsed at the wheel prior to the crash; therefore, this crash was classified as being due
to a medical condition. In the fourth crash, the fatality was a motor vehicle passenger killed as a
result of equipment failure during an attempt to free a stuck vehicle. This crash was excluded
because there was no significant contribution from vehicle movement.
The report focuses mainly on crashes that resulted in road users being killed or seriously injured,
where a serious injury is defined as an injury that resulted in the road user being admitted to
hospital for treatment. The term serious crash is used in this report to describe any crash resulting
in at least one fatality or serious injury. For more detailed definitions of these and other terms, see
the Glossary on page 152.
1.1 Data Sources and Acknowledgements
Sections 2 to 6 contain statistics extracted from data on police-reported road crashes. These data
were obtained from the Integrated Road Information System (IRIS) maintained by Main Roads
Western Australia. The dataset used was extracted from the IRIS on 2 May 2013 by Main Roads
and changes made after this date are not reflected in this report.
Crash rates were calculated from the police-reported data using estimated resident population,
vehicle registrations and estimated kilometres travelled data obtained from the Australian Bureau
of Statistics (ABS). The estimated kilometres travelled for 2011 was obtained directly from the
ABS publication. The release date of data sourced from Australian Bureau of Statistics’
publications with multiple releases is provided with each table.
Section 7 presents information on road traffic casualties who were admitted to public and private
hospitals in Western Australia during 2011. Casualties involved in non-traffic crashes were
excluded. The data was extracted on 18 April 2013 by the Hospital Morbidity Data Collections,

Reported Road Crashes in Western Australia 2011 2
Data Integrity, Performance Activity & Quality Division of the Western Australian Department of
Health. Hospital inpatient data is captured using the Hospital Morbidity Data System.
These data offer an alternative data source to the police-reported data and provide additional
details about the road traffic casualties not usually available in police crash reports (i.e. Indigenous
status). However, there are differences in reporting criteria, reporting methods and road user type
definitions between the two datasets. Therefore, the hospital inpatient data cannot be directly
compared to the police-reported data.
The number of Western Australian motor driver licences on record for each year from 1974
onwards is provided in Appendix A on page 137. This information was obtained from the Western
Australian Department of Transport.
Data Analysis Australia would like to thank the following people and organisations for their
assistance in providing data:
Main Roads Western Australia
Thandar Lim.
Health Department of Western Australia
Paul Stevens;
Matthew Cooper; and
Ellen Ceklic.
Department of Transport
Karl Shoebridge.
We would also like to thank Matthew Legge and Kirsty Kirkman from the Office of Road Safety for
their contributions and assistance in the preparation of the report.
1.2 Reading and Interpreting the Report
The statistics in this report should be read in conjunction with the glossary included on page 152,
which provides definitions of terms used in the report. Particular note should be made of changes
to some of the terminology used in this report compared to that of earlier reports in the same
series. These changes have been made to provide consistency with the terminology used
nationally in the area of road crash statistics.
All tables and figures in this report refer to road crashes that occurred in Western Australia in
2011, unless otherwise stated.
Tables and graphs are provided with varying levels of detail, and care must be taken when
interpreting percentage changes where the overall numbers are small. For this reason percentage
changes are not reported for counts less than 10 (indicated by N/R in tables). In some cases
percentages may not add to exactly 100%, due to rounding.
Rates in the tables presented in this report are rounded to one decimal place, although percentage
changes are calculated from the original, unrounded data. Therefore, calculating percentage
changes using the rounded rates may result in values that differ from those shown in the tables.

Reported Road Crashes in Western Australia 2011 3
Many of the tables that provide information by crash or injury severity include a subtotal column or
row for total serious crashes or total persons Killed or Seriously Injured (KSI). Therefore, in these
tables the overall column or row total cannot be calculated by simply summing all columns or rows.
Western Australian legislation requires that traffic crashes are reported to police if:
The incident results in bodily harm to any person;
The total value of property damage exceeds $3,000; or
The owner or representative of any damaged property is not present.
Traffic crashes can be reported in person to a police station, using a paper-based form (the P72
form). In addition to this, in November 2009 an online crash report facility (OCRF) was launched
by Western Australia Police and the Insurance Commission of Western Australia. The introduction
of the OCRF is expected to result in more accurate data, as some validation of the information
entered can be conducted automatically at the time the crash is reported (such as make and
model of vehicle and currency of driver’s licence). It may also result in an apparent increase in the
number of crashes involving property damage only, as the ease of reporting may reduce under-
reporting of such crashes. There are some minor differences in the information collected via the
OCRF and the hard copy P72 form, including the addition of passenger gender. The version of the
P72 form used in 2011 is provided in Appendix C on page 143.
Throughout the report, overall table totals will vary because separate tables are provided for
different levels, including the following:
Number of crashes;
Number of road users;
Number of drivers/riders;
Number of motor vehicle occupants; and
Number of vehicles.
Within these levels, tables and graphs are provided for subsets by crash severity, injury severity,
road user group and police attendance. All captions for tables and figures describe the particular
subset of data included in that table or figure.
1.3 Towards Zero Priority Crash Types
Towards Zero is the State Government’s road safety strategy for 2008 to 2020. Towards Zero is
based on a holistic view of road safety that seeks to manage the interaction between the road
user, the road, travel speed and the vehicle. This ‘safe system’ approach has achieved results not
possible using traditional road safety approaches. The measures outlined in Towards Zero use
the safe system framework and its four cornerstones – Safe Road Use, Safe Roads and
Roadsides, Safe Speeds and Safe Vehicles. Copies of the strategy are available from the Office
of Road Safety website <http://ors.wa.gov.au /Towards-Zero.aspx>.
As part of the development of Towards Zero, problem areas were identified by the Monash
University Accident Research Centre from an analysis of WA’s reported crashes between 2005
and 2007. Problem areas were prioritised on their estimated contribution to the number of deaths
and serious injuries, either because of their frequency or because the associated risks were high.

Reported Road Crashes in Western Australia 2011 4
On this basis, three crash types were identified as having the highest priority and are reported on
in various sections of this text. Two crash types, intersection and run-off-road crashes
1
, were
identified as a priority since each resulted in a third of the people killed and seriously injured
between 2005 and 2007, and the third crash type, head-on crashes, was chosen because the risk
associated with a person being killed or seriously injured is high.
These crash types are not mutually exclusive, hence tables presenting Towards Zero High Priority
Crash Types may count some crashes more than once, and percentages will not sum to 100%.
1.4 Reporting Regions and Accessibility/Remoteness Index of Australia
The accessibility/remoteness index of Australia (ARIA) is a geographical measure of remoteness
developed by the National Centre for Social Applications of Geographical Information Systems
Consultancy Services. Measurements of road distances between populated localities and service
centres were used to determine the ARIA score for a given location. ARIA scores were derived for
over 12,000 populated localities within Australia. These ARIA scores have then been interpolated
to provide an ARIA score for the whole of Australia. Localities that are more remote have less
access to service centres; those that are less remote have greater access to service centres. The
standard ranges that are used for ARIA scores are provided in Table 1. These ranges have been
used in all ARIA tables throughout the report.
Table 1 ARIA Scores and Categories
ARIA Score
ARIA Category
0 to ≤0.2
Highly Accessible
>0.2 to ≤2.4
Accessible
>2.4 to ≤5.92
Moderately Accessible
>5.92 to ≤10.53
Remote
>10.53
Very Remote
Source: National Centre for Social Applications of Geographical Information Systems Consultancy Services.
In 2011, 77.3% of Western Australia’s population were located in ‘Highly Accessible’ areas and
8.1% in ‘Accessible’ areas while only 2.3% were located in ‘Very Remote’ areas.
Table 2 2011 Western Australian Population by ARIA Category
2011 Population
ARIA Category
n
%
Highly Accessible
1,818,134
77.3%
Accessible
190,539
8.1%
Moderately Accessible
182,815
7.8%
Remote
107,200
4.6%
Very Remote
53,527
2.3%
Total
2,352,215
100.0%
Source: Australian Bureau of Statistics, Customised report, 2013 for 2011 figures.
1
‘Run Off Road’ crashes are defined as crashes in which a vehicle involved exits the carriageway, through a loss
of control, swerving to avoid a collision or for other reasons. After the vehicle has left the carriageway it may also
collide with a person, object, or vehicle, or it may roll over, and/or a person may fall or be ejected from the vehicle.

Reported Road Crashes in Western Australia 2011 5
In line with the focus of the Towards Zero road safety strategy, some results in this report are
presented comparing the Metropolitan region with Regional and Remote areas. The Metropolitan
area is defined as the Perth Statistical Division and the remainder of the State is then split into
Regional and Remote areas based on ARIA categories. Regional areas have ARIA categories of
Accessible or Moderately Accessible, and Remote areas have ARIA categories of Remote or Very
Remote. Note that the Towards Zero Regions were defined using 2006 ARIA categories where as
elsewhere in the book reports on 2011 ARIA categories. Map 1 shows the ARIA Categories, and
Map 2 shows the Towards Zero Regions by Local Government Areas (LGAs) in Western Australia.

Reported Road Crashes in Western Australia 2011 6
Map 1 ARIA Categories by Local Government Area

Reported Road Crashes in Western Australia 2011 7
Map 2 Towards Zero Regions by Local Government Area

Reported Road Crashes in Western Australia 2011 8
1.5 Selected Western Australian Statistical Indicators
This section contains key statistics to provide an overview of the Western Australian economy and
population for 2006 to 2011. This information may provide additional context to the road crash
statistics.
Table 3 Statistical Indicators of the Western Australian Economy by Year
Statistical Indicator
Year
2006
2007
2008
2009
2010
2011
2011
Change
from 2010
n
n
n
n
n
n
%
Gross State Product (June)
1
119,009
138,542
154,840
176,143
181,566
221,574
22.0
Consumer Price Index (June)
2
Index Numbers
85.4
88
92
93.3
96.5
99.4
3.0
Annual Percentage
Change
4.8
3
4.5
1.4
3.4
3
-11.8
Labour Force (November)
3
Persons Employed
1,082,700
1,124,500
1,173,100
1,185,800
1,223,800
1,240,000
1.3
Persons Unemployed
36,100
37,500
39,600
64,200
56,400
55,500
-1.6
Total Labour Force
1,118,800
1,162,000
1,212,700
1,250,000
1,280,200
1,295,500
1.2
Average Weekly Earnings (May)
4
Male
$1,039.40
$1,125.80
$1,230.10
$1,306.00
$1,352.70
$1,501.10
11.0
Female
$571.50
$632.00
$660.20
$706.40
$740.40
$780.40
5.4
Persons
$817.70
893.00
$959.30
$1,008.70
$1,060.50
$1,146.00
8.1
New Motor Vehicle Sales
5
Passenger Vehicles
63,581
67,771
62,358
52,323
62,303
54,489
-12.5
Sports Utility Vehicle
22,131
24,831
24,556
22,494
28,499
28,290
-0.7
Other Vehicles
25,284
28,745
29,820
25,513
27,005
27,014
0.0
Total Vehicle Sales
110,993
121,346
116,736
100,331
117,807
109,793
-6.8
1. Source: Australian Bureau of Statistics, Catalogue No. 5220.0, in $million (2011/2012 release). The estimates of Gross
State Product are given in current price and chain volume terms.
2. Source: Australian Bureau of Statistics, Catalogue No. 6401.0 (September 2012 release). The Consumer Price Index
is for all groups and is for the Perth Metropolitan area.
3. Source: Australian Bureau of Statistics, Catalogue No. 1306.5 (2008 – 2012 releases). The Labour Force figures are
recorded for December.
4. Source: Australian Bureau of Statistics, Catalogue No. 6302.0 Seasonally adjusted total earnings (May 2012 release).
5. Source: Australian Bureau of Statistics, Catalogue No. 9314.0 (January 2013 release). The New Motor Vehicle Sales
figures are seasonally adjusted.

Reported Road Crashes in Western Australia 2011 9
Table 4 Western Australian Population by Gender and Age Group by Year
Gender/Age Group
Year
2006
2007
2008
2009
2010
2011
2011
Change
from 2010
n
n
n
n
n
n
%
Male
0 - 16
242,085
245,139
249,530
254,776
257,784
261,305
1.4
17 - 24
122,923
127,148
132,201
137,418
138,839
139,707
0.6
25 - 59
514,096
525,783
542,222
559,292
572,285
587,384
2.6
60 and over
159,941
167,519
174,317
181,014
187,589
194,940
3.9
Total Males
1,039,045
1,065,589
1,098,270
1,132,500
1,156,497
1,183,336
2.3
Female
0 - 16
226,672
231,032
236,379
242,239
245,992
250,629
1.9
17 - 24
153,249
157,754
163,026
167,428
169,297
171,835
1.5
25 - 59
502,060
513,417
528,136
544,391
556,752
570,831
2.5
60 and over
177,224
185,283
192,366
200,066
207,921
216,279
4
Total Females
1,059,205
1,087,486
1,119,907
1,154,124
1,179,962
1,209,574
2.5
Persons
0 - 16
468,757
476,171
485,909
497,015
503,776
511,934
1.6
17 - 24
237,303
245,668
255,627
264,881
267,806
270,847
1.1
25 - 59
1,016,156
1,039,200
1,070,358
1,103,683
1,129,037
1,158,215
2.6
60 and over
337,165
352,802
366,683
381,080
395,510
411,219
4
Total Population
1
2,059,381
2,113,841
2,178,577
2,246,659
2,296,129
2,352,215
2.4
1. Source: Australian Bureau of Statistics, Catalogue No. 3101.0 (September 2012 release).

Reported Road Crashes in Western Australia 2011 10
2. ROAD CRASH AND INJURY SUMMARIES
2.1 Historical Information
This section presents trends in road traffic crashes, casualties and corresponding rates. It also
includes the distribution of road crashes and casualties in 2011 by geographical areas.
Figure 1 Fatalities by Year, 1961 to 2011

Reported Road Crashes in Western Australia 2011 11
Figure 2 Fatality Rates by Year, 1961 to 2011
Figure 3 Persons Seriously Injured by Year, 1980 to 2011

Reported Road Crashes in Western Australia 2011 12
Figure 4 Serious Injury Rates by Year, 1980 to 2011
Figure 5 Reported Crash Rates by Year, 1976 to 2011

Reported Road Crashes in Western Australia 2011 13
This document provides information on a total of 175 fatalities from 163 fatal crashes in 2011. This
is four fewer fatalities and four fewer fatal crashes reported by other sources as four fatal crashes
did not meet the inclusion criteria specified in the Introduction of this report (page 1).
Two of the four excluded crashes did not meet the definition of being on a road that was open to
the public because they involved a bicyclist struck by a car on private property and a motorcyclist
killed in a crash on a bush track. In the third excluded crash, the fatally injured driver was observed
to have collapsed at the wheel prior to the crash; therefore, this crash was classified as being due
to a medical condition. In the fourth crash, the fatality was a motor vehicle passenger killed as a
result of equipment failure during an attempt to free a stuck vehicle. This crash was excluded
because there was no significant contribution from vehicle movement.
Table 5 Crash Severity by Year
Year
2006
2007
2008
2009
2010
2011
2011 Change
from 2010
Crash Severity
n
n
n
n
n
n
%
Fatal
182
213
185
176
174
163
-6.3
Hospitalisation
2,122
2,188
2,279
2,007
2,031
2,006
-1.2
Total Serious
2,304
2,401
2,464
2,183
2,205
2,169
-1.6
Other
37,230
39,229
36,833
35,043
37,410
37,288
-0.3
Total Crashes
39,534
41,630
39,297
37,226
39,615
39,457
-0.4
Table 6 Injury Severity by Year
Year
2006
2007
2008
2009
2010
2011
2011 Change
from 2010
Injury Severity
n
n
n
n
n
n
%
Fatal
201
235
205
191
191
175
-8.4
Serious
2,764
2,784
2,890
2,568
2,531
2,469
-2.4
Total Persons KSI
2,965
3,019
3,095
2,759
2,722
2,644
-2.9
Minor
12,847
13,088
12,485
11,589
10,080
9,841
-2.4
None/unknown
94,882
99,804
93,242
87,972
97,491
92,978
-4.6
Total Persons
110,694
115,911
108,822
102,320
110,293
105,463
-4.4

Reported Road Crashes in Western Australia 2011 14
Table 7 Injury Rates per 100,000 Population by Severity and Year
Year
2006
2007
2008
2009
2010
2011
2011 Change
from 2010
Injury Severity
n
n
n
n
n
n
%
Fatal
9.8
11.1
9.4
8.5
8.3
7.4
-10.6
Serious
134.2
131.7
132.7
114.3
110.2
105.0
-4.8
Total Persons KSI
144.0
142.8
142.1
122.8
118.5
112.4
-5.2
Minor
623.8
619.2
573.1
515.8
439.0
418.4
-4.7
None/unknown
4,607.3
4,721.5
4,279.9
3,915.7
4,245.9
3,952.8
-6.9
Total
5,375.1
5,483.4
4,995.1
4,554.3
4,803.4
4,483.6
-6.7
Estimated
Population
1
2,059,381
2,113,841
2,178,577
2,246,659
2,296,129
2,352,215
-
1. Source: Australian Bureau of Statistics, Catalogue No. 3101.0 (September 2012 release).
Table 8 Injury Rates per 10,000 Registered Vehicles by Severity and Year
Year
2006
2007
2008
2009
2010
2011
2011 Change
from 2010
Injury Severity
n
n
n
n
n
n
%
Fatal
1.3
1.4
1.2
1.0
1.0
0.9
-10.4
Serious
17.3
16.6
16.5
14.0
13.5
12.9
-4.6
Total Persons KSI
18.5
18.0
17.7
15.1
14.6
13.8
-5.0
Minor
80.3
78.1
71.5
63.4
53.9
51.4
-4.5
None/unknown
592.8
595.3
533.9
481.2
521.3
486.1
-6.8
Total
691.6
691.4
623.1
559.6
589.8
551.4
-6.5
Registered
Vehicles
1
1,600,566
1,676,495
1,746,579
1,828,346
1,870,068
1,912,739
-
1. Source: Australian Bureau of Statistics Motor Vehicle Census Catalogue No 9309.0 (2009 – 2012 releases).
Table 9 Injury Rates per 100 Million Kilometres Travelled by Severity and Year
Year
2006
2007
2008
2009
2010
2011
2011 Change
from 2010
Injury Severity
n
n
n
n
n
n
%
Fatal
0.9
1.0
0.8
0.7
0.7
0.7
-9.9
Serious
12.2
11.5
11.4
9.9
9.6
9.2
-4.1
Total Persons KSI
13.1
12.4
12.2
10.7
10.4
9.9
-4.8
Minor
56.8
53.9
49.3
44.7
38.3
36.8
-4.0
None/unknown
419.5
410.9
368.2
339.6
370.9
347.7
-6.3
Total
489.4
477.2
429.7
395.0
419.6
394.4
-6.0
Vehicle Kilometres
Travelled (millions)
1
22,616
24,289
25,325
25,902
26,285
26,740
-
1. Source: Australian Bureau of Statistics Survey of Motor Vehicle Use, Catalogue No 9208.0 (June 2012 release for
2004-2007 figures). Due to direct estimates being unavailable for 2008 and 2009, figures for those years were obtained
by interpolating between the published average kilometres travelled per vehicle values for 2007 and 2010 and then
multiplying by the number of registered vehicles in the respective years.

Reported Road Crashes in Western Australia 2011 15
Table 10 Crash Severity by Towards Zero Region
Crash Severity
Fatal
Hospitalisation
Total Serious
Other
Total
Towards Zero Region
n
Col %
n
Col %
n
Col %
n
Col %
n
Col %
Metropolitan
68
41.7
1,399
69.7
1,467
67.6
31,862
85.4
33,329
84.5
Regional
57
35.0
387
19.3
444
20.5
3,854
10.3
4,298
10.9
Remote
38
23.3
220
11.0
258
11.9
1,572
4.2
1,830
4.6
Total Crashes
163
100.0
2,006
100.0
2,169
100.0
37,288
100.0
39,457
100.0
Table 11 Injury Severity by Towards Zero Region
Injury Severity
Fatal
Serious
Total Persons
KSI
Minor
None/Unknown
Total
Towards Zero
Region
n
Col %
n
Col %
n
Col %
n
Col %
n
Col %
n
Col %
Metropolitan
72
41.1
1,652
66.9
1,724
65.2
8,257
83.9
80,062
86.1
90,043
85.4
Regional
60
34.3
505
20.5
565
21.4
1,058
10.8
9,268
10.0
10,891
10.3
Remote
43
24.6
312
12.6
355
13.4
526
5.3
3,648
3.9
4,529
4.3
Total Persons
175
100.0
2,469
100.0
2,644
100.0
9,841
100.0
92,978
100.0
105,463
100.0
Table 12 Crash Severity by ARIA Category
Crash Severity
Fatal
Hospitalisation
Total Serious
Other
Total
ARIA Category
n
Col %
n
Col %
n
Col %
n
Col %
n
Col %
Highly Accessible
70
42.9
1,455
72.5
1,525
70.3
32,594
87.4
34,119
86.5
Accessible
33
20.2
204
10.2
237
10.9
2,077
5.6
2,314
5.9
Moderately Accessible
28
17.2
166
8.3
194
8.9
1,491
4.0
1,685
4.3
Remote
21
12.9
115
5.7
136
6.3
773
2.1
909
2.3
Very Remote
11
6.7
66
3.3
77
3.6
353
0.9
430
1.1
Total Crashes
163
100.0
2,006
100.0
2,169
100.0
37,288
100.0
39,457
100.0
Table 13 Injury Severity by ARIA Category
Injury Severity
Fatal
Serious
Total Persons
KSI
Minor
None/Unknown
Total
ARIA Category
n
Col %
n
Col %
n
Col %
n
Col %
n
Col %
n
Col %
Highly Accessible
74
42.3
1,726
69.9
1,800
68.1
8,453
85.9
81,930
88.1
92,183
87.4
Accessible
35
20.0
268
10.9
303
11.5
613
6.2
4,967
5.3
5,883
5.6
Moderately Accessible
29
16.6
209
8.5
238
9.0
371
3.8
3,506
3.8
4,115
3.9
Remote
23
13.1
166
6.7
189
7.1
259
2.6
1,807
1.9
2,255
2.1
Very Remote
14
8.0
100
4.1
114
4.3
145
1.5
768
0.8
1,027
1.0
Total Persons
175
100.0
2,469
100.0
2,644
100.0
9,841
100.0
92,978
100.0
105,463
100.0

Reported Road Crashes in Western Australia 2011 16
2.2 Cost of Crashes
Estimates of the financial cost of road traffic injuries and crashes in Western Australia have been
calculated using two different methods, and both are shown for comparison in Table 14.
The human capital approach evaluates the benefit of avoiding death and injury as the present
value of income flow the economy could lose if a crash occurs. It is an “after the fact” valuation.
That is, it focuses on the value lost to the economy after the event has occurred. The cost
calculation is based on various identifiable costs associated with the crash and its aftermath.
These include, but are not restricted to, the cost of ambulance, hospital inpatient and other medical
costs, long term care, funeral costs, loss of income by the casualty and the repair or replacement
costs to the vehicles and property involved in the crash. The value of the injury is then measured
as the sum of the discounted present value of these component costs.
The willingness-to-pay approach is based on subjective preferences and is usually defined as the
amount of money that individuals are willing to pay to reduce their risk of premature death or injury,
while performing certain risky activities such as using the road network. When people spend extra
time or money to avoid potentially fatal risks, or accept money to take such risks, they are making
a trade off between their wealth and the probability of death or injury. In this sense, road safety is
not valued on the basis of the cost of crashes or the loss of income by crash victims, but it is the
value placed on a reduction in risk of death or injury due to a crash. So instead of deriving an
“after the fact” value of the costs associated with a road crash, the willingness-to-pay approach
captures the value individuals place on avoiding death and injury.
The human capital approach valuations were obtained from the Austroads publication “Guide to
Project Evaluation Part 4: Project Evaluation Data”, which provides estimates of average crash
costs ($/crash) as at 30 June 2007. These valuations have been adjusted for inflation using
Western Australia-specific price indices derived from the CPI indices for June and seasonally
adjusted average weekly earnings for May published by the Australian Bureau of Statistics. The
willingness-to-pay valuations were obtained from the New South Wales Road Traffic Authority
publication “Economic Valuation of Safety Benefits: Serious injuries - Final Report”. These are the
only Australian willingness-to-pay values currently available. These figures have also been
adjusted for inflation using the Perth specific CPI – All Groups index for June, published by the
Australian Bureau of Statistics.
The most striking difference between the two approaches is the much higher value associated with
fatal crashes using the willingness-to-pay approach, compared to the human capital valuation.
This is an indication of the value that the community places on avoiding road deaths. The other
difference is that the willingness-to-pay valuations for hospitalisation crashes are lower than the
human capital approach equivalents. For example, using the human capital approach to estimate
the total cost of crashes in 2011 yields an estimate of $2.1 billion, 21% of which was due to fatal
crashes and 57% from hospitalisation crashes. In contrast, the willingness-to-pay approach gives
an estimate of $2.7 billion, of which 45% was due to fatal crashes and 25% from hospitalisation
crashes.

Reported Road Crashes in Western Australia 2011 17
Table 14 Estimated Cost of Crashes to the Western Australian Community
Human Capital Approach
Willingness-to-Pay Approach
Crashes
Cost Per Crash
1
Total Cost
Cost Per Crash
2
Total Cost
Crash Severity
n
$
$
$
$
Metropolitan
Fatal
68
2,528,931
172M
6,903,789
469.5M
Hospitalisation
1,399
581,891
814.1M
293,000
409.9M
Medical Attention
4,847
33,505
162.4M
75,610
366.5M
Other
3
27,015
8,620
232.9M
11,206
302.7M
Total Metropolitan Crashes
33,329
-
1,381.3M
-
1,548.6M
Non-Metropolitan
Fatal
95
2,722,650
258.7M
7,894,303
750M
Hospitalisation
607
622,595
377.9M
463,621
281.4M
Medical Attention
771
35,012
27M
103,482
79.8M
Other
3
4,655
8,620
40.1M
11,206
52.2M
Total Non-Metro Crashes
6,128
-
703.7M
-
1,163.3M
Total Western Australian Crashes
39,457
-
2,085M
-
2,711.9M
1. Human capital costs per crash were provided by the Office of Road Safety and are based on:
Austroads’ “Guide to Project Evaluation Part 4: Project Evaluation Data” (2008).
Average weekly earnings for Western Australia for the May quarter Australia Bureau of Statistics Catalogue No.
6302 (May 2012 release).
The Consumer Price Index, Australia Bureau of Statistics Catalogue No. 6401.0 (September 2012 release).
2. Willingness-to-pay costs per crash were provided by the Office of Road Safety and are derived using:
Costs per injury from NSW RTA “Economic Valuation of Safety Benefits: Serious injuries - Final Report”.
Consumer price index (CPI) categories of CPI - All Groups, CPI - Motor Vehicle Repair and Servicing and CPI –
Health, for the June quarter, Australia Bureau of Statistics Catalogue No. 6401.
3. Other refers to crashes that resulted in property damage only.

Reported Road Crashes in Western Australia 2011 18
2.3 Comparison with Other States and Territories
Figure 6 Fatality Rates per 100,000 Population - Australian States and Territories
Note: The National target for 2020 is a rate of 4.0 fatalities per 100,000 population.
Table 15 Fatality Rates per 100,000 Population by Year - Australian States and Territories
Year
2006
2007
2008
2009
2010
2011
State/Territory
n
Rate
n
Rate
n
Rate
n
Rate
n
Rate
n
Rate
WA
201
9.8
235
11.1
205
9.4
191
8.5
191
8.3
175
7.4
NSW
496
7.3
435
6.3
374
5.4
453
6.4
405
5.7
364
5
VIC
337
6.6
332
6.4
303
5.7
290
5.4
288
5.3
287
5.2
QLD
335
8.2
360
8.6
328
7.7
331
7.6
249
5.6
269
6
SA
117
7.5
124
7.8
99
6.2
119
7.4
118
7.2
103
6.3
TAS
55
11.2
45
9.1
39
7.8
63
12.5
31
6.1
24
4.7
NT
45
21.4
58
27
75
33.9
30
13.2
49
21.3
44
19
ACT
13
3.9
14
4.1
14
4
12
3.4
19
5.3
6
1.6
AUST
1,599
7.7
1,603
7.6
1,437
6.7
1,489
6.8
1,350
6.1
1,272
5.7
Source: Number of fatalities for Western Australia from IRIS, number of fatalities for all other states and territories
extracted (18/06/2013) from the Australian Transport Safety Bureau "Fatal Road Crash Database".
Rates calculated using population data from Australian Bureau of Statistics Catalogue No. 3101.0 (September 2012
release).
8.4
5.6
5.2
5.5
7.2
6.1
21.3
5.3
6.1
0.0
5.0
10.0
15.0
20.0
25.0
WA NSW VIC QLD SA TAS NT ACT AUST
Fatality Rates per 100,000 Population
State/Territory
Rate 2010
National Target
2010

Reported Road Crashes in Western Australia 2011 19
2.4 Gender and Age
Table 16 Fatalities by Gender and Age Group by Year
Year
2006
2007
2008
2009
2010
2011
2011 Change
from 2010
1
Gender/Age Group
n
n
n
n
n
n
%
Male
0 - 11
3
4
8
5
5
6
N/R
12 - 16
1
7
4
5
2
3
N/R
17 - 24
55
34
41
27
32
31
-3.1
25 - 39
38
64
42
47
43
33
-23.3
40 - 59
28
48
34
39
35
32
-8.6
60 and over
27
19
20
18
14
24
71.4
Total Male
152
176
149
141
131
129
-1.5
Female
0 - 11
0
2
1
3
2
1
N/R
12 - 16
6
3
4
2
2
1
N/R
17 - 24
11
13
11
9
12
13
8.3
25 - 39
7
18
16
13
12
9
-25.0
40 - 59
17
11
13
9
15
7
-53.3
60 and over
8
11
7
11
15
15
0.0
Total Female
49
58
52
47
58
46
-20.7
Total Unknown Gender
0
1
4
3
2
0
N/R
All Persons
0 – 11
3
6
9
9
9
7
N/R
12 - 16
7
10
8
7
4
4
N/R
17 - 24
66
48
53
36
44
44
0.0
25 - 39
45
82
59
60
55
42
-23.6
40 - 59
45
59
47
50
50
39
-22.0
60 and over
35
30
28
29
29
39
34.5
Unknown age
0
0
1
0
0
0
N/R
Total Fatalities
201
235
205
191
191
175
-8.4
1. 2011 change from 2010 not reported for persons with unknown age or gender, or for age groups with fewer than ten
fatalities.

Reported Road Crashes in Western Australia 2011 20
Figure 7 Fatalities by Gender and Age Group
Table 17 Fatalities by Age Group and Gender
Gender
Percentage of
Fatalities
Percentage of
Population
Age-Specific
Fatality Rate
2
Male
Female
Total
1
Age Group
n
n
n
%
%
Rate
0 - 5
2
0
2
1.1
7.9
1.1
6 - 11
4
1
5
2.9
7.4
2.9
12 - 16
3
1
4
2.3
6.4
2.7
17 - 20
18
4
22
12.6
5.4
17.3
21 - 24
13
9
22
12.6
6.1
15.3
25 - 29
12
3
15
8.6
7.9
8.1
30 - 34
12
4
16
9.1
7.1
9.6
35 - 39
9
2
11
6.3
7.2
6.5
40 - 44
12
2
14
8.0
7.4
8.1
45 - 49
6
3
9
5.1
7.1
5.4
50 - 54
6
1
7
4.0
6.7
4.4
55 - 59
8
1
9
5.1
6.0
6.4
60 - 64
6
2
8
4.6
5.4
6.3
65 - 69
3
1
4
2.3
3.9
4.4
70 - 74
4
6
10
5.7
2.9
14.6
75 - 79
2
1
3
1.7
2.2
5.8
80 - 84
7
2
9
5.1
1.7
22.9
85 and over
2
3
5
2.9
1.5
14.5
Total Fatalities
129
46
175
100.0
100.0
7.4
Source: Population data from Australian Bureau of Statistics, Customised report, 2013.
1. Includes unknown gender.
2. Age-specific fatality rates per 100,000 population.

Reported Road Crashes in Western Australia 2011 21
Table 18 Fatalities by Age Group Subtotals and Gender
Gender
Percentage of
Fatalities
Percentage of
Population
Age-Specific
Fatality Rate
2
Male
Female
Total
1
Age Group
n
n
n
%
%
Rate
0 - 11
6
1
7
4.0
15.3
1.9
12 - 16
3
1
4
2.3
6.4
2.7
17 - 24
31
13
44
25.1
11.5
16.2
25 - 39
33
9
42
24.0
22.1
8.1
40 - 59
32
7
39
22.3
27.1
6.1
60 and over
24
15
39
22.3
17.5
9.5
Total Fatalities
129
46
175
100.0
100.0
7.4
Source: Population data from Australian Bureau of Statistics, Customised report, 2013.
1. Includes unknown gender.
2. Age-specific fatality rates per 100,000 population.
Table 19 Persons Seriously Injured by Gender and Age Group by Year
Year
2006
2007
2008
2009
2010
2011
2011 Change
from 2010
1
Gender/Age Group
n
n
n
n
n
n
%
Male
0 – 11
53
21
19
21
24
25
4.2
12 – 16
70
44
47
45
42
54
28.6
17 – 24
401
404
349
278
290
305
5.2
25 – 39
470
403
421
373
371
393
5.9
40 – 59
351
321
358
316
338
375
10.9
60 and over
145
158
143
127
148
152
2.7
Unknown age
84
44
35
36
24
41
N/R
Total Male
1,574
1,395
1,372
1,196
1,237
1,345
8.7
Female
0 – 11
38
20
11
14
10
26
160.0
12 – 16
43
26
19
15
22
34
54.5
17 – 24
305
233
220
198
180
196
8.9
25 – 39
249
248
230
186
207
212
2.4
40 – 59
232
206
217
203
220
214
-2.7
60 and over
130
110
101
113
118
118
0.0
Unknown age
81
34
21
21
25
47
N/R
Total Female
1,078
877
819
750
782
847
8.3
Total Unknown Gender
112
512
699
622
512
277
N/R
All Persons
0 – 11
106
83
97
95
84
84
0.0
12 – 16
120
126
131
111
105
107
1.9
17 – 24
723
757
741
648
583
588
0.9
25 – 39
734
737
752
663
677
659
-2.7
40 – 59
594
589
674
603
638
618
-3.1
60 and over
282
319
336
308
317
286
-9.8
Unknown age
205
173
159
140
127
127
N/R
Total Persons
Seriously Injured
2,764
2,784
2,890
2,568
2,531
2,469
-2.4
1. 2011 change from 2010 not reported for persons with unknown age or gender, or for age groups with fewer than ten
persons seriously injured.

Reported Road Crashes in Western Australia 2011 22
Table 20 Persons Seriously Injured by Age Group and Gender
Gender
Percentage of
Seriously
Injured
Percentage of
Population
Age-Specific
Serious Injury
Rate
2
Male
Female
Total
1
Age Group
n
n
n
%
%
Rate
0 - 5
9
15
36
1.5
7.9
19.3
6 - 11
16
11
48
1.9
7.4
27.6
12 - 16
54
34
107
4.3
6.4
70.9
17 - 20
152
110
310
12.6
5.4
243.4
21 - 24
153
86
278
11.3
6.1
193.7
25 - 29
158
93
284
11.5
7.9
153.7
30 - 34
136
60
208
8.4
7.1
125.2
35 - 39
99
59
167
6.8
7.2
98.9
40 - 44
95
63
165
6.7
7.4
95.4
45 - 49
123
62
192
7.8
7.1
114.7
50 - 54
92
44
148
6.0
6.7
93.7
55 - 59
65
45
113
4.6
6.0
80.7
60 - 64
52
35
91
3.7
5.4
72.2
65 - 69
37
20
59
2.4
3.9
64.6
70 - 74
20
20
43
1.7
2.9
62.9
75 - 79
10
17
30
1.2
2.2
58.1
80 - 84
21
16
40
1.6
1.7
101.7
85 and over
12
10
23
0.9
1.5
66.5
Unknown age
41
47
127
5.1
N/A
N/A
Total Persons
Seriously Injured
1,345
847
2,469
100.0
100.0
105.0
Source: Population data from Australian Bureau of Statistics, Customised report, 2013.
1. Includes persons of unknown gender.
2. Age-specific serious injury rates per 100,000 population.
Table 21 Persons Seriously Injured by Age Group Subtotals and Gender
Gender
Percentage of
Seriously
Injured
Percentage of
Population
Age-Specific
Serious Injury
Rate
2
Male
Female
Total
1
Age Group
n
n
n
%
%
Rate
0 – 11
25
26
84
3.4
15.3
23.3
12 – 16
54
34
107
4.3
6.4
70.9
17 – 24
305
196
588
23.8
11.5
217.1
25 – 39
393
212
659
26.7
22.1
126.8
40 – 59
375
214
618
25.0
27.1
96.8
60 and over
152
118
286
11.6
17.5
69.5
Unknown age
41
47
127
5.1
N/A
N/A
Total Persons
Seriously Injured
1,345
847
2,469
100.0
100.0
105.0
Source: Population data from Australian Bureau of Statistics, Customised report, 2013.
1. Includes unknown gender.
2. Age-specific serious injury rates per 100,000 population.

Reported Road Crashes in Western Australia 2011 23
2.5 Road User Types
Summaries of the number of persons killed or seriously injured are provided by road user type.
When interpreting tables showing road user type by gender, it should be noted that gender was not
recorded for a large percentage of motor vehicle passengers.
Figure 8 Fatalities by Road User Type

Reported Road Crashes in Western Australia 2011 24
Figure 9 Persons Seriously Injured by Road User Type
Table 22 Fatalities by Road User Type by Year
Year
2006
2007
2008
2009
2010
2011
2011 Change
from 2010
Road User
n
n
n
n
n
n
%
Driver
95
113
100
90
96
86
-10.4
Passenger
50
64
45
43
40
37
-7.5
Motorcyclist
31
34
37
33
35
25
-28.6
Bicyclist
3
4
3
0
4
3
N/R
Pedestrian
22
20
20
25
16
24
50.0
Other/ Unknown
0
0
0
0
0
0
N/A
Total Fatalities
201
235
205
191
191
175
-8.4
1. 2011 change from 2010 not reported for road user types with fewer than ten fatalities.

Reported Road Crashes in Western Australia 2011 25
Table 23 Persons Seriously Injured by Road User Type by Year
Year
2006
2007
2008
2009
2010
2011
2011 Change
from 2010
Road User
n
n
n
n
n
n
%
Driver
1,436
1,498
1,500
1,224
1,273
1,229
-3.5
Passenger
719
691
705
661
577
549
-4.9
Motorcyclist
346
347
389
360
386
400
3.6
Bicyclist
83
88
116
112
107
102
-4.7
Pedestrian
180
160
180
211
188
189
0.5
Other/ Unknown
0
0
0
0
0
0
N/A
Total Persons
Seriously Injured
2,764
2,784
2,890
2,568
2,531
2,469
-2.4
Figure 10 Persons Killed or Seriously Injured by Road User Type by Gender
Table 24 Persons Killed or Seriously Injured by Road User Type by ARIA Category
Road User
ARIA Category
Highly
Accessible
Accessible
Moderately
Accessible
Remote
Very Remote
Total
n
Col %
n
Col %
n
Col %
n
Col %
n
Col %
n
Col %
Driver
887
49.3
158
52.1
124
52.1
92
48.7
54
47.4
1,315
49.7
Passenger
341
18.9
71
23.4
58
24.4
64
33.9
52
45.6
586
22.2
Motorcyclist
307
17.1
52
17.2
37
15.5
24
12.7
5
4.4
425
16.1
Bicyclist
97
5.4
3
1.0
3
1.3
2
1.1
0
0.0
105
4.0
Pedestrian
168
9.3
19
6.3
16
6.7
7
3.7
3
2.6
213
8.1
Other/ Unknown
0
0.0
0
0.0
0
0.0
0
0.0
0
0.0
0
0.0
Total Persons KSI
1,800
100.0
303
100.0
238
100.0
189
100.0
114
100.0
2,644
100.0

Reported Road Crashes in Western Australia 2011 26
Table 25 Persons Killed or Seriously Injured by Road User Type by Gender and Age Group – State
Road User Type
Driver
Passenger
1
Motorcyclist
Bicycle Rider
Pedestrian
Total
Gender/Age Group
n
Row %
n
Row %
n
Row %
n
Row %
n
Row %
n
Row %
Male
0 – 5
0
0.0
6
54.5
0
0.0
2
18.2
3
27.3
11
100.0
6 – 11
0
0.0
10
50.0
0
0.0
1
5.0
9
45.0
20
100.0
12 - 16
3
5.3
16
28.1
15
26.3
4
7.0
19
33.3
57
100.0
17 - 20
100
58.8
18
10.6
33
19.4
5
2.9
14
8.2
170
100.0
21 - 24
89
53.6
24
14.5
37
22.3
3
1.8
13
7.8
166
100.0
25 - 29
95
55.9
17
10.0
39
22.9
6
3.5
13
7.6
170
100.0
30 - 39
136
53.1
13
5.1
78
30.5
15
5.9
14
5.5
256
100.0
40 - 49
106
44.9
15
6.4
82
34.7
17
7.2
16
6.8
236
100.0
50 - 59
92
53.8
6
3.5
55
32.2
11
6.4
7
4.1
171
100.0
60 - 69
65
66.3
3
3.1
19
19.4
3
3.1
8
8.2
98
100.0
70 and over
56
71.8
3
3.8
9
11.5
4
5.1
6
7.7
78
100.0
Unknown age
12
29.3
13
31.7
7
17.1
2
4.9
7
17.1
41
100.0
Total Male
754
51.2
144
9.8
374
25.4
73
5.0
129
8.8
1,474
100.0
Female
0 – 5
0
0.0
11
73.3
0
0.0
0
0.0
4
26.7
15
100.0
6 – 11
0
0.0
8
66.7
0
0.0
0
0.0
4
33.3
12
100.0
12 - 16
1
2.9
15
42.9
3
8.6
0
0.0
16
45.7
35
100.0
17 - 20
77
67.5
28
24.6
4
3.5
2
1.8
3
2.6
114
100.0
21 - 24
72
75.8
14
14.7
1
1.1
3
3.2
5
5.3
95
100.0
25 - 29
58
60.4
10
10.4
5
5.2
10
10.4
13
13.5
96
100.0
30 - 39
83
66.4
20
16.0
13
10.4
1
0.8
8
6.4
125
100.0
40 - 49
89
68.5
19
14.6
8
6.2
4
3.1
10
7.7
130
100.0
50 - 59
64
70.3
12
13.2
8
8.8
7
7.7
0
0.0
91
100.0
60 - 69
43
74.1
9
15.5
1
1.7
2
3.4
3
5.2
58
100.0
70 and over
48
64.0
15
20.0
0
0.0
0
0.0
12
16.0
75
100.0
Unknown age
16
34.0
30
63.8
0
0.0
1
2.1
0
0.0
47
100.0
Total Female
551
61.7
191
21.4
43
4.8
30
3.4
78
8.7
893
100.0
Unknown Gender
10
3.6
251
90.6
8
2.9
2
0.7
6
2.2
277
100.0
Total Persons KSI
1,315
49.7
586
22.2
425
16.1
105
4.0
213
8.1
2,644
100.0
1. Note that for a large percentage of passengers the gender was not recorded in the crash database.

Reported Road Crashes in Western Australia 2011 27
Table 26 Persons Killed or Seriously Injured by Road User Type by Gender and Age Group – Metropolitan
Road User Type
Driver
Passenger
1
Motorcyclist
Bicycle Rider
Pedestrian
Total
Gender/Age Group
n
Row %
n
Row %
n
Row %
n
Row %
n
Row %
n
Row %
Male
0-5
0
0.0
1
16.7
0
0.0
2
33.3
3
50.0
6
100.0
6-11
0
0.0
3
37.5
0
0.0
1
12.5
4
50.0
8
100.0
12-16
2
5.0
9
22.5
11
27.5
3
7.5
15
37.5
40
100.0
17-20
57
58.8
7
7.2
21
21.6
4
4.1
8
8.2
97
100.0
21-24
58
51.3
12
10.6
29
25.7
2
1.8
12
10.6
113
100.0
25-29
57
54.8
5
4.8
28
26.9
6
5.8
8
7.7
104
100.0
30-39
75
45.7
4
2.4
61
37.2
13
7.9
11
6.7
164
100.0
40-49
60
42.0
3
2.1
55
38.5
16
11.2
9
6.3
143
100.0
50-59
55
51.4
2
1.9
38
35.5
11
10.3
1
0.9
107
100.0
60-69
44
72.1
0
0.0
10
16.4
2
3.3
5
8.2
61
100.0
70 and over
38
70.4
3
5.6
5
9.3
3
5.6
5
9.3
54
100.0
Unknown age
9
29.0
9
29.0
6
19.4
2
6.5
5
16.1
31
100.0
Total Male
455
49.0
58
6.3
264
28.4
65
7.0
86
9.3
928
100.0
Female
0-5
0
0.0
4
57.1
0
0.0
0
0.0
3
42.9
7
100.0
6-11
0
0.0
4
66.7
0
0.0
0
0.0
2
33.3
6
100.0
12-16
0
0.0
10
37.0
2
7.4
0
0.0
15
55.6
27
100.0
17-20
52
71.2
13
17.8
3
4.1
2
2.7
3
4.1
73
100.0
21-24
46
80.7
3
5.3
1
1.8
3
5.3
4
7.0
57
100.0
25-29
45
58.4
5
6.5
5
6.5
10
13.0
12
15.6
77
100.0
30-39
61
70.9
10
11.6
8
9.3
1
1.2
6
7.0
86
100.0
40-49
65
68.4
13
13.7
4
4.2
4
4.2
9
9.5
95
100.0
50-59
45
71.4
7
11.1
4
6.3
7
11.1
0
0.0
63
100.0
60-69
32
72.7
7
15.9
1
2.3
1
2.3
3
6.8
44
100.0
70 and over
34
66.7
8
15.7
0
0.0
0
0.0
9
17.6
51
100.0
Unknown age
13
34.2
24
63.2
0
0.0
1
2.6
0
0.0
38
100.0
Total Female
393
63.0
108
17.3
28
4.5
29
4.6
66
10.6
624
100.0
Unknown Gender
8
4.7
150
87.2
6
3.5
2
1.2
6
3.5
172
100.0
Total Persons KSI
856
49.7
316
18.3
298
17.3
96
5.6
158
9.2
1,724
100.0
1. Note that for a large percentage of passengers the gender was not recorded in the crash database.

Reported Road Crashes in Western Australia 2011 28
Table 27 Persons Killed or Seriously Injured by Road User Type by Gender and Age Group – Regional
Road User Type
Driver
Passenger
1
Motorcyclist
Bicycle Rider
Pedestrian
Total
Gender/Age Group
n
Row %
n
Row %
n
Row %
n
Row %
n
Row %
n
Row %
Male
0-5
0
0.0
1
100.0
0
0.0
0
0.0
0
0.0
1
100.0
6-11
0
0.0
2
33.3
0
0.0
0
0.0
4
66.7
6
100.0
12-16
1
10.0
1
10.0
3
30.0
1
10.0
4
40.0
10
100.0
17-20
29
58.0
6
12.0
9
18.0
1
2.0
5
10.0
50
100.0
21-24
18
52.9
10
29.4
4
11.8
1
2.9
1
2.9
34
100.0
25-29
20
55.6
4
11.1
9
25.0
0
0.0
3
8.3
36
100.0
30-39
39
67.2
5
8.6
11
19.0
1
1.7
2
3.4
58
100.0
40-49
23
42.6
4
7.4
20
37.0
0
0.0
7
13.0
54
100.0
50-59
16
47.1
3
8.8
12
35.3
0
0.0
3
8.8
34
100.0
60-69
10
45.5
3
13.6
6
27.3
1
4.5
2
9.1
22
100.0
70 and over
15
75.0
0
0.0
4
20.0
1
5.0
0
0.0
20
100.0
Unknown age
3
42.9
2
28.6
0
0.0
0
0.0
2
28.6
7
100.0
Total Male
174
52.4
41
12.3
78
23.5
6
1.8
33
9.9
332
100.0
Female
0-5
0
0.0
3
75.0
0
0.0
0
0.0
1
25.0
4
100.0
6-11
0
0.0
0
0.0
0
0.0
0
0.0
1
100.0
1
100.0
12-16
1
14.3
4
57.1
1
14.3
0
0.0
1
14.3
7
100.0
17-20
14
56.0
11
44.0
0
0.0
0
0.0
0
0.0
25
100.0
21-24
16
80.0
3
15.0
0
0.0
0
0.0
1
5.0
20
100.0
25-29
5
71.4
1
14.3
0
0.0
0
0.0
1
14.3
7
100.0
30-39
18
62.1
6
20.7
4
13.8
0
0.0
1
3.4
29
100.0
40-49
15
71.4
3
14.3
3
14.3
0
0.0
0
0.0
21
100.0
50-59
17
70.8
3
12.5
4
16.7
0
0.0
0
0.0
24
100.0
60-69
7
87.5
0
0.0
0
0.0
1
12.5
0
0.0
8
100.0
70 and over
13
61.9
5
23.8
0
0.0
0
0.0
3
14.3
21
100.0
Unknown age
2
33.3
4
66.7
0
0.0
0
0.0
0
0.0
6
100.0
Total Female
108
62.4
43
24.9
12
6.9
1
0.6
9
5.2
173
100.0
Unknown Gender
1
1.7
58
96.7
1
1.7
0
0.0
0
0.0
60
100.0
Total Persons KSI
283
50.1
142
25.1
91
16.1
7
1.2
42
7.4
565
100.0
1. Note that for a large percentage of passengers the gender was not recorded in the crash database.

Reported Road Crashes in Western Australia 2011 29
Table 28 Persons Killed or Seriously Injured by Road User Type by Gender and Age Group – Remote
Road User Type
Driver
Passenger
1
Motorcyclist
Bicycle Rider
Pedestrian
Total
Gender/Age Group
n
Row %
n
Row %
n
Row %
n
Row %
n
Row %
n
Row %
Male
0-5
0
0.0
4
100.0
0
0.0
0
0.0
0
0.0
4
100.0
6-11
0
0.0
5
83.3
0
0.0
0
0.0
1
16.7
6
100.0
12-16
0
0.0
6
85.7
1
14.3
0
0.0
0
0.0
7
100.0
17-20
14
60.9
5
21.7
3
13.0
0
0.0
1
4.3
23
100.0
21-24
13
68.4
2
10.5
4
21.1
0
0.0
0
0.0
19
100.0
25-29
18
60.0
8
26.7
2
6.7
0
0.0
2
6.7
30
100.0
30-39
22
64.7
4
11.8
6
17.6
1
2.9
1
2.9
34
100.0
40-49
23
59.0
8
20.5
7
17.9
1
2.6
0
0.0
39
100.0
50-59
21
70.0
1
3.3
5
16.7
0
0.0
3
10.0
30
100.0
60-69
11
73.3
0
0.0
3
20.0
0
0.0
1
6.7
15
100.0
70 and over
3
75.0
0
0.0
0
0.0
0
0.0
1
25.0
4
100.0
Unknown age
0
0.0
2
66.7
1
33.3
0
0.0
0
0.0
3
100.0
Total Male
125
58.4
45
21.0
32
15.0
2
0.9
10
4.7
214
100.0
Female
0-5
0
0.0
4
100.0
0
0.0
0
0.0
0
0.0
4
100.0
6-11
0
0.0
4
80.0
0
0.0
0
0.0
1
20.0
5
100.0
12-16
0
0.0
1
100.0
0
0.0
0
0.0
0
0.0
1
100.0
17-20
11
68.8
4
25.0
1
6.3
0
0.0
0
0.0
16
100.0
21-24
10
55.6
8
44.4
0
0.0
0
0.0
0
0.0
18
100.0
25-29
8
66.7
4
33.3
0
0.0
0
0.0
0
0.0
12
100.0
30-39
4
40.0
4
40.0
1
10.0
0
0.0
1
10.0
10
100.0
40-49
9
64.3
3
21.4
1
7.1
0
0.0
1
7.1
14
100.0
50-59
2
50.0
2
50.0
0
0.0
0
0.0
0
0.0
4
100.0
60-69
4
66.7
2
33.3
0
0.0
0
0.0
0
0.0
6
100.0
70 and over
1
33.3
2
66.7
0
0.0
0
0.0
0
0.0
3
100.0
Unknown age
1
33.3
2
66.7
0
0.0
0
0.0
0
0.0
3
100.0
Total Female
50
52.1
40
41.7
3
3.1
0
0.0
3
3.1
96
100.0
Unknown Gender
1
2.2
43
95.6
1
2.2
0
0.0
0
0.0
45
100.0
Total Persons KSI
176
49.6
128
36.1
36
10.1
2
0.6
13
3.7
355
100.0
1. Note that for a large percentage of passengers the gender was not recorded in the crash database.

Reported Road Crashes in Western Australia 2011 30
3. BROAD AGE GROUPS
3.1 Child Road Users – 0 to 16 years
Figure 11 Children Killed or Seriously Injured by Road User Type
Table 29 Children Killed or Seriously Injured by Road User Type and Age Group
Road User Type
Driver
Passenger
Motorcyclist
Bicyclist
Pedestrian
Total
Age Group
n
n
n
n
n
n
0 - 5
0
29
0
2
7
38
6 - 11
0
39
0
1
13
53
12 - 16
5
48
18
4
36
111
Total Children KSI
5
116
18
7
56
202
Table 30 Children Killed or Seriously Injured by Speed a Factor and Age Group, Police-
Attended Crashes
Speed a Factor in Crash
Yes
No
Unknown
Total
Age Group
n
Row %
n
Row %
n
Row %
n
Row %
0 - 5
4
11.8
14
41.2
16
47.1
34
100.0
6 - 11
8
16.0
17
34.0
25
50.0
50
100.0
12 - 16
23
23.5
23
23.5
52
53.1
98
100.0
Total Children KSI
35
19.2
54
29.7
93
51.1
182
100.0
All Persons KSI
1
334
14.3
791
33.8
1,217
52.0
2,342
100.0
1. Includes persons with unknown age

Reported Road Crashes in Western Australia 2011 31
Table 31 Child Motor Vehicle Occupants Killed or Seriously Injured by Seat Belt Usage and
Age Group, Police-Attended Crashes
Seat Belt Usage
Worn
Not Worn
Unknown
Total
Age Group
n
Row %
n
Row %
n
Row %
n
Row %
0 - 5
20
80.0
4
16.0
1
4.0
25
100.0
6 - 11
24
66.7
5
13.9
7
19.4
36
100.0
12 - 16
30
65.2
10
21.7
6
13.0
46
100.0
Total Child Motor
Vehicle Occupants KSI
74
69.2
19
17.8
14
13.1
107
100.0
All Motor Vehicle
Occupants KSI
1
1,383
81.8
119
7.0
189
11.2
1,691
100.0
Note: Motor vehicle occupants exclude occupants of tractors and trailer type vehicles.
1. Includes persons with unknown age.
Table 32 Child Bicylists Killed or Seriously Injured by Helmet Usage and Gender
Helmet Usage
Worn
Not Worn
Unknown
Total
Gender
n
n
n
n
Male
2
5
0
7
Female
0
0
0
0
Total Child Bicyclists KSI
2
5
0
7

Reported Road Crashes in Western Australia 2011 32
Table 33 Children Killed or Seriously Injured by Time of Day and Age Group
Time of Day
Midnight to
< 3am
3am to < 6am
6am to < 9am
9am to
< Midday
Midday to
< 3pm
3pm to < 6pm
6pm to < 9pm
9pm to
< Midnight
Unknown
Total
Age Group
n
Row %
n
Row %
n
Row %
n
Row %
n
Row %
n
Row %
n
Row %
n
Row %
n
Row %
n
Row %
0 - 5
1
2.6
0
0.0
4
10.5
2
5.3
8
21.1
14
36.8
7
18.4
0
0.0
2
5.3
38
100.0
6 - 11
1
1.9
0
0.0
9
17.0
3
5.7
9
17.0
19
35.8
7
13.2
4
7.5
1
1.9
53
100.0
12 - 16
5
4.5
9
8.1
10
9.0
13
11.7
7
6.3
35
31.5
15
13.5
17
15.3
0
0.0
111
100.0
Total Children KSI
7
3.5
9
4.5
23
11.4
18
8.9
24
11.9
68
33.7
29
14.4
21
10.4
3
1.5
202
100.0
All Persons KSI
1
148
5.6
110
4.2
339
12.8
358
13.5
432
16.3
572
21.6
385
14.6
262
9.9
38
1.4
2,644
100.0
1. Includes persons with unknown age.
Table 34 Children Killed or Seriously Injured by Day of Week and Age Group
Day of Week
Monday
Tuesday
Wednesday
Thursday
Friday
Saturday
Sunday
Total
Age Group
n
Row %
n
Row %
n
Row %
n
Row %
n
Row %
n
Row %
n
Row %
n
Row %
0 - 5
5
13.2
6
15.8
8
21.1
7
18.4
4
10.5
3
7.9
5
13.2
38
100.0
6 - 11
2
3.8
8
15.1
9
17.0
7
13.2
9
17.0
7
13.2
11
20.8
53
100.0
12 - 16
15
13.5
12
10.8
8
7.2
20
18.0
14
12.6
34
30.6
8
7.2
111
100.0
Total Children KSI
22
10.9
26
12.9
25
12.4
34
16.8
27
13.4
44
21.8
24
11.9
202
100.0
All Persons KSI
1
292
11.0
365
13.8
356
13.5
369
14.0
445
16.8
445
16.8
372
14.1
2,644
100.0
1. Includes persons with unknown age.

Reported Road Crashes in Western Australia 2011 33
3.2 Young Adult Road Users – 17 to 24 years
Figure 12 Young Adults Killed or Seriously Injured by Road User Type
Table 35 Young Adults Killed or Seriously Injured by Road User Type and Age Group
Road User Type
Driver
Passenger
Motorcyclist
Bicyclist
Pedestrian
Total
Age Group
n
n
n
n
n
n
17 - 20
178
91
39
7
17
332
21 - 24
163
72
40
6
19
300
Total Young Adults KSI
341
163
79
13
36
632
Table 36 Young Adults Killed or Seriously Injured by Speed a Factor and Age Group, Police-
Attended Crashes
Speed a Factor in Crash
Yes
No
Unknown
Total
Age Group
n
Row %
n
Row %
n
Row %
n
Row %
17 - 20
54
17.8
104
34.2
146
48.0
304
100.0
21 - 24
53
19.5
94
34.6
125
46.0
272
100.0
Total Young Adults KSI
107
18.6
198
34.4
271
47.0
576
100.0
All Persons KSI
1
334
14.3
791
33.8
1,217
52.0
2,342
100.0
1. Includes persons with unknown age.
Reported Road Crashes in Western Australia 2011 34
Table 37 Young Adults Killed or Seriously Injured by Highest Driver/Rider BAC in Crash and Age Group, Police-Attended Crashes
Highest Driver/Rider BAC in Crash (g/100mL)
Nil
>0 to <0.05
0.05 to <0.08
0.08 to <0.15
0.15
Subtotal 0.05
Unknown
Total
Age Group
n
Row %
n
Row %
n
Row %
n
Row %
n
Row %
n
Row %
n
Row %
n
Row %
17 - 20
190
62.7
12
4.0
11
3.6
18
5.9
7
2.3
36
11.9
65
21.5
303
100.0
21 - 24
154
56.8
10
3.7
4
1.5
23
8.5
13
4.8
40
14.8
67
24.7
271
100.0
Total Young Adults
KSI
1
344
59.9
22
3.8
15
2.6
41
7.1
20
3.5
76
13.2
132
23.0
574
100.0
All Persons KSI
2, 3
1,016
67.1
42
2.8
30
2.0
72
4.8
49
3.2
151
10.0
306
20.2
1,515
100.0
1. Excludes young adults killed or seriously injured in police-attended crashes that did not involve any drivers/riders (n=2).
2. Excludes persons killed or seriously injured in police-attended crashes that did not involve any drivers/riders (n=6).
3. Includes persons with unknown age.

Reported Road Crashes in Western Australia 2011 35
Table 38 Young Adult Drivers/Riders Involved in Serious Crashes by Driver/Rider BAC and Age Group, Police-Attended Crashes
Driver/Rider BAC (g/100mL)
Nil
>0 to <0.05
0.05 to <0.08
0.08 to <0.15
0.15
Subtotal 0.05
Unknown
Total
Age Group
n
Row %
n
Row %
n
Row %
n
Row %
n
Row %
n
Row %
n
Row %
n
Row %
Young Adult Drivers/Riders KSI
17 – 20
120
61.9
7
3.6
5
2.6
6
3.1
4
2.1
15
7.7
52
26.8
194
100.0
21 – 24
95
53.1
8
4.5
2
1.1
12
6.7
9
5.0
23
12.8
53
29.6
179
100.0
Total Drivers/Riders KSI
215
57.6
15
4.0
7
1.9
18
4.8
13
3.5
38
10.2
105
28.2
373
100.0
Other Young Adult Drivers/Riders
1
17 - 20
108
65.9
3
1.8
3
1.8
7
4.3
0
0.0
10
6.1
43
26.2
164
100.0
21 - 24
117
67.2
3
1.7
3
1.7
6
3.4
2
1.1
11
6.3
43
24.7
174
100.0
Total Other Drivers/Riders
225
66.6
6
1.8
6
1.8
13
3.8
2
0.6
21
6.2
86
25.4
338
100.0
Total Young Adult Drivers/Riders
17 - 20
228
63.7
10
2.8
8
2.2
13
3.6
4
1.1
25
7.0
95
26.5
358
100.0
21 - 24
212
60.1
11
3.1
5
1.4
18
5.1
11
3.1
34
9.6
96
27.2
353
100.0
Total Young Adult Drivers/Riders in
Serious Crashes
440
61.9
21
3.0
13
1.8
31
4.4
15
2.1
59
8.3
191
26.9
711
100.0
1. Other young adult drivers/riders are young adult drivers/riders in crashes where a road user was killed or seriously injured, but the driver/riders themselves had only minor injuries or
no/unknown injuries.
Table 39 Young Adult Motor Vehicle Occupants Killed or Seriously Injured by Seat Belt Usage and Age Group, Police-Attended Crashes
Seat Belt Usage
Worn
Not Worn
Unknown
Total
Age Group
n
Row %
n
Row %
n
Row %
n
Row %
17 - 20
203
82.2
23
9.3
21
8.5
247
100.0
21 - 24
171
80.7
16
7.5
25
11.8
212
100.0
Total Young Adult Motor Vehicle
Occupants KSI
374
81.5
39
8.5
46
10.0
459
100.0
All Motor Vehicle Occupants KSI
1
1,383
81.8
119
7.0
189
11.2
1,691
100.0
Note: Motor vehicle occupants exclude occupants of tractors and trailer type vehicles.
1. Includes persons with unknown age.

Reported Road Crashes in Western Australia 2011 36
Table 40 Young Adult Drivers/Riders Involved in Serious Crashes by Crash Nature and Age Group
Crash Nature
Multi-Vehicle Crashes
Single-Vehicle Crashes
Total
Head On
Right Angle
Other/Unknown
Multi
Total Multi
Hit Pedestrian
Hit Animal
Hit Object
Non Collision
Other/Unknown
Single
Total Single
Age Group
n
Row %
n
Row %
n
Row %
n
Row %
n
Row %
n
Row %
n
Row %
n
Row %
n
Row %
n
Row %
n
Row %
17 - 20
17
4.3
80
20.5
135
34.5
232
59.3
25
6.4
0
0.0
99
25.3
29
7.4
6
1.5
159
40.7
391
100.0
21 - 24
20
5.1
80
20.2
152
38.4
252
63.6
21
5.3
2
0.5
88
22.2
32
8.1
1
0.3
144
36.4
396
100.0
Total Young Adult
Drivers/Riders in
Serious Crashes
37
4.7
160
20.3
287
36.5
484
61.5
46
5.8
2
0.3
187
23.8
61
7.8
7
0.9
303
38.5
787
100.0
All Drivers/Riders in
Serious Crashes
1
207
6.0
734
21.4
1,497
43.6
2,438
71.1
194
5.7
12
0.3
534
15.6
220
6.4
33
1.0
993
28.9
3,431
100.0
1. Includes persons with unknown age.
Table 41 Young Adult Drivers/Riders Involved in Serious Crashes by High Priority Crash Type and Age Group
High Priority Crash Types
Total
Intersection
Run Off Road
Head On
Other
Age Group
n
Row %
n
Row %
n
Row %
n
Row %
n
Row %
17 - 20
171
43.7
122
31.2
17
4.3
97
24.8
391
100.0
21 - 24
199
50.3
114
28.8
20
5.1
78
19.7
396
100.0
Total Young Adult Drivers/Riders in Serious Crashes
370
47.0
236
30.0
37
4.7
175
22.2
787
100.0
All Drivers/Riders in Serious Crashes
1
1,642
47.9
769
22.4
207
6.0
919
26.8
3,431
100.0
Note: High Priority Crash Types are not mutually exclusive and, therefore, some crashes may be counted more than once and percentages will sum to greater than 100%.
1. Includes persons with unknown age.

Reported Road Crashes in Western Australia 2011 37
Table 42 Young Adults Killed or Seriously Injured by Time of Day and Age Group
Time of Day
Midnight to
< 3am
3am to < 6am
6am to < 9am
9am to
< Midday
Midday to
< 3pm
3pm to < 6pm
6pm to < 9pm
9pm to
< Midnight
Unknown
Total
Age Group
n
Row %
n
Row %
n
Row %
n
Row %
n
Row %
n
Row %
n
Row %
n
Row %
n
Row %
n
Row %
17 - 20
43
13.0
17
5.1
33
9.9
39
11.7
40
12.0
64
19.3
42
12.7
47
14.2
7
2.1
332
100.0
21 - 24
23
7.7
12
4.0
41
13.7
26
8.7
54
18.0
64
21.3
40
13.3
37
12.3
3
1.0
300
100.0
Total Young
Adults KSI
66
10.4
29
4.6
74
11.7
65
10.3
94
14.9
128
20.3
82
13.0
84
13.3
10
1.6
632
100.0
All Persons KSI
1
148
5.6
110
4.2
339
12.8
358
13.5
432
16.3
572
21.6
385
14.6
262
9.9
38
1.4
2,644
100.0
1. Includes persons with unknown age.
Table 43 Young Adults Killed or Seriously Injured by Day of Week and Age Group
Day of Week
Monday
Tuesday
Wednesday
Thursday
Friday
Saturday
Sunday
Total
Age Group
n
Row %
n
Row %
n
Row %
n
Row %
n
Row %
n
Row %
n
Row %
n
Row %
17 - 20
43
13.0
43
13.0
37
11.1
39
11.7
57
17.2
65
19.6
48
14.5
332
100.0
21 - 24
26
8.7
46
15.3
42
14.0
43
14.3
44
14.7
46
15.3
53
17.7
300
100.0
Total Young Adults KSI
69
10.9
89
14.1
79
12.5
82
13.0
101
16.0
111
17.6
101
16.0
632
100.0
All Persons KSI
1
292
11.0
365
13.8
356
13.5
369
14.0
445
16.8
445
16.8
372
14.1
2,644
100.0
1. Includes persons with unknown age.

Reported Road Crashes in Western Australia 2011 38
3.3 Mature Adult Road Users – 25 to 59 years
Figure 13 Mature Adults Killed or Seriously Injured by Road User Type
Table 44 Mature Adults Killed or Seriously Injured by Road User Type and Age Group
Road User Type
Driver
Passenger
Motorcyclist
Bicyclist
Pedestrian
Total
Age Group
n
n
n
n
n
n
25 - 29
154
56
46
17
26
299
30 - 34
113
33
54
11
13
224
35 - 39
106
20
37
5
10
178
40 - 44
94
28
34
8
15
179
45 - 49
102
18
57
13
11
201
50 - 54
82
18
38
15
2
155
55 - 59
76
12
25
4
5
122
Total Mature Adults KSI
727
185
291
73
82
1,358

Reported Road Crashes in Western Australia 2011 39
Table 45 Mature Adults Killed or Seriously Injured by Highest Driver/Rider BAC in Crash and Age Group, Police-Attended Crashes
Highest Driver/Rider BAC in Crash (g/100mL)
Nil
>0 to <0.05
0.05 to <0.08
0.08 to <0.15
0.15
Subtotal 0.05
Unknown
Total
Age Group
n
Row %
n
Row %
n
Row %
n
Row %
n
Row %
n
Row %
n
Row %
n
Row %
25 - 29
155
57.6
11
4.1
8
3.0
20
7.4
13
4.8
41
15.2
62
23.0
269
100.0
30 - 34
109
55.9
5
2.6
7
3.6
20
10.3
12
6.2
39
20.0
42
21.5
195
100.0
35 - 39
107
70.4
1
0.7
3
2.0
8
5.3
10
6.6
21
13.8
23
15.1
152
100.0
40 - 44
103
65.6
6
3.8
3
1.9
8
5.1
2
1.3
13
8.3
35
22.3
157
100.0
45 - 49
114
67.1
4
2.4
1
0.6
9
5.3
4
2.4
14
8.2
38
22.4
170
100.0
50 - 54
101
75.9
1
0.8
1
0.8
5
3.8
5
3.8
11
8.3
20
15.0
133
100.0
55 - 59
86
77.5
2
1.8
0
0.0
2
1.8
2
1.8
4
3.6
19
17.1
111
100.0
Total Mature Adults
KSI
1
775
65.3
30
2.5
23
1.9
72
6.1
48
4.0
143
12.0
239
20.1
1,187
100.0
All Persons KSI
2,3
1,016
67.1
42
2.8
30
2.0
72
4.8
49
3.2
151
10.0
306
20.2
1,515
100.0
1. Excludes mature adults killed or seriously injured in police-attended crashes that did not involve any drivers/riders (n=3).
2. Excludes persons killed or seriously injured in police-attended crashes that did not involve any drivers/riders (n=6).
3. Includes persons with unknown age.

Reported Road Crashes in Western Australia 2011 40
Table 46 Mature Adult Drivers/Riders Involved in Serious Crashes by Crash Nature
Crash Nature
Multi-Vehicle Crashes
Single-Vehicle Crashes
Total
Head On
Right Angle
Other/Unknown
Multi
Total Multi
Hit Pedestrian
Hit Animal
Hit Object
Non Collision
Other/Unknown
Single
Total Single
Age Group
n
Row %
n
Row %
n
Row %
n
Row %
n
Row %
n
Row %
n
Row %
n
Row %
n
Row %
n
Row %
n
Row %
25 - 29
29
7.5
76
19.7
158
41.0
263
68.3
31
8.1
1
0.3
57
14.8
29
7.5
4
1.0
122
31.7
385
100.0
30 - 34
14
4.3
62
19.3
142
44.1
218
67.7
10
3.1
0
0.0
63
19.6
24
7.5
7
2.2
104
32.3
322
100.0
35 - 39
17
6.3
57
21.0
135
49.6
209
76.8
11
4.0
0
0.0
40
14.7
8
2.9
4
1.5
63
23.2
272
100.0
40 - 44
25
8.5
51
17.3
130
44.1
206
69.8
16
5.4
4
1.4
45
15.3
22
7.5
2
0.7
89
30.2
295
100.0
45 - 49
19
6.3
62
20.5
147
48.5
228
75.2
12
4.0
2
0.7
33
10.9
24
7.9
4
1.3
75
24.8
303
100.0
50 - 54
13
5.8
63
27.9
101
44.7
177
78.3
8
3.5
1
0.4
29
12.8
10
4.4
1
0.4
49
21.7
226
100.0
55 - 59
18
9.4
39
20.3
86
44.8
143
74.5
16
8.3
1
0.5
18
9.4
14
7.3
0
0.0
49
25.5
192
100.0
Total Mature Adult
Drivers/Riders in
Serious Crashes
135
6.8
410
20.6
899
45.1
1,444
72.4
104
5.2
9
0.5
285
14.3
131
6.6
22
1.1
551
27.6
1,995
100.0
All Drivers/Riders in
Serious Crashes
1
207
6.0
734
21.4
1,49
7
43.6
2,43
8
71.1
194
5.7
12
0.3
534
15.6
220
6.4
33
1.0
993
28.9
3,431
100.0
1. Includes persons with unknown age.

Reported Road Crashes in Western Australia 2011 41
Table 47 Mature Adult Drivers/Riders Involved in Serious Crashes by Driver/Rider BAC and Age Group, Police-Attended Crashes
Driver/Rider BAC (g/100mL)
Nil
>0 to <0.05
0.05 to <0.08
0.08 to <0.15
0.15
Subtotal 0.05
Unknown
Total
Age Group
n
Row %
n
Row %
n
Row %
n
Row %
n
Row %
n
Row %
n
Row %
n
Row %
Mature Adult Drivers/Riders KSI
25 – 29
93
53.1
5
2.9
4
2.3
9
5.1
8
4.6
21
12.0
56
32.0
175
100.0
30 – 34
71
49.7
2
1.4
7
4.9
12
8.4
9
6.3
28
19.6
42
29.4
143
100.0
35 – 39
76
63.9
0
0.0
3
2.5
6
5.0
5
4.2
14
11.8
29
24.4
119
100.0
40 – 44
70
62.5
3
2.7
2
1.8
3
2.7
1
0.9
6
5.4
33
29.5
112
100.0
45 – 49
87
65.4
3
2.3
0
0.0
3
2.3
3
2.3
6
4.5
37
27.8
133
100.0
50 – 54
69
68.3
1
1.0
1
1.0
4
4.0
4
4.0
9
8.9
22
21.8
101
100.0
55 – 59
68
72.3
1
1.1
0
0.0
1
1.1
2
2.1
3
3.2
22
23.4
94
100.0
Total Drivers/Riders KSI
534
60.9
15
1.7
17
1.9
38
4.3
32
3.6
87
9.9
241
27.5
877
100.0
Other Mature Adult Drivers/Riders
1
25 - 29
107
64.8
3
1.8
7
4.2
7
4.2
3
1.8
17
10.3
38
23.0
165
100.0
30 - 34
83
61.5
2
1.5
0
0.0
2
1.5
3
2.2
5
3.7
45
33.3
135
100.0
35 - 39
74
67.9
0
0.0
0
0.0
1
0.9
0
0.0
1
0.9
34
31.2
109
100.0
40 - 44
99
64.7
1
0.7
0
0.0
6
3.9
1
0.7
7
4.6
46
30.1
153
100.0
45 - 49
91
72.2
0
0.0
1
0.8
0
0.0
1
0.8
2
1.6
33
26.2
126
100.0
50 - 54
55
59.8
1
1.1
0
0.0
1
1.1
1
1.1
2
2.2
34
37.0
92
100.0
55 - 59
57
72.2
2
2.5
0
0.0
0
0.0
0
0.0
0
0.0
20
25.3
79
100.0
Total Other Drivers/Riders
566
65.9
9
1.0
8
0.9
17
2.0
9
1.0
34
4.0
250
29.1
859
100.0
Total Mature Adult Drivers/Riders
25 - 29
200
58.8
8
2.4
11
3.2
16
4.7
11
3.2
38
11.2
94
27.6
340
100.0
30 - 34
154
55.4
4
1.4
7
2.5
14
5.0
12
4.3
33
11.9
87
31.3
278
100.0
35 - 39
150
65.8
0
0.0
3
1.3
7
3.1
5
2.2
15
6.6
63
27.6
228
100.0
40 - 44
169
63.8
4
1.5
2
0.8
9
3.4
2
0.8
13
4.9
79
29.8
265
100.0
45 - 49
178
68.7
3
1.2
1
0.4
3
1.2
4
1.5
8
3.1
70
27.0
259
100.0
50 - 54
124
64.2
2
1.0
1
0.5
5
2.6
5
2.6
11
5.7
56
29.0
193
100.0
55 - 59
125
72.3
3
1.7
0
0.0
1
0.6
2
1.2
3
1.7
42
24.3
173
100.0
Total Mature Adult Drivers/Riders
in Serious Crashes
1,100
63.4
24
1.4
25
1.4
55
3.2
41
2.4
121
7.0
491
28.3
1,736
100.0
1. Other mature adult drivers/riders are mature adult drivers/riders in crashes where a road user was killed or seriously injured, but the driver/riders themselves had only minor injuries or
no/unknown injuries.

Reported Road Crashes in Western Australia 2011 42
Table 48 Mature Adult Drivers/Riders Involved in Serious Crashes by High Priority Crash Type and Age Group
High Priority Crash Types
Total
Intersection
Run Off Road
Head On
Other
Age Group
n
Row %
n
Row %
n
Row %
n
Row %
n
Row %
25 - 29
158
41.0
92
23.9
29
7.5
116
30.1
385
100.0
30 - 34
140
43.5
87
27.0
14
4.3
89
27.6
322
100.0
35 - 39
125
46.0
54
19.9
17
6.3
84
30.9
272
100.0
40 - 44
121
41.0
66
22.4
25
8.5
90
30.5
295
100.0
45 - 49
160
52.8
62
20.5
19
6.3
69
22.8
303
100.0
50 - 54
123
54.4
38
16.8
13
5.8
58
25.7
226
100.0
55 - 59
99
51.6
33
17.2
18
9.4
49
25.5
192
100.0
Total Mature Adult Drivers/Riders in Serious Crashes
926
46.4
432
21.7
135
6.8
555
27.8
1,995
100.0
All Drivers/Riders in Serious Crashes
1
1,642
47.9
769
22.4
207
6.0
919
26.8
3,431
100.0
Note: High Priority Crash Types are not mutually exclusive and, therefore, some crashes may be counted more than once and percentages will sum to greater than 100%.
1. Includes persons with unknown age.

Reported Road Crashes in Western Australia 2011 43
Table 49 Mature Adult Motor Vehicle Occupants Killed or Seriously Injured by Seat Belt
Usage and Age Group, Police-Attended Crashes
Seat Belt Usage
Worn
Not Worn
Unknown
Total
Age Group
n
Row %
n
Row %
n
Row %
n
Row %
25 - 29
147
79.0
17
9.1
22
11.8
186
100.0
30 - 34
90
70.3
13
10.2
25
19.5
128
100.0
35 - 39
94
84.7
6
5.4
11
9.9
111
100.0
40 - 44
90
81.1
5
4.5
16
14.4
111
100.0
45 - 49
84
84.0
5
5.0
11
11.0
100
100.0
50 - 54
76
86.4
5
5.7
7
8.0
88
100.0
55 - 59
69
87.3
2
2.5
8
10.1
79
100.0
Total Mature Adult Motor
Vehicle Occupants KSI
650
80.9
53
6.6
100
12.5
803
100.0
All Motor Vehicle
Occupants KSI
1
1,383
81.8
119
7.0
189
11.2
1,691
100.0
Note: Motor vehicle occupants exclude occupants of tractors and trailer type vehicles.
1. Includes persons with unknown age.

Reported Road Crashes in Western Australia 2011 44
3.4 Senior Adult Road Users – 60 years or older
Figure 14 Senior Adults Killed or Seriously Injured by Road User Group
Table 50 Senior Adults Killed or Seriously Injured by Road User Type and Age Group
Road User Type
Driver
Passenger
Motorcyclist
Bicyclist
Pedestrian
Total
Age Group
n
n
n
n
n
n
60 - 64
64
9
16
2
8
99
65 - 69
44
9
4
3
3
63
70 - 74
34
7
7
0
5
53
75 - 79
20
8
2
0
3
33
80 - 84
34
9
0
4
2
49
85 and over
16
4
0
0
8
28
Total Senior Adults KSI
212
46
29
9
29
325

Reported Road Crashes in Western Australia 2011 45
Table 51 Senior Adult Drivers/Riders Involved in Serious Crashes by Crash Nature
Crash Nature
Multi-Vehicle Crashes
Single-Vehicle Crashes
Total
Head On
Right Angle
Other/Unknown
Multi
Total Multi
Hit Pedestrian
Hit Animal
Hit Object
Non Collision
Other/Unknown
Single
Total Single
Age Group
n
Row %
n
Row %
n
Row %
n
Row %
n
Row %
n
Row %
n
Row %
n
Row %
n
Row %
n
Row %
n
Row %
60 - 64
7
4.7
38
25.5
69
46.3
114
76.5
6
4.0
0
0.0
21
14.1
7
4.7
1
0.7
35
23.5
149
100.0
65 - 69
10
10.8
27
29.0
45
48.4
82
88.2
2
2.2
0
0.0
4
4.3
5
5.4
0
0.0
11
11.8
93
100.0
70 - 74
5
7.9
13
20.6
36
57.1
54
85.7
2
3.2
1
1.6
4
6.3
2
3.2
0
0.0
9
14.3
63
100.0
75 - 79
1
2.5
17
42.5
18
45.0
36
90.0
1
2.5
0
0.0
3
7.5
0
0.0
0
0.0
4
10.0
40
100.0
80 - 84
1
2.2
18
40.0
15
33.3
34
75.6
2
4.4
0
0.0
7
15.6
1
2.2
1
2.2
11
24.4
45
100.0
85 and over
1
3.8
5
19.2
10
38.5
16
61.5
4
15.4
0
0.0
6
23.1
0
0.0
0
0.0
10
38.5
26
100.0
Total Senior Adult
Drivers/Riders in
Serious Crashes
25
6.0
118
28.4
193
46.4
336
80.8
17
4.1
1
0.2
45
10.8
15
3.6
2
0.5
80
19.2
416
100.0
All Drivers/Riders in
Serious Crashes
1
207
6.0
734
21.4
1,497
43.6
2,438
71.1
194
5.7
12
0.3
534
15.6
220
6.4
33
1.0
993
28.9
3,431
100.0
1. Includes persons with unknown age.

Reported Road Crashes in Western Australia 2011 46
Table 52 Senior Adult Drivers/Riders Involved in Serious Crashes by High Priority Crash Type and Age Group
High Priority Crash Types
Total
Intersection
Run Off Road
Head On
Other
Age Group
n
Row %
n
Row %
n
Row %
n
Row %
n
Row %
60 - 64
86
57.7
27
18.1
7
4.7
34
22.8
149
100.0
65 - 69
56
60.2
9
9.7
10
10.8
19
20.4
93
100.0
70 - 74
36
57.1
8
12.7
5
7.9
15
23.8
63
100.0
75 - 79
24
60.0
5
12.5
1
2.5
10
25.0
40
100.0
80 - 84
27
60.0
7
15.6
1
2.2
10
22.2
45
100.0
85 and over
15
57.7
5
19.2
1
3.8
7
26.9
26
100.0
Total Senior Adult Drivers/Riders in Serious Crashes
244
58.7
61
14.7
25
6.0
95
22.8
416
100.0
All Drivers/Riders in Serious Crashes
1
1,642
47.9
769
22.4
207
6.0
919
26.8
3,431
100.0
Note: High Priority Crash Types are not mutually exclusive and, therefore, some crashes may be counted more than once and percentages will sum to greater than 100%.
1. Includes persons with unknown age.
Table 53 Senior Adults Killed or Seriously Injured by Day of Week and Age Group
Day of Week
Monday
Tuesday
Wednesday
Thursday
Friday
Saturday
Sunday
Total
Age Group
n
Row %
n
Row %
n
Row %
n
Row %
n
Row %
n
Row %
n
Row %
n
Row %
60 - 64
7
7.1
13
13.1
20
20.2
15
15.2
17
17.2
15
15.2
12
12.1
99
100.0
65 - 69
4
6.3
13
20.6
9
14.3
7
11.1
15
23.8
9
14.3
6
9.5
63
100.0
70 - 74
11
20.8
9
17.0
5
9.4
8
15.1
8
15.1
5
9.4
7
13.2
53
100.0
75 - 79
1
3.0
4
12.1
13
39.4
7
21.2
4
12.1
3
9.1
1
3.0
33
100.0
80 - 84
7
14.3
9
18.4
4
8.2
6
12.2
13
26.5
6
12.2
4
8.2
49
100.0
85 and over
1
3.6
4
14.3
2
7.1
7
25.0
7
25.0
4
14.3
3
10.7
28
100.0
Total Senior Adults KSI
31
9.5
52
16.0
53
16.3
50
15.4
64
19.7
42
12.9
33
10.2
325
100.0
All Persons KSI
1
292
11.0
365
13.8
356
13.5
369
14.0
445
16.8
445
16.8
372
14.1
2,644
100.0
1. Includes persons with unknown age.

Reported Road Crashes in Western Australia 2011 47
Table 54 Senior Adults Killed or Seriously Injured by Time of Day and Age Group
Time of Day
Midnight to <
3am
3am to < 6am
6am to < 9am
9am to <
Midday
Midday to <
3pm
3pm to < 6pm
6pm to < 9pm
9pm to <
Midnight
Unknown
Total
Age Group
n
Row %
n
Row %
n
Row %
n
Row %
n
Row %
n
Row %
n
Row %
n
Row %
n
Row %
n
Row %
60 - 64
2
2.0
2
2.0
7
7.1
20
20.2
28
28.3
12
12.1
17
17.2
9
9.1
2
2.0
99
100.0
65 - 69
0
0.0
1
1.6
10
15.9
20
31.7
16
25.4
9
14.3
4
6.3
3
4.8
0
0.0
63
100.0
70 - 74
0
0.0
0
0.0
9
17.0
15
28.3
11
20.8
8
15.1
7
13.2
3
5.7
0
0.0
53
100.0
75 - 79
0
0.0
0
0.0
6
18.2
9
27.3
6
18.2
9
27.3
0
0.0
1
3.0
2
6.1
33
100.0
80 - 84
0
0.0
0
0.0
1
2.0
12
24.5
13
26.5
16
32.7
4
8.2
3
6.1
0
0.0
49
100.0
85 and over
0
0.0
1
3.6
2
7.1
12
42.9
5
17.9
4
14.3
2
7.1
1
3.6
1
3.6
28
100.0
Total Senior
Adults KSI
2
0.6
4
1.2
35
10.8
88
27.1
79
24.3
58
17.8
34
10.5
20
6.2
5
1.5
325
100.0
All Persons KSI
1
148
5.6
110
4.2
339
12.8
358
13.5
432
16.3
572
21.6
385
14.6
262
9.9
38
1.4
2,644
100.0
1. Includes persons with unknown age.

Reported Road Crashes in Western Australia 2011 48
4. SAFE SYSTEM
4.1 Safe Road User Behaviours
4.1.1 Speeding
Speed is a contributing factor to the occurrence and severity of crashes by reducing response time
and increasing the amount of energy in a crash. It is not just driving faster than the posted speed
limit. Speed can be a contributing factor if the vehicle is being driven too fast for the prevailing
weather, visibility, traffic and road conditions without full regard for the condition of the vehicle,
driver skills and experience. Whether speed was a contributing factor in causing a crash and
increasing crash severity is most reliably determined by an attending police officer, hence this
section considers police-attended crashes only. This resulted in the exclusion of 2 of the 163 fatal
crashes and 271 of the 2,006 hospitalisation crashes that occurred in 2011.
Table 55 Speed a Factor by Crash Severity, Police-Attended Crashes – State
Speed a Factor in Crash
Crash Severity
Fatal
Hospitalisation
Total Serious
Other
Total
n
Col %
n
Col %
n
Col %
n
Col %
n
Col %
Yes
44
27.3
207
11.9
251
13.2
651
8.5
902
9.4
No
43
26.7
585
33.7
628
33.1
2,366
30.8
2,994
31.3
Unknown
74
46.0
943
54.4
1,017
53.6
4,664
60.7
5,681
59.3
Total Crashes
161
100.0
1,735
100.0
1,896
100.0
7,681
100.0
9,577
100.0
Table 56 Speed a Factor by Crash Severity, Police-Attended Crashes - Metropolitan
Speed a Factor in Crash
Crash Severity
Fatal
Hospitalisation
Total Serious
Other
Total
n
Col %
n
Col %
n
Col %
n
Col %
n
Col %
Yes
23
34.8
130
11.0
153
12.2
481
8.1
634
8.9
No
13
19.7
332
28.0
345
27.6
1,584
26.8
1,929
27.0
Unknown
30
45.5
722
61.0
752
60.2
3,841
65.0
4,593
64.2
Total Crashes
66
100.0
1,184
100.0
1,250
100.0
5,906
100.0
7,156
100.0
Table 57 Speed a Factor by Crash Severity, Police-Attended Crashes - Regional
Speed a Factor in Crash
Crash Severity
Fatal
Hospitalisation
Total Serious
Other
Total
n
Col %
n
Col %
n
Col %
n
Col %
n
Col %
Yes
11
19.3
46
12.8
57
13.7
124
10.7
181
11.5
No
18
31.6
167
46.6
185
44.6
512
44.3
697
44.4
Unknown
28
49.1
145
40.5
173
41.7
519
44.9
692
44.1
Total Crashes
57
100.0
358
100.0
415
100.0
1,155
100.0
1,570
100.0
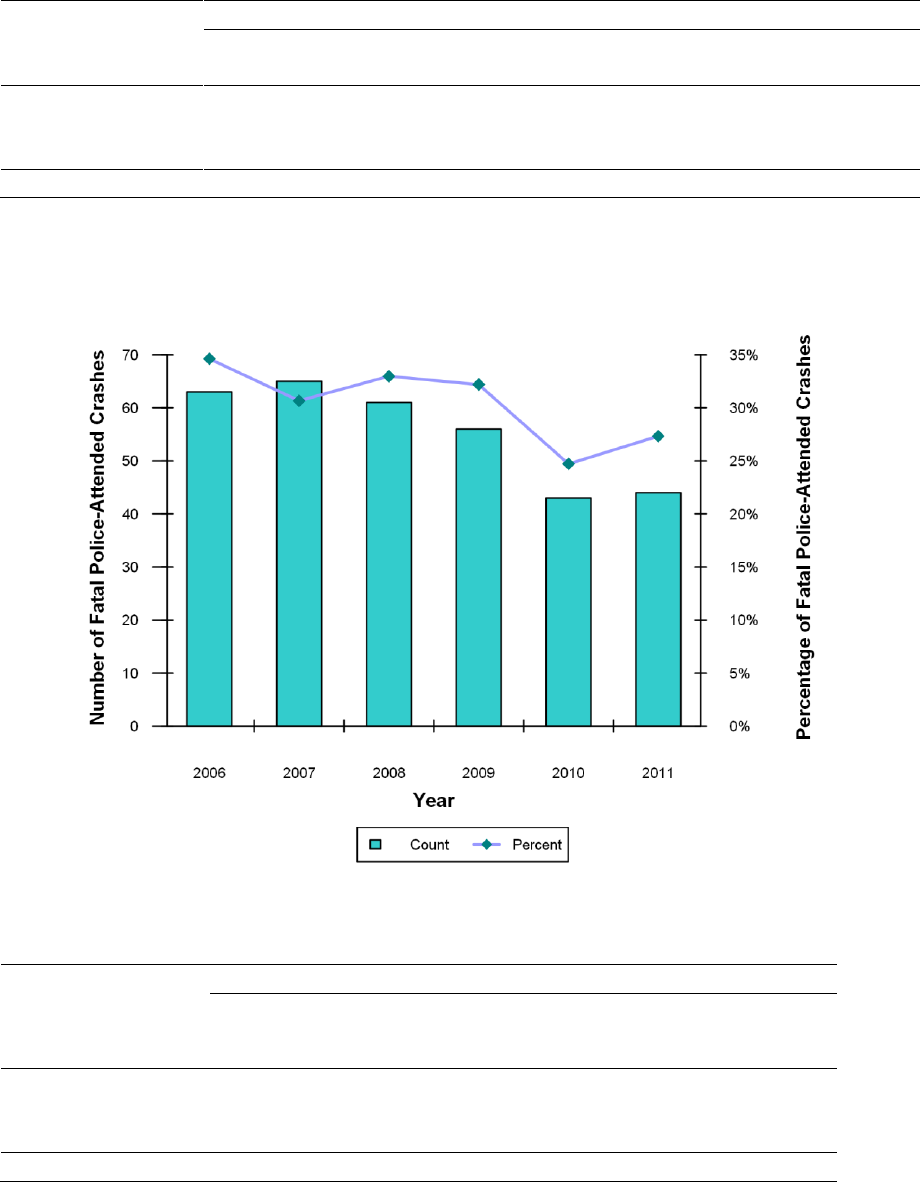
Reported Road Crashes in Western Australia 2011 49
Table 58 Speed a Factor by Crash Severity, Police-Attended Crashes - Remote
Speed a Factor in Crash
Crash Severity
Fatal
Hospitalisation
Total Serious
Other
Total
n
Col %
n
Col %
n
Col %
n
Col %
n
Col %
Yes
10
26.3
31
16.1
41
17.7
46
7.4
87
10.2
No
12
31.6
86
44.6
98
42.4
270
43.5
368
43.2
Unknown
16
42.1
76
39.4
92
39.8
304
49.0
396
46.5
Total Crashes
38
100.0
193
100.0
231
100.0
620
100.0
851
100.0
Figure 15 Fatal Crashes With Speed a Factor by Year, Police-Attended Crashes
Table 59 Fatal Crashes by Speed a Factor by Year, Police-Attended Crashes
Year
2006
2007
2008
2009
2010
2011
2011 Change
from 2010
Speed a Factor in Crash
n
n
n
n
n
n
%
Yes
63
65
61
56
43
44
2.3
No
43
56
37
37
39
43
10.3
Unknown
76
91
87
81
92
74
-19.6
Total Fatal Crashes
182
212
185
174
174
161
-7.5

Reported Road Crashes in Western Australia 2011 50
Table 60 Serious Crashes by Speed a Factor by ARIA Category, Police-Attended Crashes
Speed a Factor
Yes
No
Unknown
Total
ARIA Category
n
Row %
n
Row %
n
Row %
n
Row %
Highly Accessible
159
12.2
360
27.7
781
60.1
1,300
100.0
Accessible
31
13.9
103
46.2
89
39.9
223
100.0
Moderately Accessible
25
13.5
88
47.6
72
38.9
185
100.0
Remote
22
18.0
48
39.3
52
42.6
122
100.0
Very Remote
14
21.2
29
43.9
23
34.8
66
100.0
Total Serious Crashes
251
13.2
628
33.1
1,017
53.6
1,896
100.0
Table 61 Drivers/Riders Involved in Fatal Crashes by Speed a Factor by Gender and Age
Group, Police-Attended Crashes
Speed a Factor in Crash
Yes
No
Unknown
Total
Gender/Age Group
n
Row %
n
Row %
n
Row %
n
Row %
Male
0 - 11
0
N/A
0
N/A
0
N/A
0
N/A
12 - 16
2
100.0
0
0.0
0
0.0
2
100.0
17 - 24
17
43.6
10
25.6
12
30.8
39
100.0
25 - 29
6
42.9
3
21.4
5
35.7
14
100.0
30 - 39
9
24.3
6
16.2
22
59.5
37
100.0
40 - 49
3
13.0
8
34.8
12
52.2
23
100.0
50 - 59
9
40.9
6
27.3
7
31.8
22
100.0
60 and over
4
13.8
7
24.1
18
62.1
29
100.0
Unknown age
0
0.0
0
0.0
1
100.0
1
100.0
Total Male
50
29.9
40
24.0
77
46.1
167
100.0
Female
0 – 11
0
N/A
0
N/A
0
N/A
0
N/A
12 – 16
1
50.0
1
50.0
0
0.0
2
100.0
17 – 24
4
25.0
7
43.8
5
31.3
16
100.0
25 – 29
0
N/A
0
N/A
0
N/A
0
N/A
30 – 39
1
16.7
0
0.0
5
83.3
6
100.0
40 – 49
1
14.3
2
28.6
4
57.1
7
100.0
50 – 59
0
0.0
2
40.0
3
60.0
5
100.0
60 and over
1
10.0
3
30.0
6
60.0
10
100.0
Total Female
8
17.4
15
32.6
23
50.0
46
100.0
Unknown Gender
0
0.0
0
0.0
6
100.0
6
100.0
Total Drivers/Riders in Fatal
Crashes
58
26.5
55
25.1
106
48.4
219
100.0

Reported Road Crashes in Western Australia 2011 51
Table 62 Drivers/Riders Involved in Hospitalisation Crashes by Speed a Factor by Gender
and Age Group, Police-Attended Crashes
Speed a Factor in Crash
Yes
No
Unknown
Total
Gender/Age Group
n
Row %
n
Row %
n
Row %
n
Row %
Male
0 - 11
0
N/A
0
N/A
0
N/A
0
N/A
12 - 16
5
29.4
4
23.5
8
47.1
17
100.0
17 - 24
67
16.2
135
32.6
212
51.2
414
100.0
25 - 29
36
16.5
67
30.7
115
52.8
218
100.0
30 - 39
49
15.7
89
28.4
175
55.9
313
100.0
40 - 49
26
8.1
124
38.8
170
53.1
320
100.0
50 - 59
18
7.9
80
35.2
129
56.8
227
100.0
60 and over
19
8.2
82
35.5
130
56.3
231
100.0
Unknown age
5
11.1
10
22.2
30
66.7
45
100.0
Total Male
225
12.6
591
33.1
969
54.3
1,785
100.0
Female
0 - 11
0
N/A
0
N/A
0
N/A
0
N/A
12 - 16
1
16.7
1
16.7
4
66.7
6
100.0
17 - 24
21
8.9
90
38.0
126
53.2
237
100.0
25 - 29
11
10.4
44
41.5
51
48.1
106
100.0
30 - 39
11
7.3
58
38.7
81
54.0
150
100.0
40 - 49
10
5.9
59
34.9
100
59.2
169
100.0
50 - 59
9
8.3
39
35.8
61
56.0
109
100.0
60 and over
5
4.6
36
33.3
67
62.0
108
100.0
Unknown age
2
10.0
7
35.0
11
55.0
20
100.0
Total Female
70
7.7
334
36.9
501
55.4
905
100.0
Unknown Gender
7
11.1
10
15.9
46
73.0
63
100.0
Total Drivers/Riders in
Hospitalisation Crashes
302
11.0
935
34.0
1,516
55.1
2,753
100.0

Reported Road Crashes in Western Australia 2011 52
Table 63 Persons Killed or Seriously Injured by Speed a Factor by Gender and Age Group,
Police-Attended Crashes
Speed a Factor in Crash
Yes
No
Unknown
Total
Gender/Age Group
n
Row %
n
Row %
n
Row %
n
Row %
Male
0 - 11
2
6.5
10
32.3
19
61.3
31
100.0
12 - 16
13
24.1
10
18.5
31
57.4
54
100.0
17 - 24
66
21.3
92
29.7
152
49.0
310
100.0
25 - 29
38
24.8
46
30.1
69
45.1
153
100.0
30 - 39
50
21.9
58
25.4
120
52.6
228
100.0
40 - 49
19
9.4
77
38.1
106
52.5
202
100.0
50 - 59
16
10.6
54
35.8
81
53.6
151
100.0
60 and over
11
7.0
53
33.8
93
59.2
157
100.0
Unknown age
5
16.1
6
19.4
20
64.5
31
100.0
Total Male
220
16.7
406
30.8
691
52.5
1,317
100.0
Female
0 - 11
1
4.3
9
39.1
13
56.5
23
100.0
12 - 16
6
20.7
8
27.6
15
51.7
29
100.0
17 - 24
21
11.5
72
39.6
89
48.9
182
100.0
25 - 29
9
10.6
33
38.8
43
50.6
85
100.0
30 - 39
6
6.1
43
43.9
49
50.0
98
100.0
40 - 49
7
6.2
41
36.3
65
57.5
113
100.0
50 - 59
4
5.1
29
36.7
46
58.2
79
100.0
60 and over
5
4.2
39
32.5
76
63.3
120
100.0
Unknown age
1
2.6
19
48.7
19
48.7
39
100.0
Total Female
60
7.8
293
38.2
415
54.0
768
100.0
Unknown Gender
54
21.0
92
35.8
111
43.2
257
100.0
Total Persons KSI
334
14.3
791
33.8
1,217
52.0
2,342
100.0
Table 64 Fatalities by Road User Type by Speed a Factor, Police-Attended Crashes
Speed a Factor in Crash
Yes
No
Unknown
Total
Road User Type
n
Row %
n
Row %
n
Row %
n
Row %
Driver
24
28.6
21
25.0
39
46.4
84
100.0
Passenger
7
18.9
11
29.7
19
51.4
37
100.0
Motorcyclist
14
56.0
4
16.0
7
28.0
25
100.0
Bicyclist
0
0.0
2
66.7
1
33.3
3
100.0
Pedestrian
2
8.3
9
37.5
13
54.2
24
100.0
Total Fatalities
47
27.2
47
27.2
79
45.7
173
100.0

Reported Road Crashes in Western Australia 2011 53
Table 65 Fatal Crashes by Speed a Factor by Crash Nature, Police-Attended Crashes -
Metropolitan
Speed a Factor in Crash
Yes
No
Unknown
Total
Crash Nature
n
n
n
n
Multi-Vehicle Crashes
Rear End
2
0
1
3
Head On
4
2
5
11
Sideswipe Same Dir.
1
0
2
3
Right Angle
3
3
1
7
Right Turn Through
1
2
3
6
Other/ Unknown
2
0
2
4
Total Multi Vehicle
13
7
14
34
Single-Vehicle Crashes
Hit Pedestrian
1
3
6
10
Hit Animal
0
0
0
0
Hit Object
8
1
9
18
Non Collision
1
2
0
3
Other/ Unknown
0
0
1
1
Total Single Vehicle
10
6
16
32
Total Fatal Crashes
23
13
30
66
Table 66 Fatal Crashes by Speed a Factor by Crash Nature, Police-Attended Crashes -
Regional
Speed a Factor in Crash
Yes
No
Unknown
Total
Crash Nature
n
n
n
n
Multi-Vehicle Crashes
Rear End
0
0
1
1
Head On
0
2
4
6
Sideswipe Same Dir.
0
1
1
2
Right Angle
0
0
2
2
Right Turn Through
0
0
0
0
Other/ Unknown
0
1
3
4
Total Multi Vehicle
0
4
11
15
Single-Vehicle Crashes
Hit Pedestrian
0
4
1
5
Hit Animal
0
0
0
0
Hit Object
11
8
12
31
Non Collision
0
1
2
3
Other/ Unknown
0
1
2
3
Total Single Vehicle
11
14
17
42
Total Fatal Crashes
11
18
28
57

Reported Road Crashes in Western Australia 2011 54
Table 67 Fatal Crashes by Speed a Factor by Crash Nature, Police-Attended Crashes -
Remote
Speed a Factor in Crash
Yes
No
Unknown
Total
Crash Nature
n
n
n
n
Multi-Vehicle Crashes
Rear End
0
0
0
0
Head On
0
1
1
2
Sideswipe Same Dir.
0
0
0
0
Right Angle
0
1
0
1
Right Turn Through
0
0
0
0
Other/ Unknown
1
0
1
2
Total Multi Vehicle
1
2
2
5
Single-Vehicle Crashes
Hit Pedestrian
0
1
3
4
Hit Animal
0
1
0
1
Hit Object
5
0
5
10
Non Collision
4
8
5
17
Other/ Unknown
0
0
1
1
Total Single Vehicle
9
10
14
33
Total Fatal Crashes
10
12
16
38
Table 68 Fatal Crashes by Speed a Factor by Speed Zone, Police-Attended Crashes
Speed a Factor in Crash
Yes
No
Unknown
Total
Speed Zone
n
Col %
n
Col %
n
Col %
n
Col %
<50
0
0.0
1
2.3
0
0.0
1
0.6
50
7
15.9
5
11.6
7
9.5
19
11.8
60
9
20.5
2
4.7
11
14.9
22
13.7
70
6
13.6
3
7.0
7
9.5
16
9.9
80
3
6.8
3
7.0
5
6.8
11
6.8
90
1
2.3
2
4.7
1
1.4
4
2.5
100
2
4.5
4
9.3
8
10.8
14
8.7
110
16
36.4
21
48.8
34
45.9
71
44.1
Unknown
0
0.0
2
4.7
1
1.4
3
1.9
Total Fatal Crashes
44
100.0
43
100.0
74
100.0
161
100.0

Reported Road Crashes in Western Australia 2011 55
Table 69 Hospitalisation Crashes by Speed a Factor by Speed Zone, Police-Attended
Crashes
Speed a Factor in Crash
Yes
No
Unknown
Total
Speed Zone
n
Col %
n
Col %
n
Col %
n
Col %
<50
1
0.5
9
1.5
15
1.6
25
1.4
50
68
32.9
112
19.1
198
21.0
378
21.8
60
49
23.7
163
27.9
266
28.2
478
27.6
70
27
13.0
69
11.8
145
15.4
241
13.9
80
15
7.2
49
8.4
99
10.5
163
9.4
90
3
1.4
26
4.4
22
2.3
51
2.9
100
12
5.8
27
4.6
58
6.2
97
5.6
110
26
12.6
119
20.3
112
11.9
257
14.8
State Default
2
1.0
5
0.9
14
1.5
21
1.2
Unknown
4
1.9
6
1.0
14
1.5
24
1.4
Total Hospitalisation
Crashes
207
100.0
585
100.0
943
100.0
1,735
100.0

Reported Road Crashes in Western Australia 2011 56
4.1.2 Alcohol
This section focuses on the involvement of alcohol in road crashes. The legal blood alcohol
concentration (BAC) limit for drivers holding an ordinary licence in Western Australia is
0.05 g/100mL. Therefore, in this report crashes that involved a driver/rider with a BAC of
0.05 g/100mL or above are referred to as ‘alcohol-related crashes’. As a driver’s or rider’s BAC is
usually determined by a breath or blood test in the presence of a police officer, only
police-attended crashes are included in this section. In 2011, there were 271 hospitalisation
crashes and two fatal crashes that were not police attended and are, therefore, not included in this
section.
Since alcohol involvement in crashes is based on the BAC of all drivers and motorcycle riders
(referred to as drivers/riders) involved in the crash, crashes that did not involve a driver or rider
were excluded from the tables and figures presented in this section. Such crashes include
collisions between bicycles and pedestrians or where a parked vehicle rolls away and hits another
vehicle or road user. With this restriction a further 14 police-attended crashes were excluded from
this section, for a total of 9,563 police-attended crashes that involved a driver/rider.
Table 70 Highest Driver/Rider BAC in Crash by Crash Severity, Police-Attended Crashes
Highest Driver/Rider
BAC in Crash (g/100mL)
Crash Severity
Fatal
Hospitalisation
Total Serious
Other
Total
n
Col %
n
Col %
n
Col %
n
Col %
n
Col %
Nil
100
62.9
1,153
66.6
1,253
66.3
4,452
58.0
5,705
59.7
> 0 to < 0.05
11
6.9
35
2.0
46
2.4
139
1.8
185
1.9
0.05 to < 0.08
5
3.1
35
2.0
40
2.1
127
1.7
167
1.7
0.08 to < 0.15
11
6.9
79
4.6
90
4.8
378
4.9
468
4.9
0.15
19
11.9
37
2.1
56
3.0
201
2.6
257
2.7
Subtotal 0.05
35
22.0
151
8.7
186
9.8
706
9.2
892
9.3
Unknown
13
8.2
392
22.6
405
21.4
2,376
31.0
2,781
29.1
Total Crashes
1
159
100.0
1,731
100.0
1,890
100.0
7,673
100.0
9,563
100.0
1. Excludes police-attended crashes that did not involve a driver/rider (n=14).

Reported Road Crashes in Western Australia 2011 57
Figure 16 Fatal Crashes by Highest Driver/Rider BAC in Crash by Year, Police-Attended
Crashes
Table 71 Fatal Crashes by Highest Driver/Rider BAC in Crash by Year, Police-Attended
Crashes
Highest Driver/Rider BAC
in Crash (g/100mL)
Year
2006
2007
2008
2009
2010
2011
2011 Change
from 2010
1
n
n
n
n
n
n
%
Nil
96
111
105
92
104
100
-3.8
> 0 to < 0.05
14
7
10
6
4
11
N/R
0.05 to < 0.08
4
15
4
5
5
5
N/R
0.08 to < 0.15
12
19
17
22
10
11
10.0
0.15
31
44
32
28
36
19
-47.2
Sub-total 0.05
47
78
53
55
51
35
-31.4
Unknown
25
16
17
21
15
15
N/R
Total Fatal Crashes
182
212
185
174
174
161
-7.5
1. 2011 change from 2010 not reported for crashes with unknown BAC, or for BAC categories with fewer than ten
crashes.
Reported Road Crashes in Western Australia 2011 58
Table 72 Serious Crashes by Highest Driver/Rider BAC by ARIA Category, Police-Attended
Crashes
Highest
Driver/Rider BAC
in Crash
ARIA Category
Highly
Accessible
Accessible
Moderately
Accessible
Remote
Very Remote
Total
n
Col %
n
Col %
n
Col %
n
Col %
n
Col %
n
Col %
Nil
868
67.0
151
67.7
123
66.8
76
62.8
35
53.0
1,253
66.3
> 0 to < 0.05
37
2.9
2
0.9
3
1.6
3
2.5
1
1.5
46
2.4
0.05 to < 0.08
28
2.2
1
0.4
3
1.6
6
5.0
2
3.0
40
2.1
0.08 to < 0.15
53
4.1
16
7.2
9
4.9
8
6.6
4
6.1
90
4.8
0.15
31
2.4
10
4.5
6
3.3
4
3.3
5
7.6
56
3.0
Sub-total 0.05
112
8.6
27
12.1
18
9.8
18
14.9
11
16.7
186
9.8
Unknown
279
21.5
43
19.3
40
21.7
24
19.8
19
28.8
405
21.4
Total Serious
Crashes
1
1,296
100.0
223
100.0
184
100.0
121
100.0
66
100.0
1,890
100.0
1. Excludes police-attended crashes that did not involve a driver/rider (n=6).
Table 73 Drivers/Riders Involved in Fatal Crashes by Driver/Rider BAC by Gender and Age
Group, Police-Attended Crashes
Driver/Rider BAC (g/100mL)
Nil
<0.05
0.05 to
<0.08
0.08 to
<0.15
0.15
Subtotal
0.05
Unknown
Total
Gender/Age Group
n
n
n
n
n
n
n
n
Male
0 - 11
0
0
0
0
0
0
0
0
12 - 16
1
0
0
0
0
0
1
2
17 - 24
19
6
2
4
1
7
7
39
25 - 29
9
1
0
0
3
3
1
14
30 - 39
20
1
1
2
8
11
5
37
40 - 49
17
1
0
1
3
4
1
23
50 - 59
12
2
1
1
2
4
4
22
60 and over
23
0
1
1
0
2
4
29
Unknown Age
0
0
0
0
0
0
1
1
Total Male
101
11
5
9
17
31
24
167
Female
0 - 11
0
0
0
0
0
0
0
0
12 - 16
1
0
0
0
0
0
1
2
17 - 24
12
0
0
1
2
3
1
16
25 - 29
0
0
0
0
0
0
0
0
30 - 39
4
0
0
1
0
1
1
6
40 - 49
6
1
0
0
0
0
0
7
50 - 59
3
0
0
0
0
0
2
5
60 and over
10
0
0
0
0
0
0
10
Total Female
36
1
0
2
2
4
5
46
Unknown Gender
0
0
0
0
0
0
6
6
Total Drivers/Riders
in Fatal Crashes
137
12
5
11
19
35
35
219

Reported Road Crashes in Western Australia 2011 59
Table 74 Drivers/Riders Involved in Hospitalisation Crashes by Driver/Rider BAC by Gender
and Age Group, Police-Attended Crashes
Driver/Rider BAC (g/100mL)
Nil
<0.05
0.05 to
<0.08
0.08 to
<0.15
0.15
Subtotal
0.05
Unknown
Total
Gender/Age Group
n
n
n
n
n
n
n
n
Male
0 - 11
0
0
0
0
0
0
0
0
12 - 16
13
0
0
0
0
0
4
17
17 - 24
241
11
10
20
11
41
121
414
25 - 29
120
6
9
13
8
30
62
218
30 - 39
180
3
7
15
7
29
101
313
40 - 49
212
3
2
6
1
9
96
320
50 - 59
157
3
0
4
5
9
58
227
60 and over
162
3
2
1
0
3
63
231
Unknown age
17
0
1
2
0
3
25
45
Total Male
1,102
29
31
61
32
124
530
1,785
Female
0 – 11
0
0
0
0
0
0
0
0
12 – 16
5
0
0
0
0
0
1
6
17 – 24
165
4
1
6
1
8
60
237
25 – 29
69
1
2
3
0
5
31
106
30 – 39
100
0
2
3
2
7
43
150
40 - 49
110
2
1
5
2
8
49
169
50 - 59
75
0
0
1
0
1
33
109
60 and over
79
0
0
0
0
0
29
108
Unknown age
8
0
0
0
0
0
12
20
Total Female
611
7
6
18
5
29
258
905
Unknown Gender
12
0
0
0
0
0
51
63
Total Drivers/Riders in
Hospitalisation Crashes
1,725
36
37
79
37
153
839
2,753

Reported Road Crashes in Western Australia 2011 60
Table 75 Persons Killed or Seriously Injured by Gender and Age Group by Highest
Driver/Rider BAC in Crash, Police-Attended Crashes
Highest Driver/Rider BAC in Crash (g/100mL)
Nil
<0.05
0.05 to
<0.08
0.08 to
<0.15
0.15
Subtotal
0.05
Unknown
Total
Gender/Age Group
n
n
n
n
n
n
n
n
Male
0 - 11
24
0
0
1
0
1
6
31
12 - 16
40
3
0
0
0
0
11
54
17 - 24
175
15
9
20
15
44
75
309
25 - 29
78
5
4
12
12
28
42
153
30 - 39
135
4
9
20
15
44
45
228
40 - 49
133
7
2
10
3
15
45
200
50 - 59
113
2
1
4
6
11
25
151
60 and over
119
1
3
5
1
9
27
156
Unknown age
18
2
1
1
0
2
9
31
Total Male
835
39
29
73
52
154
285
1,313
Female
0 - 11
18
1
0
0
1
1
3
23
12 - 16
19
1
1
4
0
5
4
29
17 - 24
118
4
2
10
4
16
43
181
25 - 29
59
4
0
4
0
4
18
85
30 - 39
67
1
1
7
4
12
18
98
40 - 49
77
3
1
5
2
8
25
113
50 - 59
61
1
0
2
1
3
14
79
60 and over
92
1
0
0
1
1
26
120
Unknown age
29
0
1
0
0
1
9
39
Total Female
540
16
6
32
13
51
160
767
Unknown Gender
166
10
14
26
8
48
32
256
Total Persons KSI
1
1,541
65
49
131
73
253
477
2,336
1. Excludes persons killed or seriously injured in crashes that did not involve a driver/rider (n=6).
Table 76 BAC of Pedestrian Fatalities by Area of Crash, Police-Attended
Pedestrian BAC (g/100mL)
Nil
<0.05
0.05 to
<0.08
0.08 to
<0.15
0.15
Subtotal
0.05
Unknown
Total
Area
n
n
n
n
n
n
n
n
Metropolitan
0
0
1
0
0
1
11
12
Regional
0
0
0
0
3
3
5
8
Remote
0
0
0
0
3
3
1
4
Total Pedestrian
Fatalities
0
0
1
0
6
7
17
24

Reported Road Crashes in Western Australia 2011 61
4.1.3 Illegal Drugs
Data regarding the number of road crash fatalities with drugs detected in their system was
provided by the Forensic Science Laboratory of the Chemistry Centre of Western Australia. The
drugs tested for included prescription drugs, illegal drugs and alcohol. Data was also provided for
persons for whom no drugs (prescription or illegal) or alcohol were detected. It should be noted
that the testing only detects the presence of a drug, and it cannot be determined from these results
whether the person killed was under the influence of the detected drug(s) at the time of the crash.
The data supplied by the Chemistry Centre of Western Australia may also include data for fatalities
that were out of scope, such as those killed in off-road crashes. Therefore, the data supplied by
the Chemistry Centre was matched to the crash data. The matching process was not exact as
some of the fields used in the matching process did not record similar data in the same way. For
example, the location of the crash site is recorded in the crash data, however, the drug data
records the place of death, which in some cases was a specific hospital, potentially hundreds of
kilometres and several days after the crash event.
This process resulted in 161 of 175 fatalities from the crash data being matched to a record within
the drug dataset. There were also 31 records from the drug data that were unable to be matched
to records in the crash data. Of these 31 fatalities, one had cannabis detected in their system, and
two had both alcohol and cannabis in their systems. The remaining 28 did not have any illegal
drugs detected in their systems. It is likely that many of the 14 fatalities who could not be matched
to the drug data did not have illegal drugs in their system, but it is likely that some did. All tables in
this section include only the 161 crash fatalities who were matched to the drug data.
Table 77 Fatalities by Drug Use and Gender
Gender
Male
Female
Total Fatalities
Drugs Detected
n
N
n
Amphetamines only
1
1
2
Cannabis only
5
1
6
Amphetamines and Cannabis only
0
0
0
Amphetamines and Alcohol only
1
0
1
Cannabis and Alcohol only
18
0
18
Amphetamines, Cannabis and Alcohol only
1
0
1
Other (other illegal drugs & combinations)
1
0
0
0
Total with Drugs Detected
26
2
28
None
91
42
133
Total Fatalities
117
44
161
Source: Forensic Science Laboratory, Chemistry Centre of Western Australia.
1. Other includes cocaine and heroin only.

Reported Road Crashes in Western Australia 2011 62
Table 78 Fatalities by Drug Use and Age Group
Age Group
0-16
17-24
25-59
60 and
over
Total
Fatalities
Drugs Detected
n
n
n
n
n
Amphetamines only
1
1
0
0
2
Cannabis only
0
3
3
0
6
Amphetamines and Cannabis only
0
0
0
0
0
Amphetamines and Alcohol only
0
0
1
0
1
Cannabis and Alcohol only
0
10
8
0
18
Amphetamines, Cannabis and Alcohol only
0
1
0
0
1
Other (other illegal drugs & combinations)
1
0
0
0
0
0
Total with Drugs Detected
1
15
12
0
28
None
8
27
64
34
133
Total Fatalities
9
42
76
34
161
Source: Forensic Science Laboratory, Chemistry Centre of Western Australia.
1. Other includes cocaine and heroin only.
Table 79 Fatalities by Drug Use and Road User Type
Road User Type
Driver
Passenger
Motorcyclist
Bicyclist
Pedestrian
Other/
Unknown
Total
Fatalities
Drugs Detected
n
n
n
n
n
n
n
Amphetamines only
2
0
0
0
0
0
2
Cannabis only
1
2
0
1
2
0
6
Amphetamines and Cannabis
only
0
0
0
0
0
0
0
Amphetamines and Alcohol
only
1
0
0
0
0
0
1
Cannabis and Alcohol only
5
4
5
1
3
0
18
Amphetamines, Cannabis and
Alcohol only
1
0
0
0
0
0
1
Other (other illegal drugs &
combinations)
1
0
0
0
0
0
0
0
Total with Drugs Detected
10
6
5
2
5
0
28
None
68
27
18
1
19
0
133
Total Fatalities
78
33
23
3
24
0
161
Source: Forensic Science Laboratory, Chemistry Centre of Western Australia.
1. Other includes cocaine and heroin only.

Reported Road Crashes in Western Australia 2011 63
Table 80 Fatalities by Drug Use and Day of Week
Day Of Week
Monday
Tuesday
Wednesday
Thursday
Friday
Saturday
Sunday
Total
Fatalities
Drugs Detected
n
n
n
n
n
n
n
n
Amphetamines only
0
0
1
1
0
0
0
2
Cannabis only
1
2
2
0
0
1
0
6
Amphetamines and Cannabis
only
0
0
0
0
0
0
0
0
Amphetamines and Alcohol
only
0
0
0
0
0
0
1
1
Cannabis and Alcohol only
1
2
1
0
6
2
6
18
Amphetamines, Cannabis and
Alcohol only
0
0
0
0
0
1
0
1
Other (other illegal drugs &
combinations)
1
0
0
0
0
0
0
0
0
Total with Drugs Detected
2
4
4
1
6
4
7
28
None
14
19
12
22
25
24
17
133
Total Fatalities
16
23
16
23
31
28
24
161
Source: Forensic Science Laboratory, Chemistry Centre of Western Australia.
1. Other includes cocaine and heroin only

Reported Road Crashes in Western Australia 2011 64
4.1.4 Seat Belts
The use of seat belts is only reported for occupants of motor vehicles that are likely to have seat
belts fitted. Therefore, the term ‘motor vehicle occupants’ excludes occupants of non-motorised
vehicles, motorcyclists, motorcycle passengers, occupants of tractors and occupants of vehicles
that are normally towed (trailers, caravans, campers etc.).
As seat belt usage is more reliably recorded for police-attended crashes this section will focus on
police-attended crashes. However, tables and figures covering multiple years will use data from all
fatal crashes, as in some years police were not able to attend all fatal crashes. In 2011, all but two
fatal crashes were attended by police.
Figure 17 Motor Vehicle Occupant Fatalities Where Seat Belts Were Not Worn by Year
Table 81 Motor Vehicle Occupant Fatalities by Seat Belt Usage by Year
Year
2006
2007
2008
2009
2010
2011
2011 Change
from 2010
1
Seat Belt Usage
n
n
n
n
n
n
%
Worn
91
86
82
75
84
72
-14.3
Not Worn
42
58
42
37
33
32
-3.0
Unknown
12
32
21
21
19
19
N/R
Total Motor Vehicle
Occupant Fatalities
145
176
145
133
136
123
-9.6
1. 2011 change from 2010 not reported for fatalities whose seat belt usage was unknown.

Reported Road Crashes in Western Australia 2011 65
Table 82 Motor Vehicle Occupants Killed or Seriously Injured by Seat Belt Usage by ARIA
Category, Police-Attended Crashes
Seat Belt Usage
Worn
Not Worn
Unknown
Total
ARIA Category
n
Row %
n
Row %
n
Row %
N
Row %
Highly Accessible
911
85.9
41
3.9
109
10.2
1,061
100.0
Accessible
175
78.1
18
8.0
31
13.8
224
100.0
Moderately Accessible
130
74.7
22
12.7
22
12.7
174
100.0
Remote
107
76.4
16
11.4
17
12.1
140
100.0
Very Remote
63
65.6
22
22.9
11
11.5
96
100.0
Total Motor Vehicle
Occupants KSI
1,386
81.8
119
7.0
190
11.2
1,695
100.0
Table 83 Motor Vehicle Occupant Fatalities by Seat Belt Usage by Gender and Age Group,
Police-Attended Crashes
Seat Belt Usage
Worn
Not Worn
Unknown
Total
Gender/Age Group
n
Row %
n
Row %
n
Row %
n
Row %
Male
0 - 11
1
25.0
2
50.0
1
25.0
4
100.0
12 - 16
1
33.3
0
0.0
2
66.7
3
100.0
17 - 24
14
66.7
3
14.3
4
19.0
21
100.0
25 - 29
3
30.0
5
50.0
2
20.0
10
100.0
30 - 39
6
40.0
7
46.7
2
13.3
15
100.0
40 - 49
4
44.4
2
22.2
3
33.3
9
100.0
50 - 59
3
50.0
3
50.0
0
0.0
6
100.0
60 and over
13
72.2
4
22.2
1
5.6
18
100.0
Total Male
45
52.3
26
30.2
15
17.4
86
100.0
Female
0 - 11
1
100.0
0
0.0
0
0.0
1
100.0
12 - 16
0
N/A
0
N/A
0
N/A
0
N/A
17 - 24
6
60.0
3
30.0
1
10.0
10
100.0
25 - 29
1
100.0
0
0.0
0
0.0
1
100.0
30 - 39
2
33.3
2
33.3
2
33.3
6
100.0
40 - 49
4
80.0
1
20.0
0
0.0
5
100.0
50 - 59
0
N/A
0
N/A
0
N/A
0
N/A
60 and over
12
100.0
0
0.0
0
0.0
12
100.0
Total Female
26
74.3
6
17.1
3
8.6
35
100.0
Total Unknown Gender
0
0.0
0
0.0
0
0.0
0
0.0
Total Motor Vehicle
Occupant Fatalities
71
58.7
32
26.4
18
14.9
121
100.0

Reported Road Crashes in Western Australia 2011 66
Table 84 Motor Vehicle Occupants Seriously Injured by Seat Belt Usage by Gender and Age
Group, Police-Attended Crashes
Seat Belt Usage
Worn
Not Worn
Unknown
Total
Gender/Age Group
n
Row %
n
Row %
n
Row %
n
Row %
Male
0 - 11
9
75.0
2
16.7
1
8.3
12
100.0
12 - 16
7
43.8
6
37.5
3
18.8
16
100.0
17 - 24
150
78.5
18
9.4
23
12.0
191
100.0
25 - 29
75
83.1
5
5.6
10
11.2
90
100.0
30 - 39
95
77.2
9
7.3
19
15.4
123
100.0
40 - 49
73
76.6
5
5.3
18
18.1
96
100.0
50 - 59
74
89.0
2
2.4
7
8.5
83
100.0
60 and over
89
90.8
1
1.0
8
8.2
98
100.0
Unknown age
15
71.4
2
9.5
4
19.0
21
100.0
Total Male
587
80.4
50
6.9
93
12.7
730
100.0
Female
0 - 11
8
57.1
4
28.6
2
14.3
14
100.0
12 - 16
8
61.5
4
30.8
1
7.7
13
100.0
17 - 24
140
88.6
8
5.1
10
6.3
158
100.0
25 - 29
51
89.5
2
3.5
4
7.0
57
100.0
30 - 39
66
88.0
0
0.0
9
12.0
75
100.0
40 - 49
84
93.3
2
2.2
4
4.4
90
100.0
50 - 59
59
89.4
1
1.5
6
9.1
66
100.0
60 and over
86
93.5
0
0.0
6
6.5
92
100.0
Unknown age
34
89.5
0
0.0
4
10.5
38
100.0
Total Female
536
88.9
21
3.5
46
7.6
603
100.0
Unknown Gender
192
79.7
16
6.6
33
13.7
241
100.0
Total Motor Vehicle
Occupants Seriously
Injured
1,315
83.6
87
5.5
172
10.9
1,574
100.0
Table 85 Seat Belt Usage by Motor Vehicle Occupant Type and Injury Severity,
Police-Attended Crashes - State
Seat Belt Usage by Occupant Type
Injury Severity
Fatal
Serious
Total Persons KSI
n
Col %
n
Col %
n
Col %
Driver
Worn
56
66.7
933
86.1
989
84.7
Not Worn
19
22.6
44
4.1
63
5.4
Unknown
9
10.7
106
9.8
115
9.9
Total Drivers
84
100.0
1,083
100.0
1,167
100.0
Passenger
Worn
15
40.5
382
77.8
397
75.2
Not Worn
13
35.1
43
8.8
56
10.6
Unknown
9
24.3
66
13.4
75
14.2
Total Passengers
37
100.0
491
100.0
528
100.0
Total Motor Vehicle Occupants
121
-
1,574
-
1,695
-

Reported Road Crashes in Western Australia 2011 67
Table 86 Seat Belt Usage by Motor Vehicle Occupant Type and Injury Severity,
Police-Attended Crashes - Metropolitan
Seat Belt Usage by Occupant Type
Injury Severity
Fatal
Serious
Total Persons KSI
n
Col %
n
Col %
n
Col %
Driver
Worn
22
73.3
626
88.3
648
87.8
Not Worn
5
16.7
19
2.7
24
3.3
Unknown
3
10.0
64
9.0
67
9.0
Total Drivers
30
100.0
709
100.0
739
100.0
Passenger
Worn
6
60.0
218
82.3
224
81.5
Not Worn
1
10.0
14
5.3
15
5.5
Unknown
3
30.0
33
12.5
36
13.1
Total Passengers
10
100.0
265
100.0
275
100.0
Total Motor Vehicle Occupants
40
-
974
-
1,014
-
Table 87 Seat Belt Usage by Motor Vehicle Occupant Type and Injury Severity,
Police-Attended Crashes - Regional
Seat Belt Usage by Occupant Type
Injury Severity
Fatal
Serious
Total Persons KSI
n
Col %
n
Col %
n
Col %
Driver
Worn
25
65.8
193
83.1
218
80.7
Not Worn
9
23.7
13
5.6
22
8.2
Unknown
4
10.5
26
11.3
30
11.2
Total Drivers
38
100.0
231
100.0
270
100.0
Passenger
Worn
3
42.9
100
77.5
103
75.7
Not Worn
2
28.6
9
7.0
11
8.1
Unknown
2
28.6
20
15.5
22
16.2
Total Passengers
7
100.0
129
100.0
136
100.0
Total Motor Vehicle Occupants
45
-
361
-
406
-

Reported Road Crashes in Western Australia 2011 68
Table 88 Seat Belt Usage by Motor Vehicle Occupant Type and Injury Severity,
Police-Attended Crashes - Remote
Seat Belt Usage by Occupant Type
Injury Severity
Fatal
Serious
Total Persons KSI
n
Col %
n
Col %
n
Col %
Driver
Worn
9
56.3
114
80.3
123
77.8
Not Worn
5
31.3
12
8.5
17
10.8
Unknown
2
12.5
16
11.3
18
11.4
Total Drivers
16
100.0
142
100.0
158
100.0
Passenger
Worn
6
30.0
64
66.0
70
59.8
Not Worn
10
50.0
20
20.6
30
25.6
Unknown
4
20.0
13
13.4
17
14.5
Total Passengers
20
100.0
97
100.0
117
100.0
Total Motor Vehicle Occupants
36
-
239
-
275
-

Reported Road Crashes in Western Australia 2011 69
4.1.5 Helmets
This section deals with helmet use of motorcyclists and bicyclists killed and seriously injured in
crashes reported to police. All tables in this section are restricted to police-attended crashes only.
Table 89 Helmet Usage by Injury Severity, Police-Attended Crashes - State
Helmet Usage
Worn
Not Worn
Unknown
Total
Road User
n
n
n
n
Motorcyclists
Fatal
24
1
0
25
Serious
298
21
21
340
Total Motorcyclists
322
22
21
365
Bicyclists
Fatal
1
2
0
3
Serious
55
17
10
82
Total Bicyclists
56
19
10
85
Total Motorcyclists and Bicyclists
378
41
31
450
Table 90 Helmet Usage by Injury Severity, Police-Attended Crashes - Metropolitan
Helmet Usage
Worn
Not Worn
Unknown
Total
Road User
n
n
n
n
Motorcyclists
Fatal
14
1
0
15
Serious
209
14
18
241
Total Motorcyclists
223
15
18
256
Bicyclists
Fatal
1
2
0
3
Serious
50
15
9
74
Total Bicyclists
51
17
9
77
Total Motorcyclists and Bicyclists
274
32
27
333

Reported Road Crashes in Western Australia 2011 70
Table 91 Helmet Usage by Injury Severity, Police-Attended Crashes - Regional
Helmet Usage
Worn
Not Worn
Unknown
Total
Road User
n
n
n
n
Motorcyclists
Fatal
7
0
0
7
Serious
66
5
1
72
Total Motorcyclists
73
5
1
79
Bicyclists
Fatal
0
0
0
0
Serious
4
2
0
6
Total Bicyclists
4
2
0
6
Total Motorcyclists and Bicyclists
77
7
1
85
Table 92 Helmet Usage by Injury Severity, Police-Attended Crashes - Remote
Helmet Usage
Worn
Not Worn
Unknown
Total
Road User
n
n
n
n
Motorcyclists
Fatal
3
0
0
3
Serious
23
2
2
27
Total Motorcyclists
26
2
2
30
Bicyclists
Fatal
0
0
0
0
Serious
1
0
1
2
Total Bicyclists
1
0
1
2
Total Motorcyclists and Bicyclists
27
2
3
32
Table 93 Motorcyclist Fatalities by Helmet Usage by Age Group, Police-Attended Crashes
Helmet Usage
Worn
Not Worn
Total
Age
n
n
n
0 - 11
0
0
0
12 - 16
1
0
1
17 - 24
7
0
7
25 - 39
5
1
6
40 - 59
9
0
9
60 and over
2
0
2
Total Motorcyclists
24
1
25

Reported Road Crashes in Western Australia 2011 71
4.2 Safe Roads and Roadsides
4.2.1 Road Factors
Information on various road factors and environmental conditions are provided in this section.
Levels of exposure to different road and environmental condition will vary, and this should be
considered when interpreting these figures.
Table 94 Road Factors by Crash Severity
Crash Severity
Fatal
Hospitalisation
Total Serious
Other
Total
Road Factor
n
Col %
n
Col %
n
Col %
n
Col %
n
Col %
Road Classification
Highway
69
42.3
689
34.3
758
34.9
13,575
36.4
14,333
36.3
Main Road
17
10.4
103
5.1
120
5.5
640
1.7
760
1.9
Other
77
47.2
1,214
60.5
1,291
59.5
23,073
61.9
24,364
61.7
Road Surface
Sealed
145
89.0
1,932
96.3
2,077
95.8
36,378
97.6
38,455
97.5
Unsealed
18
11.0
60
3.0
78
3.6
682
1.8
760
1.9
Unknown
0
0.0
14
0.7
14
0.6
228
0.6
242
0.6
Road Alignment
Curve
45
27.6
422
21.0
467
21.5
6,653
17.8
7,120
18.0
Straight
118
72.4
1,535
76.5
1,653
76.2
28,747
77.1
30,400
77.0
Unknown
0
0.0
49
2.4
49
2.3
1,888
5.1
1,937
4.9
Road Gradient
Level
106
65.0
1,508
75.2
1,614
74.4
29,071
78.0
30,685
77.8
Crest of Hill
1
0.6
33
1.6
34
1.6
603
1.6
637
1.6
Slope
56
34.4
396
19.7
452
20.8
5,692
15.3
6,144
15.6
Unknown
0
0.0
69
3.4
69
3.2
1,922
5.2
1,991
5.0
Road Conditions
Wet
12
7.4
275
13.7
287
13.2
6,225
16.7
6,512
16.5
Dry
151
92.6
1,711
85.3
1,862
85.8
30,416
81.6
32,278
81.8
Unknown
0
0.0
20
1.0
20
0.9
647
1.7
667
1.7
Light
Daylight
91
55.8
1,293
64.5
1,384
63.8
27,164
72.8
28,548
72.4
Dawn or Dusk
3
1.8
70
3.5
73
3.4
2,023
5.4
2,096
5.3
Night
Street Lights On
26
16.0
440
21.9
466
21.5
5,690
15.3
6,156
15.6
Street Lights Off
4
2.5
20
1.0
24
1.1
231
0.6
255
0.6
No Street Lights
37
22.7
145
7.2
182
8.4
1,042
2.8
1,224
3.1
Subtotal Night
67
41.1
605
30.2
672
31.0
6,963
18.7
7,635
19.4
Unknown
2
1.2
38
1.9
40
1.8
1,138
3.1
1,178
3.0
Total Crashes
163
100.0
2,006
100.0
2,169
100.0
37,288
100.0
39,457
100.0

Reported Road Crashes in Western Australia 2011 72
4.2.2 Crash Nature
The crash nature describes the type of crash in terms of the initial collision, regardless of
subsequent collisions with other vehicles and/or road users. For example, if the front of one
vehicle squarely strikes the side of another vehicle and pushes it off the road where it hits a
pedestrian, the crash nature would be considered a “Right Angle” crash. Or, if a vehicle hits a
pedestrian who is crossing the road and the first vehicle is then hit from behind by a second
vehicle, the crash would be classified as a “Hit Pedestrian” crash. The categories of crash nature
included in this report have been aggregated based on the most commonly occurring categories.
Figure 18 Crash Nature by Crash Severity

Reported Road Crashes in Western Australia 2011 73
Table 95 Fatal Crashes by Crash Nature and Area of Crash
Area of Crash
Metropolitan
Regional
Remote
Western Australia
Crash Nature
n
Col %
n
Col %
n
Col %
n
Col %
Multi-Vehicle Crashes
Rear End
3
4.4
1
1.8
0
0.0
4
2.5
Head On
12
17.6
6
10.5
2
5.3
20
12.3
Sideswipe Same Dir.
3
4.4
2
3.5
0
0.0
5
3.1
Right Angle
8
11.8
2
3.5
1
2.6
11
6.7
Right Turn Through
6
8.8
0
0.0
0
0.0
6
3.7
Other/ Unknown
4
5.9
4
7.0
2
5.3
10
6.1
Total Multi Vehicle
36
52.9
15
26.3
5
13.2
56
34.4
Single-Vehicle Crashes
Hit Pedestrian
10
14.7
5
8.8
4
10.5
19
11.7
Hit Animal
0
0.0
0
0.0
1
2.6
1
0.6
Hit Object
18
26.5
31
54.4
10
26.3
59
36.2
Non Collision
3
4.4
3
5.3
17
44.7
23
14.1
Other/ Unknown
1
1.5
3
5.3
1
2.6
5
3.1
Total Single Vehicle
32
47.1
42
73.7
33
86.8
107
65.6
Total Fatal Crashes
68
100.0
57
100.0
38
100.0
163
100.0
Table 96 Fatal Crashes by High Priority Crash Type and Area of Crash
Area of Crash
Metropolitan
Regional
Remote
Western Australia
Crash Type
n
Col %
n
Col %
n
Col %
n
Col %
Intersection
18
26.5
6
10.5
3
7.9
27
16.6
Run Off Road
21
30.9
34
59.6
26
68.4
81
49.7
Head On
12
17.6
6
10.5
2
5.3
20
12.3
Other
21
30.9
11
19.3
7
18.4
39
23.9
Total Fatal Crashes
68
100.0
57
100.0
38
100.0
163
100.0
Note: High Priority Crash Types are not mutually exclusive and therefore some crashes may be counted more than once
and percentages will sum to greater than 100%.

Reported Road Crashes in Western Australia 2011 74
Table 97 Hospitalisation Crashes by Crash Nature and Area of Crash
Area of Crash
Metropolitan
Regional
Remote
Western Australia
Crash Nature
n
Col %
n
Col %
n
Col %
n
Col %
Multi-Vehicle Crashes
Rear End
248
17.7
29
7.5
9
4.1
286
14.3
Head On
48
3.4
17
4.4
11
5.0
76
3.8
Sideswipe Same Dir.
82
5.9
9
2.3
2
0.9
93
4.6
Right Angle
309
22.1
46
11.9
14
6.4
369
18.4
Right Turn Through
185
13.2
20
5.2
3
1.4
208
10.4
Other/ Unknown
54
3.9
13
3.4
13
5.9
80
4.0
Total Multi Vehicle
926
66.2
134
34.6
52
23.6
1,112
55.4
Single-Vehicle Crashes
Hit Pedestrian
137
9.8
31
8.0
9
4.1
177
8.8
Hit Animal
1
0.1
7
1.8
3
1.4
11
0.5
Hit Object
250
17.9
152
39.3
75
34.1
477
23.8
Non Collision
72
5.1
57
14.7
72
32.7
201
10.0
Other/ Unknown
13
0.9
6
1.6
9
4.1
28
1.4
Total Single Vehicle
473
33.8
253
65.4
168
76.4
894
44.6
Total Hospitalisation Crashes
1,399
100.0
387
100.0
220
100.0
2,006
100.0
Table 98 Hospitalisation Crashes by High Priority Crash Type and Area of Crash
Area of Crash
Metropolitan
Regional
Remote
Western Australia
Crash Type
n
Col %
n
Col %
n
Col %
n
Col %
Intersection
716
51.2
116
30.0
35
15.9
867
43.2
Run Off Road
319
22.8
193
49.9
146
66.4
658
32.8
Head On
48
3.4
17
4.4
11
5.0
76
3.8
Other
384
27.4
78
20.2
38
17.3
500
24.9
Total Hospitalisation Crashes
1,399
100.0
387
100.0
220
100.0
2,006
100.0
Note: High Priority Crash Types are not mutually exclusive and, therefore, some crashes may be counted more than once
and percentages will sum to greater than 100%.
Reported Road Crashes in Western Australia 2011 75
Table 99 Serious Crashes by Crash Nature by ARIA Category
Crash Nature
ARIA Category
Highly
Accessible
Accessible
Moderately
Accessible
Remote
Very Remote
Total
n
Col %
n
Col %
n
Col %
n
Col %
n
Col %
n
Col %
Multi-Vehicle Crashes
Rear End
261
17.1
13
5.5
10
5.2
5
3.7
1
1.3
290
13.4
Head On
61
4.0
14
5.9
9
4.6
9
6.6
3
3.9
96
4.4
Sideswipe Same Dir.
87
5.7
5
2.1
4
2.1
1
0.7
1
1.3
98
4.5
Right Angle
329
21.6
24
10.1
18
9.3
9
6.6
0
0.0
380
17.5
Right Turn Through
195
12.8
15
6.3
2
1.0
2
1.5
0
0.0
214
9.9
Other/ Unknown
59
3.9
10
4.2
10
5.2
10
7.4
1
1.3
90
4.1
Total Multi Vehicle
992
65.0
81
34.2
53
27.3
36
26.5
6
7.8
1,168
53.8
Single-Vehicle Crashes
Hit Pedestrian
156
10.2
15
6.3
15
7.7
7
5.1
3
3.9
196
9.0
Hit Animal
1
0.1
2
0.8
5
2.6
2
1.5
2
2.6
12
0.6
Hit Object
282
18.5
103
43.5
84
43.3
40
29.4
27
35.1
536
24.7
Non Collisions
79
5.2
30
12.7
33
17.0
48
35.3
34
44.2
224
10.3
Other/ Unknown
15
1.0
6
2.5
4
2.1
3
2.2
5
6.5
33
1.5
Total Single Vehicle
533
35.0
156
65.8
141
72.7
100
73.5
71
92.2
1,001
46.2
Total Serious Crashes
1,525
100.0
237
100.0
194
100.0
136
100.0
77
100.0
2,169
100.0
Table 100 Serious Crashes by High Priority Crash Type by ARIA Category
Crash Type
ARIA Category
Highly
Accessible
Accessible
Moderately
Accessible
Remote
Very Remote
Total
n
Col %
n
Col %
n
Col %
n
Col %
n
Col %
n
Col %
Intersection
765
50.2
65
27.4
39
20.1
21
15.4
4
5.2
894
41.2
Run Off Road
355
23.3
125
52.7
114
58.8
88
64.7
57
74.0
739
34.1
Head On
61
4.0
14
5.9
9
4.6
9
6.6
3
3.9
96
4.4
Other
419
27.5
42
17.7
40
20.6
25
18.4
13
16.9
539
24.9
Total Serious Crashes
1,525
100.0
237
100.0
194
100.0
136
100.0
77
100.0
2,169
100.0
Note: High Priority Crash Types are not mutually exclusive and, therefore, some crashes may be counted more than once
and percentages will sum to greater than 100%.

Reported Road Crashes in Western Australia 2011 76
4.3 Safe Speeds
4.3.1 Speed Zones
Table 101 Speed Zone by Crash Severity
Crash Severity
Fatal
Hospitalisation
Total Serious
Other
Total
Speed Zone (km/h)
n
Col %
n
Col %
n
Col %
n
Col %
n
Col %
<50
1
0.6
33
1.6
34
1.6
670
1.8
704
1.8
50
19
11.7
437
21.8
456
21.0
11,027
29.6
11,483
29.1
60
22
13.5
552
27.5
574
26.5
11,398
30.6
11,972
30.3
70
17
10.4
280
14.0
297
13.7
6,095
16.3
6,392
16.2
80
12
7.4
187
9.3
199
9.2
3,027
8.1
3,226
8.2
90
4
2.5
61
3.0
65
3.0
439
1.2
504
1.3
100
14
8.6
109
5.4
123
5.7
1,956
5.2
2,079
5.3
110
71
43.6
283
14.1
354
16.3
1,469
3.9
1,823
4.6
State Default
0
0.0
32
1.6
32
1.5
351
0.9
383
1.0
Unknown
3
1.8
32
1.6
35
1.6
856
2.3
891
2.3
Total Crashes
163
100.0
2,006
100.0
2,169
100.0
37,288
100.0
39,457
100.0
4.3.2 Speed Compliance
General road user compliance with speed limits is shown in this section. Percentages shown
below are sourced from Main Roads Western Australia publications based on surveys of driving
speeds on sections of the metropolitan and regional road networks. Note that for 2008 and 2009,
these percentages are based on observations made in non-Metropolitan regions only; for all other
years the percentages are based on observations solely in the metropolitan region.
The percentages of vehicles exceeding the speed limit are calculated from surveys conducted by
collecting two days of speed data from a subset of sites selected for the 2000 survey by a stratified
random sample of speed zones. In each subsequent year, the sites selected varied slightly
depending on changes to speed limits, road geometry, or road treatments. The findings of the
studies were based solely on data obtained on vehicles travelling under “free flowing” conditions,
defined as situations where there is a gap of more than four seconds between vehicles.

Reported Road Crashes in Western Australia 2011 77
Table 102 Percentage of Vehicles Exceeding the Speed Limit by Speed Zone
Year
2006
2007
2008
2009
2010
2011
2011
Change
from 2010
Speed Zone
%
%
%
%
%
%
%
60 km/h
N/A
51.0
41.2
38.2
46.6
48.2
3.4
70 km/h
N/A
41.4
26.0
21.3
37.4
37.0
-1.1
80 km/h
N/A
37.3
29.2
23.5
39.9
34.0
-14.8
90 km/h
N/A
24.6
34.5
33.7
26.6
27.8
4.5
100 km/h
N/A
33.8
35.0
43.3
20.2
32.3
59.9
110 km/h
N/A
23.6
28.1
30.3
23.8
15.5
-34.9
Source: For year 2008 and 2009 the percentage of vehicles exceeding the speed limit is based on observations made in
non-Metropolitan regions only and is from Main Roads Western Australia “Driver Speed Behaviours on Western Australian
Rural Road Network 2000, 2003, 2004, 2005, 2007, 2008 and 2009” (2010). For year 2007, 2008, 2010 and 2011, the
percentage of vehicles exceeding the speed limit is based on observations made in the metropolitan region only and is
from Main Roads Western Australia “Trends in Driver Speed Behaviours on Perth Metropolitan Road Network 2000 to
2011” (2012).

Reported Road Crashes in Western Australia 2011 78
4.4 Safe Vehicles
4.4.1 ANCAP Safety Ratings
The Australasian New Car Assessment Program (ANCAP) is an independent crash test program
that provides consumers with advice on the level of occupant and pedestrian protection provided
by new cars and light commercial vehicles.
The ANCAP safety ratings are based on the results of a series of internationally recognised crash
tests that replicate the effects of the most common crash types (frontal offset, side impact, pole,
pedestrian and whiplash tests) and built in safety assist technologies that help protect occupants
and pedestrians, or that assist the driver in avoiding a crash.
Crash test dummies are used to measure the forces that would act on occupants and pedestrians
involved in the crash. This data is assessed, and the performance of the vehicle in each of the
crash types is scored. Vehicles are also scored on the safety assist technologies that are fitted as
standard to the vehicle. These scores are combined and converted into an ANCAP safety rating
ranging from 1 to 5 stars. Vehicles with better crash results and greater number of safety features
are awarded more stars.
In order to get the highest rating of 5 stars, the vehicle must achieve a specific score in each of the
crash tests, have a mandatory set of safety assist technologies fitted as standard, and also have a
minimum number of additional safety assist technologies fitted as standard as specified in the
ANCAP Rating Road Map
2
.
In 2011, the mandatory safety features were electronic stability control
(ESC), three-point seat belts for all forward facing seats and head protecting technologies (e.g.
side and curtain airbags) for the front seats.
The requirements for ANCAP safety ratings are not fixed, and will become more stringent in the
future to encourage continual improvements to the safety of vehicle designs.
2
See ANCAP Rating Road Map 2011-2017 available from the ANCAP website <http://www.ancap.com.au/media>

Reported Road Crashes in Western Australia 2011 79
Figure 19 New Passenger, Sports Utility and Light Commercial Vehicles Purchased
by ANCAP Safety Rating and Vehicle Type, WA Fleet
Source: R.L. Polk Australia Pty Ltd
Table 103 New Passenger, Sports Utility and Light Commercial Vehicles Purchased
by ANCAP Safety Rating and Vehicle type, WA Fleet
Vehicle type
Passenger vehicles
Sports utility
vehicles
Light commercial
vehicles
Total
ANCAP star
rating
n
%
n
%
n
%
n
%
1 star
0
0.0
0
0.0
177
0.8
177
0.2
2 stars
15
0.0
41
0.2
198
0.9
254
0.2
3 stars
684
1.3
690
2.5
5,877
25.5
7,251
6.9
4 stars
12,005
22.1
8,750
31.4
7,568
32.9
28,323
26.9
5 stars
30,914
57.0
10,309
37.0
1,350
5.9
42,573
40.5
Not rated
10,639
19.6
8,062
29.0
7,844
34.1
26,545
25.3
Total
54,257
100.0
27,852
100.0
23,014
100.0
105,123
100.0
Source: R.L. Polk Australia Pty Ltd

Reported Road Crashes in Western Australia 2011 80
4.4.2 Vehicle Type
Table 104 Vehicle Type by Crash Severity
Crash Severity
Fatal
Hospitalisation
Total Serious
Other
Total
Vehicle Type
n
Col %
n
Col %
n
Col %
n
Col %
n
Col %
Sedan/Hatchback
89
38.4
1,629
48.9
1,718
48.2
42,113
58.0
43,831
57.5
Station Wagon
26
11.2
354
10.6
380
10.7
9,255
12.7
9,635
12.6
Utility
33
14.2
353
10.6
386
10.8
8,270
11.4
8,656
11.4
Panel Van, 4WD
28
12.1
258
7.7
286
8.0
4,856
6.7
5,142
6.7
Rigid Truck
3
1.3
77
2.3
80
2.2
1,771
2.4
1,851
2.4
Articulated Truck
20
8.6
54
1.6
74
2.1
511
0.7
585
0.8
Bus (12 seats)
1
0.4
25
0.7
26
0.7
557
0.8
583
0.8
Multi Seater Van
2
0.9
10
0.3
12
0.3
312
0.4
324
0.4
Motorcycle
27
11.6
404
12.1
431
12.1
1,112
1.5
1,543
2.0
Moped
0
0.0
1
0.0
1
0.0
8
0.0
9
0.0
Bicycle
3
1.3
105
3.1
108
3.0
594
0.8
702
0.9
Motorised Wheelchair/Gopher
0
0.0
64
1.9
64
1.8
3,257
4.5
3,321
4.4
Other/ Unknown
0
0.0
0
0.0
0
0.0
0
0.0
0
0.0
Total Vehicles
232
100.0
3,334
100.0
3,566
100.0
72,616
100.0
76,182
100.0

Reported Road Crashes in Western Australia 2011 81
4.4.3 Airbags
This section presents information on the prevalence of airbags. Due to the way airbags are
designed, the more serious the crash, the more likely they are to be deployed. Since the impact
speed is not measured, the information in these tables cannot be used to infer the effectiveness of
airbags. Multiple airbags can also be fitted in a vehicle (i.e. frontal airbags for drivers and front
passengers and side airbags, which can be fitted for all seating positions), and the tables below
provide information on whether or not an airbag was fitted for individual seating positions. Motor
vehicle occupants who did not have an airbag fitted for their seating position were coded in the
IRIS database in the same way as those where it was not known if an airbag was fitted for the
seating position. Hence, it is not possible to differentiate between such cases.
Table 105 Airbag Usage by Injury Severity
Injury Severity
Fatal
Serious
Total Persons
KSI
Minor
None/Unknown
Total
Airbag Usage
n
Col %
n
Col %
n
Col %
n
Col %
n
Col %
n
Col %
Fitted and deployed
33
26.8
516
29.1
549
28.9
1,099
12.5
2,777
3.1
4,425
4.4
Fitted and not
deployed
21
17.1
541
30.5
562
29.6
5,645
64.0
46,657
51.5
52,864
52.2
Total Airbag Fitted
54
43.9
1,057
59.5
1,111
58.5
6,744
76.5
49,434
54.6
57,289
56.5
Not Fitted/Unknown
69
56.1
719
40.5
788
41.5
2,074
23.5
41,171
45.4
44,033
43.5
Total Motor Vehicle
Occupants
123
100.0
1,776
100.0
1,899
100.0
8,818
100.0
90,605
100.0
101,322
100.0
Table 106 Motor Vehicle Occupants Killed or Seriously Injured by Airbag Usage by Area
Area
Metropolitan
Regional
Remote
Total
Airbag Usage
n
Col %
n
Col %
n
Col %
n
Col %
Fitted and deployed
379
32.4
112
26.4
58
19.1
549
28.9
Fitted and not deployed
355
30.3
109
25.6
98
32.3
562
29.6
Total Airbag Fitted
734
62.7
221
52.0
156
51.5
1,111
58.5
Not Fitted/Unknown
437
37.3
204
48.0
147
48.5
788
41.5
Total Motor Vehicle Occupants KSI
1,171
100.0
425
100.0
303
100.0
1,899
100.0
Table 107 Motor Vehicle Occupants Killed or Seriously Injured by Airbag Usage by Occupant
Type
Motor Vehicle Occupant Type
Driver
Passenger
Total
Airbag Usage
n
Col %
n
Col %
n
Col %
Fitted and deployed
439
33.4
110
18.8
549
28.9
Fitted and not deployed
405
30.8
157
26.8
562
29.6
Total Airbag Fitted
844
64.3
267
45.6
1,111
58.5
Not Fitted/Unknown
469
35.7
319
54.4
788
41.5
Total Motor Vehicle Occupants KSI
1,313
100.0
586
100.0
1,899
100.0

Reported Road Crashes in Western Australia 2011 82
5. OTHER FACTORS
5.1 Temporal Factors
This section provides crash and injury numbers by crash month and day of week for the whole
state. Additional tables for the Metropolitan region and Regional and Remote areas are provided
in Appendix B.
Table 108 Crash Month by Crash Severity
Crash Severity
Fatal
Hospitalisation
Total Serious
Other
Total
Month
n
Col %
n
Col %
n
Col %
n
Col %
n
Col %
January
10
6.1
134
6.7
144
6.6
2,577
6.9
2,721
6.9
February
18
11.0
164
8.2
182
8.4
2,930
7.9
3,112
7.9
March
11
6.7
198
9.9
209
9.6
3,548
9.5
3,757
9.5
April
17
10.4
165
8.2
182
8.4
3,059
8.2
3,241
8.2
May
12
7.4
160
8.0
172
7.9
3,255
8.7
3,427
8.7
June
16
9.8
165
8.2
181
8.3
3,256
8.7
3,437
8.7
July
5
3.1
151
7.5
156
7.2
3,289
8.8
3,445
8.7
August
14
8.6
186
9.3
200
9.2
3,368
9.0
3,568
9.0
September
16
9.8
160
8.0
176
8.1
3,041
8.2
3,217
8.2
October
16
9.8
163
8.1
179
8.3
2,937
7.9
3,116
7.9
November
16
9.8
162
8.1
178
8.2
3,173
8.5
3,351
8.5
December
12
7.4
198
9.9
210
9.7
2,855
7.7
3,065
7.8
Total Crashes
163
100.0
2,006
100.0
2,169
100.0
37,288
100.0
39,457
100.0
Table 109 Crash Month by Injury Severity
Injury Severity
Fatal
Serious
Total Persons
KSI
Minor
None/Unknown
Total
Month
n
Col %
n
Col %
n
Col %
n
Col %
n
Col %
n
Col %
January
10
5.7
168
6.8
178
6.7
701
7.1
6,249
6.7
7,128
6.8
February
20
11.4
197
8.0
217
8.2
810
8.2
7,189
7.7
8,216
7.8
March
11
6.3
236
9.6
247
9.3
1,028
10.4
8,827
9.5
10,102
9.6
April
19
10.9
202
8.2
221
8.4
779
7.9
7,809
8.4
8,809
8.4
May
13
7.4
191
7.7
204
7.7
932
9.5
8,061
8.7
9,197
8.7
June
16
9.1
203
8.2
219
8.3
890
9.0
7,802
8.4
8,911
8.4
July
5
2.9
183
7.4
188
7.1
887
9.0
8,543
9.2
9,618
9.1
August
16
9.1
223
9.0
239
9.0
894
9.1
8,211
8.8
9,344
8.9
September
17
9.7
215
8.7
232
8.8
757
7.7
7,387
7.9
8,376
7.9
October
17
9.7
202
8.2
219
8.3
665
6.8
7,307
7.9
8,191
7.8
November
16
9.1
209
8.5
225
8.5
782
7.9
8,169
8.8
9,176
8.7
December
15
8.6
240
9.7
255
9.6
716
7.3
7,424
8.0
8,395
8.0
Total Persons
175
100.0
2,469
100.0
2,644
100.0
9,841
100.0
92,978
100.0
105,463
100.0

Reported Road Crashes in Western Australia 2011 83
Table 110 Day of Week by Crash Severity
Crash Severity
Fatal
Hospitalisation
Total Serious
Other
Total
Day of Week
n
Col %
n
Col %
n
Col %
n
Col %
n
Col %
Monday
18
11.0
232
11.6
250
11.5
5,059
13.6
5,309
13.5
Tuesday
21
12.9
268
13.4
289
13.3
5,839
15.7
6,128
15.5
Wednesday
17
10.4
283
14.1
300
13.8
5,927
15.9
6,227
15.8
Thursday
21
12.9
291
14.5
312
14.4
6,144
16.5
6,456
16.4
Friday
32
19.6
346
17.2
378
17.4
6,514
17.5
6,892
17.5
Saturday
29
17.8
325
16.2
354
16.3
4,609
12.4
4,963
12.6
Sunday
25
15.3
261
13.0
286
13.2
3,196
8.6
3,482
8.8
Total Crashes
163
100.0
2,006
100.0
2,169
100.0
37,288
100.0
39,457
100.0

Reported Road Crashes in Western Australia 2011 84
6. REGIONAL SUMMARIES
This section contains information on road crashes that occurred in individual regions of Western
Australia. Comparison tables are provided containing information for each region, and several
maps are included that compare crash and casualty rates across the regions. Finally, there is a
sub-section for each region, containing a brief summary for that region and providing more detail
on particular road user behaviours or crash information pertinent to that region. The individual
sections are designed to highlight particular areas of concern for each region.
The tables and maps in Sections 6.1 and 6.2 refer to serious crashes, although some refer to all
serious crashes and others refer only to police-attended serious crashes. Any tables or maps that
refer to police-attended serious crashes are clearly labelled as such. All but two fatal crashes in
2011 were attended by police, however, there were 271 hospitalisation crashes that were not
attended by police. Therefore, percentages calculated from counts reported in different tables may
vary, and this is most noticeable for regions with a relatively large proportion of hospitalisation
crashes that were not attended by police.
6.1 Regional Comparisons
The population of a region should be considered when comparing numbers of crashes across
different regions, as a region with a higher population is likely to have a higher number of crashes.
The 2011 estimated resident population by Towards Zero and Main Roads regions is provided in
Table 111.
Table 111 2011 Estimated Resident Population by Region
2011 Population
Towards Zero Regions
n
%
Metropolitan
1,744,529
74.2
Regional
393,939
16.7
Remote
213,747
9.1
Main Roads Regions
Goldfields
58,537
2.5
Great Southern
59,077
2.5
Kimberley
37,673
1.6
Mid West
54,368
2.3
Pilbara-Gascoyne
72,357
3.1
South West
252,818
10.7
Wheatbelt North
50,118
2.1
Wheatbelt South
22,738
1.0
Total Western Australia
2,352,215
100.0
Source: Australian Bureau of Statistics, Customised report, 2013.

Reported Road Crashes in Western Australia 2011 85
Table 112 Crash Severity by Region
Crash Severity
Fatal
Hospitalisation
Total Serious
Other
Total
Towards Zero Regions
n
Row %
n
Row %
n
Row %
n
Row %
n
Row %
Metropolitan
68
0.2
1,399
4.2
1,467
4.4
31,862
95.6
33,329
100.0
Regional
57
1.3
387
9.0
444
10.3
3,854
89.7
4,298
100.0
Remote
38
2.1
220
12.0
258
14.1
1,572
85.9
1,830
100.0
Main Roads Regions
Goldfields
7
1.3
45
8.1
52
9.4
501
90.6
553
100.0
Great Southern
6
1.2
35
6.9
41
8.1
464
91.9
505
100.0
Kimberley
9
3.6
33
13.2
42
16.8
208
83.2
250
100.0
Mid West
8
1.5
63
12.0
71
13.5
456
86.5
527
100.0
Pilbara-Gascoyne
7
1.2
65
11.6
72
12.8
489
87.2
561
100.0
South West
21
0.7
232
7.9
253
8.7
2,669
91.3
2,922
100.0
Wheatbelt North
27
4.7
94
16.2
121
20.9
459
79.1
580
100.0
Wheatbelt South
10
4.3
40
17.4
50
21.7
180
78.3
230
100.0
Total Crashes
163
0.4
2,006
5.1
2,169
5.5
37,288
94.5
39,457
100.0
Table 113 Injury Severity by Region
Injury Severity
Fatal
Serious
Total Persons
KSI
Minor
None/Unknown
Total
Towards Zero
Regions
n
Row %
n
Row %
n
Row %
n
Row %
n
Row %
n
Row %
Metropolitan
72
0.1
1,652
1.8
1,724
1.9
8,257
9.2
80,062
88.9
90,043
100.0
Regional
60
0.6
505
4.6
565
5.2
1,058
9.7
9,268
85.1
10,891
100.0
Remote
43
0.9
312
6.9
355
7.8
526
11.6
3,648
80.5
4,529
100.0
Main Roads Regions
Goldfields
8
0.6
64
4.7
72
5.2
130
9.5
1,171
85.3
1,373
100.0
Great Southern
7
0.6
42
3.3
49
3.9
103
8.2
1,110
88.0
1,262
100.0
Kimberley
11
1.5
52
7.2
63
8.8
86
12.0
570
79.3
719
100.0
Mid West
8
0.6
83
6.2
91
6.8
130
9.7
1,113
83.4
1,334
100.0
Pilbara-Gascoyne
8
0.5
91
6.2
99
6.8
172
11.8
1,187
81.4
1,458
100.0
South West
22
0.3
294
3.9
316
4.2
770
10.1
6,526
85.7
7,612
100.0
Wheatbelt North
29
2.4
136
11.2
165
13.6
145
12.0
903
74.4
1,213
100.0
Wheatbelt South
10
2.2
55
12.2
65
14.5
48
10.7
336
74.8
449
100.0
Total Persons
175
0.2
2,469
2.3
2,644
2.5
9,841
9.3
92,978
88.2
105,463
100.0
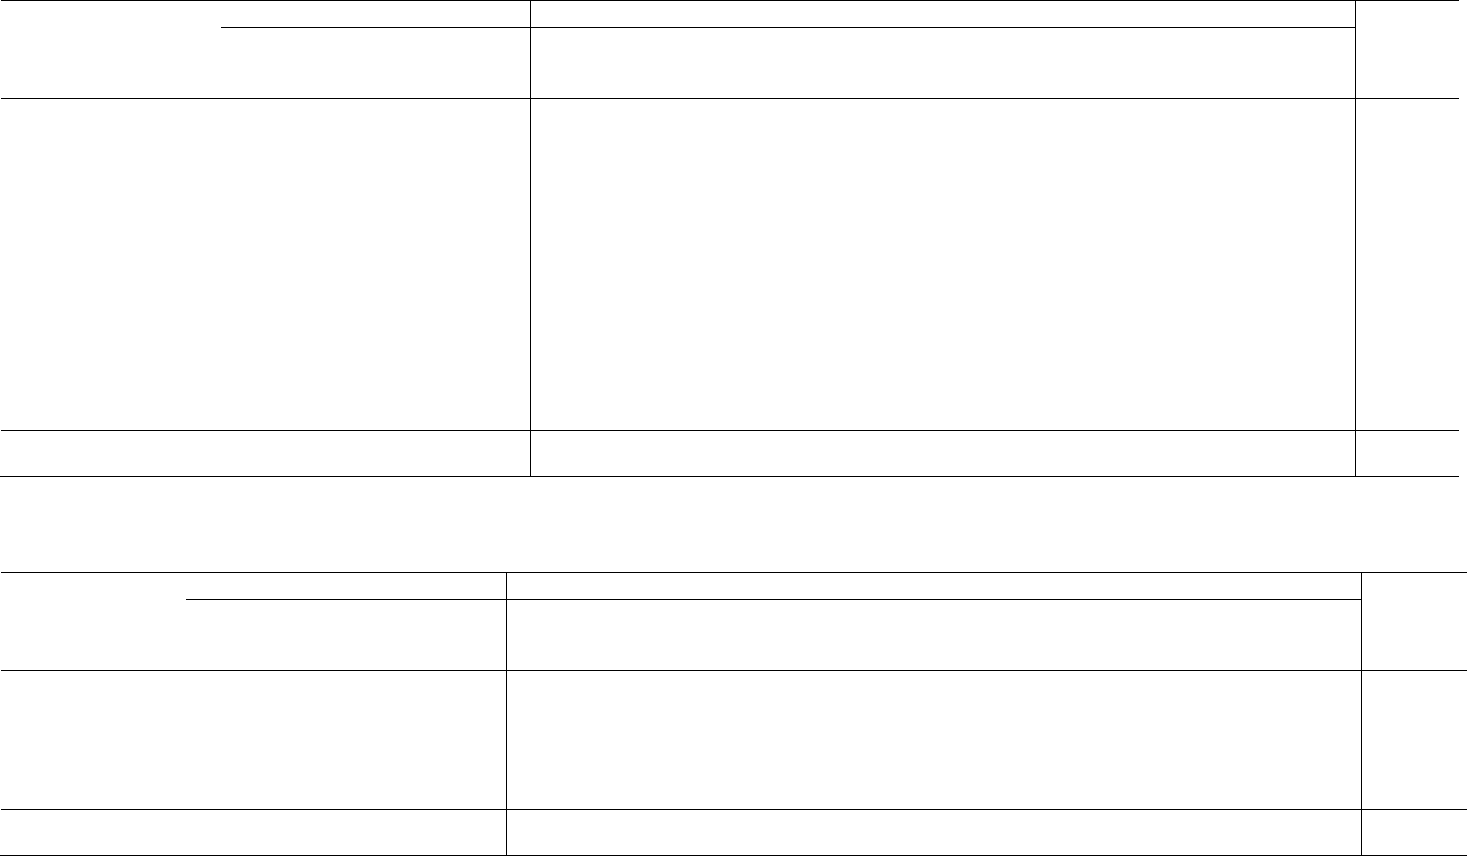
Reported Road Crashes in Western Australia 2011 86
Table 114 Drivers/Riders Involved in Serious Crashes by Gender by Region
Towards Zero Regions
Main Roads Regions
Total
Western
Australia
Metropolitan
Regional
Remote
Goldfields
Great
Southern
Kimberley
Mid West
Pilbara-
Gascoyne
South West
Wheatbelt
North
Wheatbelt
South
Gender of Drivers/Riders
n
n
n
n
n
n
n
n
n
n
n
n
Male
Fatal
83
58
29
4
6
5
10
4
19
33
6
170
Hospitalisation
1,498
357
206
36
29
29
63
73
228
74
31
2,061
Total Male
1,581
415
235
40
35
34
73
77
247
107
37
2,231
Female
Fatal
19
15
14
3
1
3
0
5
6
7
4
48
Hospitalisation
824
168
60
16
15
8
18
14
107
37
13
1,052
Total Female
843
183
74
19
16
11
18
19
113
44
17
1,100
Unknown gender
Fatal
1
4
1
0
0
1
0
0
4
0
0
6
Hospitalisation
83
7
4
2
1
1
0
0
6
1
0
94
Total Unknown gender
84
11
5
2
1
2
0
0
10
1
0
100
Total Drivers/Riders in
Serious Crashes
2,508
609
314
61
52
47
91
96
370
152
54
3,431
Table 115 Drivers/Riders Involved in Serious Crashes by Age Group by Region
Towards Zero Regions
Main Roads Regions
Total
Western
Australia
Age Group of
Drivers/Riders
Metropolitan
Regional
Remote
Goldfields
Great
Southern
Kimberley
Mid West
Pilbara-
Gascoyne
South West
Wheatbelt
North
Wheatbelt
South
n
n
n
n
n
n
n
n
n
n
n
n
0 – 16
22
7
2
1
0
0
2
1
4
1
0
31
17 – 24
563
146
78
15
10
16
31
21
87
27
17
787
25 – 59
1,444
357
194
33
29
26
53
62
224
92
32
1,995
60 and over
304
79
33
11
11
3
5
9
40
28
5
416
Unknown age
175
20
7
1
2
2
0
3
15
4
0
202
Total Drivers/Riders in
Serious Crashes
2,508
609
314
61
52
47
91
96
370
152
54
3,431
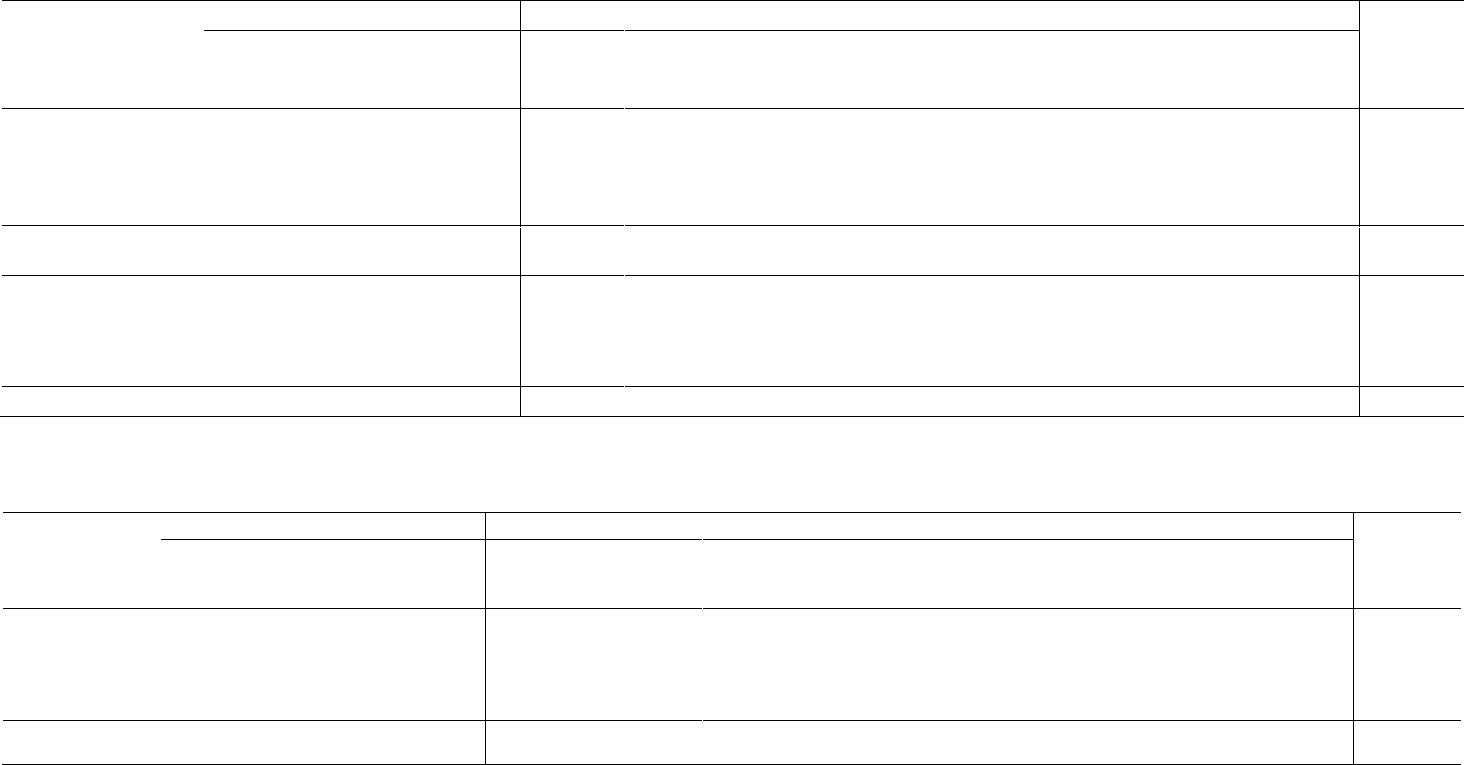
Reported Road Crashes in Western Australia 2011 87
Table 116 Serious Crashes by Speed a Factor by Region
Towards Zero Regions
Main Roads Regions
Total
Western
Australia
Speed a Factor in Crash
Metropolitan
Regional
Remote
Goldfields
Great
Southern
Kimberley
Mid West
Pilbara-
Gascoyne
South West
Wheatbelt
North
Wheatbelt
South
n
n
n
n
n
n
n
n
n
n
n
n
Police-Attended Serious Crashes
Yes
153
57
41
7
4
5
12
13
33
17
7
251
No
345
185
98
23
18
15
35
25
108
43
16
628
Unknown
752
173
92
21
15
17
20
23
94
52
23
1,017
Total police Attended
Serious Crashes
1,250
415
231
51
37
37
67
61
235
112
46
1,896
Serious Crashes
Yes
153
57
41
7
4
5
12
13
33
17
7
251
No
347
186
98
23
18
15
35
25
109
43
16
631
Unknown
967
201
119
22
19
22
24
34
111
61
27
1,287
Total Serious Crashes
1,467
444
258
52
41
42
71
72
253
121
50
2,169
Table 117 Serious Crashes by Highest Driver/Rider BAC in Crash by Region, Police-Attended Crashes
Towards Zero Regions
Main Roads Regions
Total
Western
Australia
Highest
Driver/Rider BAC
in Crash
Metropolitan
Regional
Remote
Goldfields
Great
Southern
Kimberley
Mid West
Pilbara-
Gascoyne
South West
Wheatbelt
North
Wheatbelt
South
n
n
n
n
n
n
n
n
n
n
n
n
Nil
838
271
144
33
24
22
45
39
163
66
23
1,253
<0 to <0.05
36
6
4
0
1
1
1
0
3
1
3
46
0.05
106
48
32
2
1
8
12
11
24
18
4
186
Unknown
266
89
50
15
10
6
9
11
45
27
16
405
Total Serious
Crashes
1
1,246
414
230
50
36
37
67
61
235
112
46
1,890
1. Excludes crashes that did not involve a driver/rider (n=6).

Reported Road Crashes in Western Australia 2011 88
Table 118 Motor Vehicle Occupants Killed or Seriously Injured by Seat Belt Usage by Region, Police-Attended Crashes
Towards Zero Regions
Main Roads Regions
Total
Western
Australia
Metropolitan
Regional
Remote
Goldfields
Great
Southern
Kimberley
Mid West
Pilbara-
Gascoyne
South West
Wheatbelt
North
Wheatbelt
South
Seat Belt Usage
n
n
n
n
n
n
n
n
n
n
n
n
Worn
870
320
193
41
30
22
49
54
177
100
40
1,383
Not Worn
39
33
47
3
3
19
10
10
18
10
7
119
Unknown
102
52
35
12
3
6
7
7
24
23
5
189
Total Motor Vehicle
Occupants KSI
1,011
405
275
56
36
47
66
71
219
133
52
1,691
Table 119 Serious Crashes by Crash Type by Region
Towards Zero Regions
Main Roads Regions
Total
Western
Australia
Metropolitan
Regional
Remote
Goldfields
Great
Southern
Kimberley
Mid West
Pilbara-
Gascoyne
South West
Wheatbelt
North
Wheatbelt
South
n
n
n
n
n
n
n
n
n
n
n
n
Crash Nature
Head On
60
23
13
0
1
1
8
5
8
13
0
96
Right Angle
317
48
15
8
4
1
8
5
32
4
1
380
Other/ Unknown Multi-
Vehicle
1
585
78
29
4
6
6
5
10
60
13
3
692
Hit Pedestrian
147
36
13
3
3
4
9
4
24
2
0
196
Hit Animal
1
7
4
0
2
0
1
3
1
3
1
12
Hit Object
268
183
85
14
17
11
25
19
95
61
26
536
Non Collision
75
60
89
21
8
15
14
24
28
21
18
224
Other/ Unknown Single-
Vehicle
14
9
10
2
0
4
1
2
5
4
1
33
High Priority Crash Type
Intersection
734
122
38
14
7
6
13
12
83
20
5
894
Run Off Road
340
227
172
32
24
28
37
42
117
79
40
739
Head On
60
23
13
0
1
1
8
5
8
13
0
96
Other
405
89
45
7
10
8
15
18
55
14
7
539
Total Crashes
1,467
444
258
52
41
42
71
72
253
121
50
2,169
Note: High Priority Crash Types are not mutually exclusive and therefore some crashes may be counted more than once and percentages will sum to greater than 100%.
1. Other Multi-Vehicle crashes include: ‘Rear End’, ‘Sideswipe Same Direction’ and ‘Right Turn Through’ crashes.

Reported Road Crashes in Western Australia 2011 89
Table 120 Serious Crashes by Other Contributing Factors by Region
Towards Zero Region
Main Roads Regions
Total
Western
Australia
Metropolitan
Regional
Remote
Goldfields
Great
Southern
Kimberley
Mid West
Pilbara-
Gascoyne
South West
Wheatbelt
North
Wheatbelt
South
Factor
n
n
n
n
n
n
n
n
n
n
n
n
Road Classification
Highway
498
134
126
21
16
24
29
41
80
39
10
758
Main Road
2
93
25
1
4
2
7
10
47
32
15
120
Other
967
217
107
30
21
16
35
21
126
50
25
1,291
Road Surface
Sealed
1,454
414
209
44
35
35
64
61
241
102
41
2,077
Unsealed
9
27
42
6
6
6
7
8
10
17
9
78
Unknown
4
3
7
2
0
1
0
3
2
2
0
14
Road Alignment
Curve
261
138
68
11
15
10
22
17
71
45
15
467
Straight
1,172
298
183
39
25
30
48
52
176
76
35
1,653
Unknown
34
8
7
2
1
2
1
3
6
0
0
49
Road Conditions
Wet
210
57
20
5
9
4
2
4
34
14
5
287
Dry
1,243
382
237
46
32
38
69
68
216
105
45
1,862
Unknown
14
5
1
1
0
0
0
0
3
2
0
20
Total Serious Crashes
1,467
444
258
52
41
42
71
72
253
121
50
2,169

Reported Road Crashes in Western Australia 2011 90
Table 121 Serious Crashes by Month and Day of Week by Region
Towards Zero Region
Main Roads Regions
Total
Western
Australia
Metropolitan
Regional
Remote
Goldfields
Great
Southern
Kimberley
Mid West
Pilbara-
Gascoyne
South West
Wheatbelt
North
Wheatbelt
South
n
n
n
n
n
n
n
n
n
n
n
n
Month
January
96
31
17
3
5
3
5
6
13
11
2
144
February
129
38
15
2
2
3
3
4
26
10
3
182
March
143
52
14
1
5
3
6
2
39
9
1
209
April
126
39
17
4
1
2
4
3
25
13
4
182
May
117
31
24
6
2
3
3
8
17
9
7
172
June
114
37
30
4
3
7
9
16
15
11
2
181
July
112
24
20
4
3
4
5
3
14
8
3
156
August
141
31
28
4
2
3
10
12
15
9
4
200
September
112
37
27
8
3
3
7
7
17
14
5
176
October
124
37
18
6
5
1
6
2
17
11
7
179
November
109
42
27
6
7
4
5
5
27
10
5
178
December
144
45
21
4
3
6
8
4
28
6
7
210
Day of Week
Monday
156
63
31
2
4
2
12
10
39
16
9
250
Tuesday
205
51
33
6
4
10
7
4
28
18
7
289
Wednesday
214
50
36
11
6
8
9
10
27
14
1
300
Thursday
226
49
37
7
5
6
10
9
31
12
6
312
Friday
267
80
31
8
6
5
12
11
41
23
5
378
Saturday
233
88
33
9
10
2
9
8
50
18
15
354
Sunday
166
63
57
9
6
9
12
20
37
20
7
286
Total Serious Crashes
1,467
444
258
52
41
42
71
72
253
121
50
2,169
Reported Road Crashes in Western Australia 2011 91
6.2 Regional Crash and Casualty Rates
This section contains maps showing serious crash and KSI rates across Western Australia. Map 3
shows the overall serious crash rates by region. The Wheatbelt North and Wheatbelt South had
the highest serious crash rates of 241.4 and 219.9 serious crashes per 100,000 population,
respectively, while the Great Southern and Metropolitan regions had the lowest rates of 69.4 and
84.1 per 100,000 population, respectively.
Map 4 shows the number of serious multi-vehicle crashes per 100,000 population by region. The
Wheatbelt North region had the highest rate of 59.9 per 100,000 population, seeing the
Metropolitan region falling to second highest with 55.1 per 100,000 population. The Wheatbelt
South region had the lowest rate (17.6 per 100,000 population).
Single-vehicle crash rates by region are shown in Map 5, with the highest rates in the Wheatbelt
South and Wheatbelt North (202.3 and 181.6 per 100,000 population, respectively) and the lowest
in the Metropolitan region (28.9 per 100,000 population). Of the non-Metropolitan regions, the
Great Southern had the lowest serious single-vehicle crash rate (50.8 per 100,000 population).
Speed-related serious crash rates (i.e. the number of police-attended serious crashes where
speed was a factor per 100,000 population) are shown in Map 6. The Wheatbelt North and
Wheatbelt South had the highest rates (33.9 and 30.8 per 100,000 population, respectively), while
the Great Southern region had the lowest speed-related serious crash rate (6.8 per 100,000
population), with the Metropolitan region having the second lowest speed-related serious crash
rate (8.8 per 100,000 population).
Rates for alcohol-related (i.e. involving at least one driver/rider with a BAC of 0.05 g/100mL or
higher), police-attended serious crashes are provided in Map 7. The Wheatbelt North region had
the highest rate of alcohol-related serious crashes (35.9 per 100,000 population). The Great
Southern and Goldfields regions had the lowest alcohol-related serious crash rate (1.7 and 3.4 per
100,000 population, respectively).
Map 8 shows the number of persons killed or seriously injured in police-attended crashes who
were not wearing a seat belt per 100,000 population. The Kimberley had the highest rate (50.4 per
100,000 population), followed by the Wheatbelt South (30.8 per 100,000 population). The
Metropolitan, Great Southern and Goldfields regions had the lowest rates, with 2.2, 5.1 and 5.1 per
100,000 population, respectively.
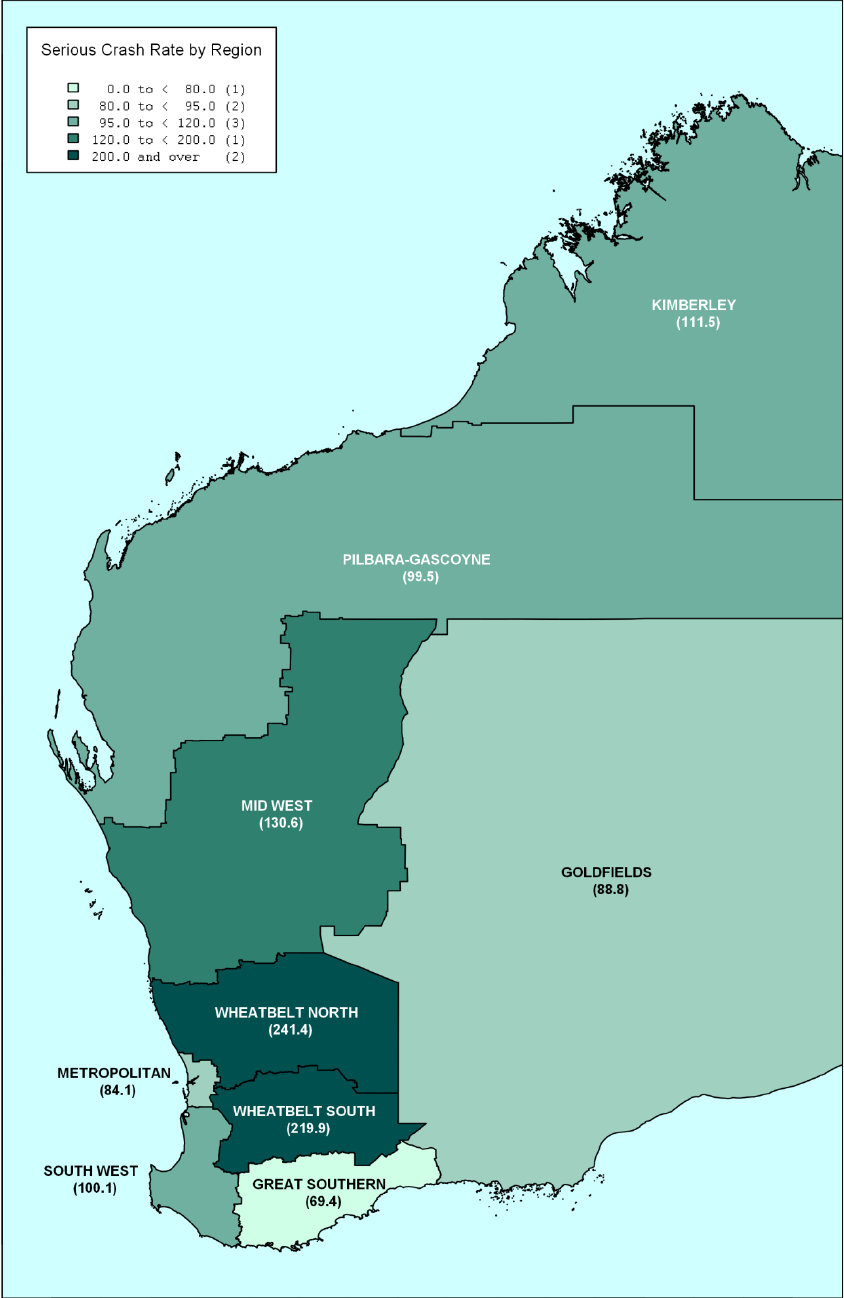
Reported Road Crashes in Western Australia 2011 92
Map 3 Serious Crash Rate per 100,000 Population by Region
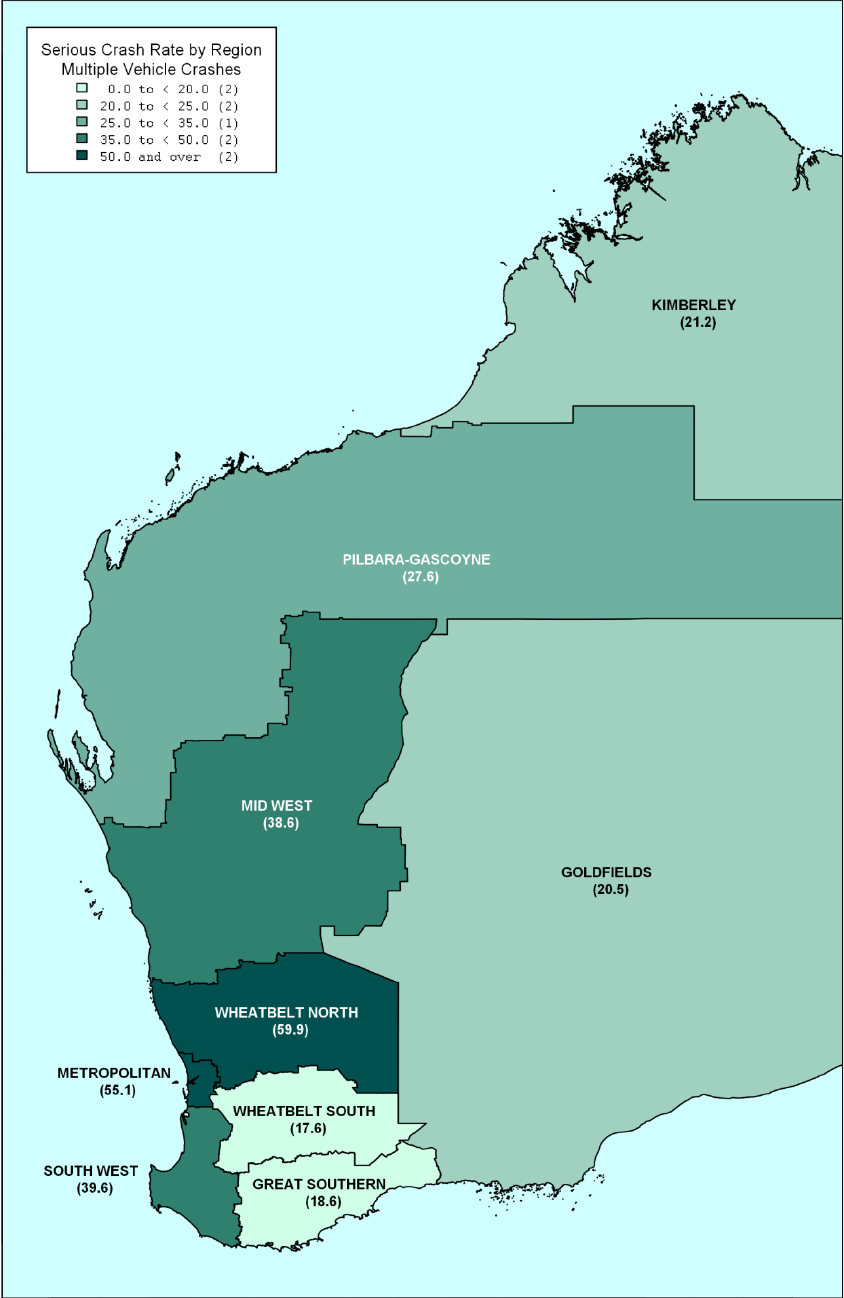
Reported Road Crashes in Western Australia 2011 93
Map 4 Multi-vehicle Serious Crash Rate per 100,000 Population by Region
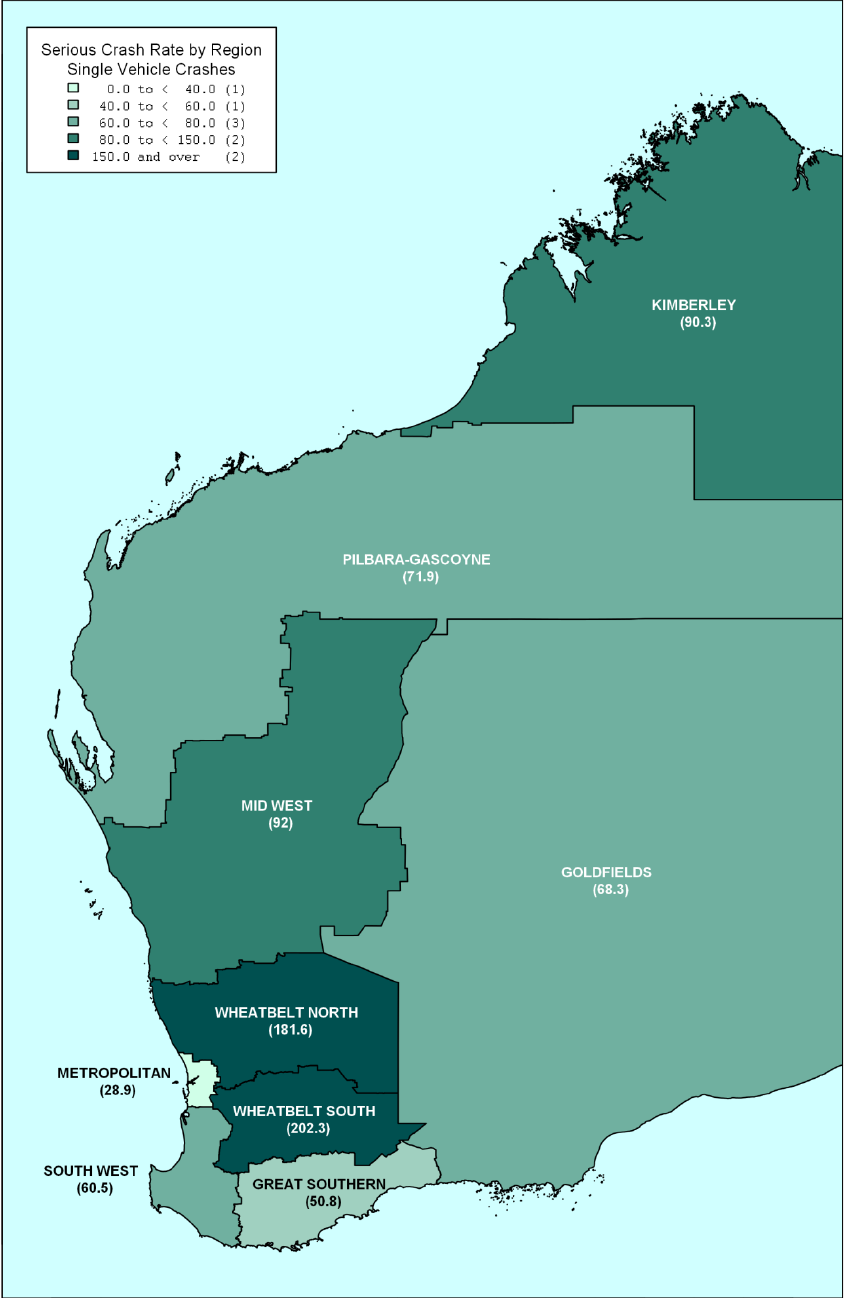
Reported Road Crashes in Western Australia 2011 94
Map 5 Single-Vehicle Serious Crash Rate per 100,000 Population by Region

Reported Road Crashes in Western Australia 2011 95
Map 6 Speed-Related Serious Crash Rate per 100,000 Population by Region,
Police-Attended Crashes

Reported Road Crashes in Western Australia 2011 96
Map 7 Alcohol-Related Serious Crash Rate per 100,000 Population by Region,
Police-Attended Crashes

Reported Road Crashes in Western Australia 2011 97
Map 8 Seat Belt Not Worn KSI Rate per 100,000 Population by Region, Police-Attended
Crashes

Reported Road Crashes in Western Australia 2011 98
Map 9 shows age and gender standardised KSI rates, which are provided to allow direct
comparisons across the regions. For example, it can be seen from Table 18 and Table 21 in
Section 2.4 that 17 to 24 year olds have much higher KSI rates than other age groups. Therefore,
to determine whether differences in KSI rates across regions can be attributed to differences in the
age and gender profiles of each region, the rates were standardised using the demographic
breakdown of each region. The standardised rates show what the rates would be if all regions had
the same age and gender breakdown as the State as a whole. The effect of the standardisation is
to increase the KSI rate in regions that have low proportions (relative to the whole of WA) of “high
risk” age and gender groups and decrease the KSI rate in regions with high proportions of “high
risk” age and gender groups.
One limitation of this approach is that both the age and gender of persons killed or seriously
injured are needed to calculate the standardised rates. This means that any person killed or
seriously injured whose age and/or gender was not recorded cannot be included in the
standardised KSI rates, leading to underestimates for each region. There was a lower variation
across the regions in the percentage of persons killed or seriously injured whose age and/or
gender were not recorded than in previous years. The minimum percentage was in the Great
Southern (10.2%) while the maximum was in the Goldfields (19.4%). For this reason, Table 122,
which shows age and gender standardised KSI rates, also provides the number of people killed or
seriously injured in each region for whom both age and gender were recorded and the number for
whom age and/or gender was not recorded.
The Great Southern region had the lowest standardised KSI rate (83.4 per 100,000 population),
followed by the Metropolitan region at 84.2 per 100,000 population. The Wheatbelt South and
Wheatbelt North had the highest age and gender standardised KSI rates (307.6 and 311.3 per
100,000 respectively).
Table 122 Age and Gender Standarised Rates of those Killed or Seriously Injured by Region
Persons Killed or Seriously Injured (n)
Age and Gender
Standardised KSI Rate
1
(per 100,000 population)
Towards Zero Regions
Age and Gender
Known
Age and/or Gender
Unknown
Total Persons KSI
Metropolitan
1,483
241
1,724
84.2
Regional
492
73
565
137.6
Remote
304
51
355
138.6
Main Roads Regions
Goldfields
58
14
72
102.7
Great Southern
44
5
49
83.4
Kimberley
53
10
63
136.7
Mid West
79
12
91
156.8
Pilbara-Gascoyne
88
11
99
113.3
South West
275
41
316
119.9
Wheatbelt North
143
22
165
307.6
Wheatbelt South
56
9
65
311.3
Total Western Australia
2279
365
2644
N/A
1. Excludes persons of unknown age and/or gender (n=365).
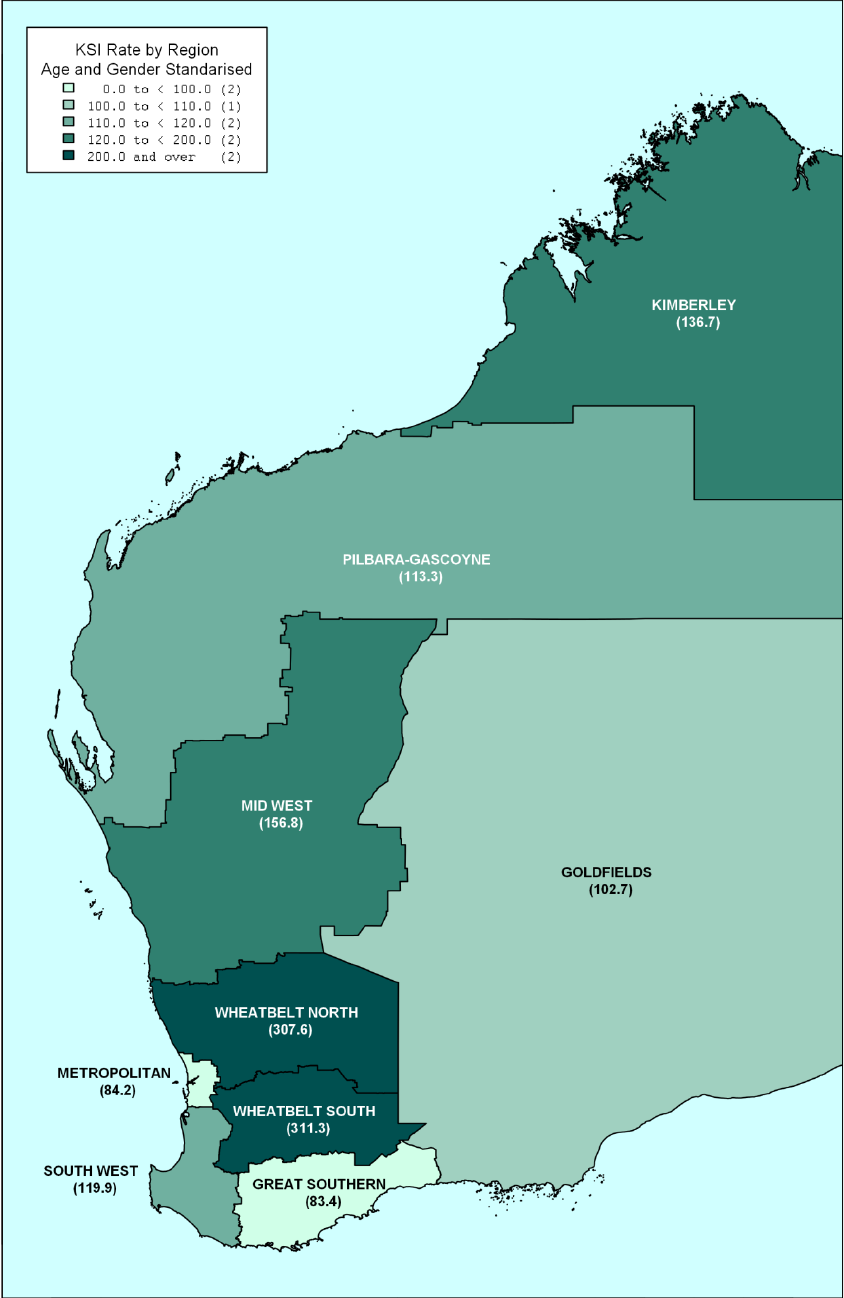
Reported Road Crashes in Western Australia 2011 99
Map 9 Age and Gender Standardised KSI Rate per 100,000 Population by Region
Note: Excludes persons of unknown age and/or gender (n=365).

Reported Road Crashes in Western Australia 2011 100
6.3 Goldfields
There were seven fatal crashes in the Goldfields region during 2011 in which eight people died. Of
persons killed or seriously injured where gender was known, 58% were males. The age-specific
rate for persons killed or seriously injured was by far the highest for persons aged between 17 and
24 years (Table 123). Forty two per cent of persons killed or seriously injured in the Goldfields
region were drivers, 39% were passengers and 14% were motorcyclists (Figure 21).
Of police-attended serious crashes in the Goldfields, 14% had speed as a factor (Table 116). The
Goldfields had the second lowest percentage (4%) of serious crashes that were alcohol related
(Table 117). The Goldfields had the second lowest percentage (5.4%) of motor vehicle occupants
killed or seriously injured who were not wearing a seat belt (Table 118). The rate of motor vehicle
occupants killed or seriously injured who were not wearing a seat belt was 5.1 per 100,000
population (Map 8).
Over two thirds (77%) of serious crashes in the Goldfields region were single-vehicle crashes. The
Goldfields had the second highest percentage of ‘Intersection’ crashes of the non-Metropolitan
regions (27%) and the highest percentage of ‘Non Collision’ crashes of all regions (40%) (Table
119). There were no ‘Head On’ serious crashes in the Goldfields in 2011.
Figure 20 Fatal Crashes and Fatalities by Year – Goldfields
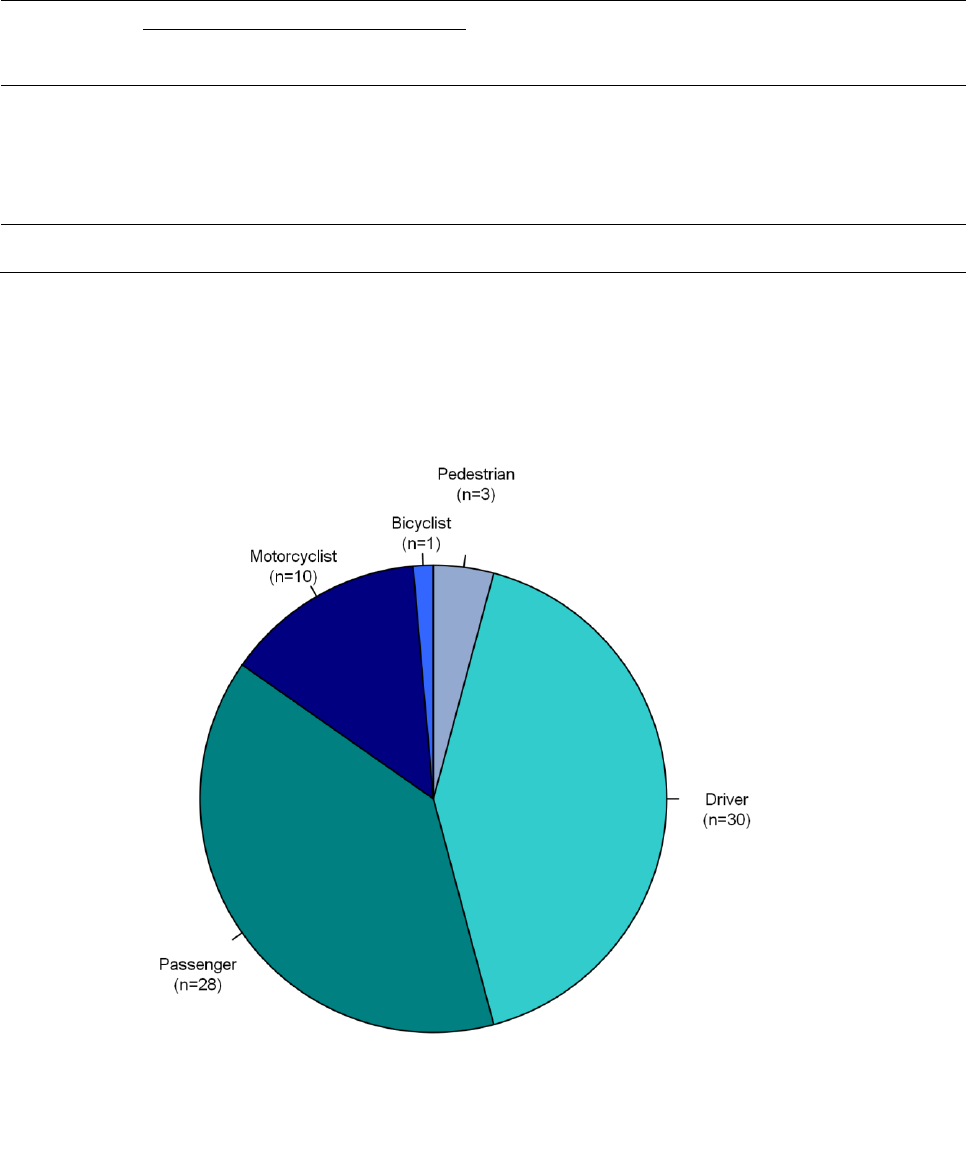
Reported Road Crashes in Western Australia 2011 101
Table 123 Persons Killed or Seriously Injured by Age Group and Gender - Goldfields
Gender
Percentage of Persons Killed
or Seriously Injured
Percentage of
Population
Age-Specific
KSI Rate
2
Male
Female
Total
1
Age Group
n
n
n
%
%
Rate
0 - 16
3
3
9
12.5
24.9
61.9
17 - 24
4
6
12
16.7
11.8
173.9
25 - 59
23
9
37
51.4
52.0
121.5
60 and over
5
5
11
15.3
11.3
165.7
Unknown Age
0
2
3
4.2
N/A
N/A
Total Persons
KSI
35
25
72
100.0
100.0
123.0
Source: Population data from Australian Bureau of Statistics, Customised report, 2013
1. Includes persons of unknown gender.
2. Age-specific KSI rates per 100,000 population.
Figure 21 Persons Killed or Seriously Injured by Road User Type – Goldfields

Reported Road Crashes in Western Australia 2011 102
Table 124 Crash Nature by Crash Severity – Goldfields
Crash Severity
Fatal
Hospitalisation
Total Serious
Crash Nature
n
n
n
Multi-Vehicle Crashes
Rear End
0
1
1
Head On
0
0
0
Sideswipe Same Dir.
0
0
0
Right Angle
0
8
8
Right Turn Through
0
0
0
Other/Unknown Multi
0
3
3
Total Multi Vehicle
0
12
12
Single-Vehicle Crashes
Hit Pedestrian
0
3
3
Hit Animal
0
0
0
Hit Object
2
12
14
Non Collision
5
16
21
Other/Unknown Single
0
2
2
Total Single Vehicle
7
33
40
Total Crashes
7
45
52
Table 125 High Priority Crash Type by Crash Severity – Goldfields
Crash Severity
Fatal
Hospitalisation
Total Serious
Crash Type
n
n
n
Intersection
0
14
14
Run Off Road
7
25
32
Head On
0
0
0
Other
0
7
7
Total Crashes
7
45
52
Note: High Priority Crash Types are not mutually exclusive and, therefore, some crashes may be counted more than once
and may sum to greater than the total number of crashes.

Reported Road Crashes in Western Australia 2011 103
6.4 Great Southern
There were six fatal crashes in the Great Southern region during 2011, in which seven people
died. Both the number of crashes and the number of people killed were lower than in 2010. Of
persons killed or seriously injured where gender was known, 64% were male. Despite persons
aged 17 to 24 only making up 9% of the Great Southern population, 33% of persons killed or
seriously injured fell in this age bracket, and this age group had the highest age-specific rate for
persons killed or seriously injured (Table 126). Drivers constituted 57% of persons killed or
seriously injured, followed by passengers (24%) and motorcyclists (10%) (Figure 23).
The Great Southern had the lowest percentage of police-attended serious crashes that were
speed related (11%), and also the lowest speed-related serious crash rate (6.8 per 100,000
population) (Table 116 and Map 6). The Great Southern had the lowest percentage of serious
crashes that were alcohol related (3%) (Table 117), and the lowest alcohol-related serious crash
rate (1.7 per 100,000 population) (Map 7). Eight per cent of persons killed or seriously injured in
the Great Southern region were not wearing a seat belt (Table 118). The region had the equal
lowest seat belt not worn rate (5.1 per 100,000 population) of the non-Metropolitan regions (Map
8).
Nearly three quarters (73%) of serious crashes in the Great Southern region were single-vehicle
crashes (Table 127). The Great Southern had the equal lowest percentage of ‘Head On’ crashes
of all regions (2.4%), and 59% of the serious crashes were ‘Run Off Road’ crashes (Table 119 and
Table 128). Five of the six fatal crashes in the Great Southern were single-vehicle crashes (Table
127).
Figure 22 Fatal Crashes and Fatalities by Year - Great Southern

Reported Road Crashes in Western Australia 2011 104
Table 126 Persons Killed or Seriously Injured by Age Group and Gender - Great Southern
Gender
Percentage of Persons Killed
or Seriously Injured
Percentage of
Population
Age-Specific
Rate
2
Male
Female
Total
1
Age Group
n
n
n
%
%
Rate
0 - 16
1
1
2
4.1
23.2
14.6
17 - 24
6
6
16
32.7
8.5
320.2
25 - 59
14
8
22
44.9
45.6
81.6
60 and over
7
1
8
16.3
22.7
59.6
Unknown Age
1
0
1
2.0
N/A
N/A
Total Persons
KSI
29
16
49
100.0
100.0
82.9
Source: Population data from Australian Bureau of Statistics, Customised report, 2013
1. Includes persons of unknown gender.
2. Age-specific KSI rates per 100,000 population.
Figure 23 Persons Killed or Seriously Injured by Road User Type - Great Southern

Reported Road Crashes in Western Australia 2011 105
Table 127 Crash Nature by Crash Severity – Great Southern
Crash Severity
Fatal
Hospitalisation
Total Serious
Crash Nature
n
n
n
Multi-Vehicle Crashes
Rear End
0
2
2
Head On
0
1
1
Sideswipe Same Dir.
1
1
2
Right Angle
0
4
4
Right Turn Through
0
1
1
Other/Unknown Multi
0
1
1
Total Multi Vehicle
1
10
11
Single-Vehicle Crashes
Hit Pedestrian
2
1
3
Hit Animal
0
2
2
Hit Object
2
15
17
Non Collision
1
7
8
Other Unknown Single
0
0
0
Total Single Vehicle
5
25
30
Total Crashes
6
35
41
Table 128 High Priority Crash Type by Crash Severity – Great Southern
Crash Severity
Fatal
Hospitalisation
Total Serious
Crash Type
n
n
n
Intersection
0
7
7
Run Off Road
3
21
24
Head On
0
1
1
Other
3
7
10
Total Crashes
6
35
41
Note: High Priority Crash Types are not mutually exclusive and therefore some crashes may be counted more than once
and may sum to greater than the total number of crashes.

Reported Road Crashes in Western Australia 2011 106
6.5 Kimberley
There were nine fatal crashes in the Kimberley region during 2011, in which 11 people died.
These numbers were higher than the previous three years. Over two-thirds (65%) of the persons
killed or seriously injured where gender was known were males. The age-specific rate for persons
killed or seriously injured was the highest for persons aged between 17 and 24 years (Table 129).
Passengers accounted for 49% of persons killed or seriously injured in the Kimberley region,
followed by drivers (37%) and motorcyclists (8%) (Figure 25).
The Kimberley region had the second lowest percentage of serious crashes that were speed
related (14%) (Table 116). The Kimberley had the highest percentage of serious crashes that
were alcohol related (22%) and the third highest alcohol-related serious crash rate (21.2 per
100,000 population) (Table 117 and Map 7). Two of the nine fatal crashes involved driver/riders
with very high alcohol readings of greater than 0.15 g/100mL (Table 130). The Kimberley also had
the highest percentage of motor vehicle occupants killed or seriously injured who were not wearing
a seat belt (40%) and the highest KSI rate for not wearing a seat belt (50.4 per 100,000
population) (Table 118 and Map 8). Seven of the nine motor vehicle occupant fatalities, were not
wearing a seat belt (Table 131).
The Kimberley region had the second highest percentage of ‘Hit Pedestrian’ serious crashes
(10%) of all the regions (Table 119). The majority of serious crashes in the Kimberley were
single-vehicle crashes (81%). Of the serious crashes in the Kimberley, 36% were ‘Non Collision’
crashes and 26% were ‘Hit Object’ crashes (Table 132). Two thirds (67%) of the serious crashes
in the Kimberley were ‘Run Off Road’ crashes (Table 133).
Figure 24 Fatal Crashes and Fatalities by Year – Kimberley

Reported Road Crashes in Western Australia 2011 107
Table 129 Persons Killed or Seriously Injured By Age Group And Gender - Kimberley
Gender
Percentage of Persons Killed
or Seriously Injured
Percentage of
Population
Age-Specific
Rate
2
Male
Female
Total
1
Age Group
n
n
n
%
%
Rate
0 - 16
4
4
9
14.3
27.1
88.2
17 - 24
11
4
16
25.4
12.0
352.6
25 - 59
18
9
33
52.4
52.7
166.3
60 and over
2
1
3
4.8
8.2
97.4
Unknown Age
1
1
2
3.2
N/A
N/A
Total Persons
KSI
36
19
63
100.0
100.0
167.2
Source: Population data from Australian Bureau of Statistics, Customised report, 2013
1. Includes persons of unknown gender.
2. Age-specific KSI rates per 100,000 population.
Figure 25 Persons Killed or Seriously Injured by Road User Type – Kimberley

Reported Road Crashes in Western Australia 2011 108
Table 130 Highest Driver/Rider BAC in Crash by Crash Severity, Police-Attended Crashes –
Kimberley
Highest Driver/Rider BAC
in Crash (g/100mL)
Crash Severity
Fatal
Hospitalisation
Total Serious
n
n
n
Nil
3
19
22
< 0.05
0
1
1
0.05 to < 0.08
1
0
1
0.08 to < 0.15
1
3
4
0.15
2
1
3
Subtotal 0.05
4
4
8
Unknown
2
4
6
Total Crashes
9
28
37
Table 131 Seat Belt Usage by Injury Severity, Police-Attended Crashes - Kimberley
Injury Severity
Fatal
Serious
Total Persons
KSI
Seat Belt Usage
n
n
n
Worn
1
21
22
Not Worn
7
12
19
Unknown
1
5
6
Total Motor Vehicle Occupants
9
38
47
Table 132 Crash Nature by Crash Severity – Kimberley
Crash Severity
Fatal
Hospitalisation
Total Serious
Crash Nature
n
n
n
Multi-Vehicle Crashes
Rear End
0
1
1
Head On
0
1
1
Sideswipe Same Dir.
0
0
0
Right Angle
0
1
1
Right Turn Through
0
2
2
Other/Unknown Multi
0
3
3
Total Multi Vehicle
0
8
8
Single-Vehicle Crashes
Hit Pedestrian
2
2
4
Hit Animal
0
0
0
Hit Object
2
9
11
Non Collision
4
11
15
Other/Unknown Single
1
3
4
Total Single Vehicle
9
25
34
Total Crashes
9
33
42

Reported Road Crashes in Western Australia 2011 109
Table 133 High Priority Crash Type by Crash Severity – Kimberley
Crash Severity
Fatal
Hospitalisation
Total Serious
Crash Type
n
n
n
Intersection
1
5
6
Run Off Road
6
22
28
Head On
0
1
1
Other
2
6
8
Total Crashes
9
33
42
Note: High Priority Crash Types are not mutually exclusive and, therefore, some crashes may be counted more than once
and may sum to greater than the total number of crashes.

Reported Road Crashes in Western Australia 2011 110
6.6 Mid West
There were eight fatal crashes in the Mid West region during 2011, in which eight people were
killed. These numbers were lower than the previous year and similar to 2008 and 2009. Of
persons killed or seriously injured where gender was known, 73% were males. Persons aged 17
to 24 years had the highest age-specific rate for persons killed or seriously injured (Table 134).
Drivers accounted for 47% of persons killed or seriously injured, followed by passengers (30%)
and pedestrians (11%) (Figure 27).
The Mid West region had the second highest percentage of serious crashes that were speed
related of all regions (18%), and the speed-related serious crash rate was 22.1 per 100,000
population (Table 116 and Map 6). The region also had the equal second highest percentage of
serious crashes that were alcohol related (18%) and the second highest alcohol-related serious
crash rate (22.1 per 100,000 population) (Table 117 and Map 7). Three of the eight fatal crashes
in the Mid West region were alcohol-related, with two having a very high alcohol reading of greater
than 0.15 g/100mL (Table 136). Fifteen per cent of persons killed or seriously injured in the Mid
West region were not wearing a seat belt (Table 118), with three of the five fatalities in the Mid
West region not wearing seat belts (Table 137).
Almost three quarters (70%) of serious crashes in the Mid West were single-vehicle crashes. The
Mid West had the highest percentage of ‘Head On’ and ‘Hit Pedestrian’ crashes of all regions (11%
and 13%, respectively (Table 119 and Table 138). Over half (52%) of serious crashes in the
Mid West were ‘Run Off Road’ crashes (Table 139).
Figure 26 Fatal Crashes and Fatalities by Year - Mid West

Reported Road Crashes in Western Australia 2011 111
Table 134 Persons Killed or Seriously Injured by Age Group and Gender - Mid West
Gender
Percentage of Persons Killed
or Seriously Injured
Percentage of
Population
Age-Specific
Rate
2
Male
Female
Total
1
Age Group
n
n
n
%
%
Rate
0 - 16
4
5
11
12.1
24.3
83.4
17 - 24
17
8
31
34.1
9.9
578.0
25 - 59
35
8
47
51.6
47.3
182.6
60 and over
2
0
2
2.2
18.5
19.8
Unknown Age
0
0
0
0.0
N/A
N/A
Total Persons
KSI
58
21
91
100.0
100.0
167.4
Source: Population data from Australian Bureau of Statistics, Customised report, 2013.
1. Includes persons of unknown gender.
2. Age-specific KSI rates per 100,000 population.
Figure 27 Persons Killed or Seriously Injured by Road User Type - Mid West

Reported Road Crashes in Western Australia 2011 112
Table 135 Speed a Factor by Crash Severity, Police-Attended Crashes – Mid West
Speed a Factor in Police-
Attended Crashes
Crash Severity
Fatal
Hospitalisation
Total Serious
n
n
n
Yes
2
10
12
No
5
30
35
Unknown
1
19
20
Total Police-Attended Crashes
8
59
67
Table 136 Highest Driver/Rider BAC in Crash by Crash Severity, Police-Attended Crashes –
Mid West
Highest Driver/Rider BAC
in Crash (g/100mL)
Crash Severity
Fatal
Hospitalisation
Total Serious
n
n
n
Nil
5
40
45
< 0.05
0
1
1
0.05 to < 0.08
1
3
4
0.08 to < 0.15
0
4
4
0.15
2
2
4
Subtotal 0.05
3
9
12
Unknown
0
9
9
Total Crashes
8
59
67
Table 137 Seat Belt Usage by Injury Severity, Police-Attended Crashes - Mid West
Injury Severity
Fatal
Serious
Total Persons KSI
Seat Belt Usage
n
n
n
Worn
1
48
49
Not Worn
3
7
10
Unknown
1
6
7
Total Motor Vehicle
Occupants
5
61
66

Reported Road Crashes in Western Australia 2011 113
Table 138 Crash Nature by Crash Severity – Mid West
Crash Severity
Fatal
Hospitalisation
Total Serious
Crash Nature
n
n
n
Multi-Vehicle Crashes
Rear End
0
0
0
Head On
1
7
8
Sideswipe Same Dir.
0
0
0
Right Angle
0
8
8
Right Turn Through
0
0
0
Other/Unknown Multi
2
3
5
Total Multi Vehicle
3
18
21
Single-Vehicle Crashes
Hit Pedestrian
1
8
9
Hit Animal
1
0
1
Hit Object
2
23
25
Non Collision
1
13
14
Other/Unknown Single
0
1
1
Total Single Vehicle
5
45
50
Total Crashes
8
63
71
Table 139 High Priority Crash Type by Crash Severity – Mid West
Crash Severity
Fatal
Hospitalisation
Total Serious
Crash Type
n
n
n
Intersection
0
13
13
Run Off Road
4
33
37
Head On
1
7
8
Other
3
12
15
Total Crashes
8
63
71
Note: High Priority Crash Types are not mutually exclusive and, therefore, some crashes may be counted more than once
and may sum to greater than the total number of crashes.

Reported Road Crashes in Western Australia 2011 114
6.7 Pilbara-Gascoyne
There were seven fatal crashes in the Pilbara-Gascoyne region during 2011, in which eight people
were killed. These numbers are the lowest since 2003. Of persons killed or seriously injured with
known gender, 72% were males. While 11% of the Pilbara-Gascoyne population were aged 17 to
24 years, this age group made up 24% of persons killed or seriously injured and had the highest
age-specific rate for persons killed or seriously injured (Table 140). Drivers accounted for almost
half (46%) of persons killed or seriously injured, followed by passengers (36%) and motorcyclists
(12%) (Figure 29).
The Pilbara-Gascoyne had the highest percentage of police-attended serious crashes that were
speed related (21%) of all the regions. This region also had the second highest percentage of
serious crashes that were alcohol related (18%) (Table 117). The Pilbara-Gascoyne had the third
highest percentage of motor vehicle occupants killed or seriously injured in police-attended
crashes in the Pilbara-Gascoyne region who did not wear a seat belt (14%) (Table 118) and two of
the six motor vehicle occupant fatalities were not wearing a seat belt (Table 143). The Pilbara-
Gascoyne had the third lowest non-Metropolitan rate of those killed or seriously injured who were
not wearing a seat belt (13.8 per 100,000 population) (Map 8).
The Pilbara-Gascoyne region had the fourth highest multi-vehicle serious crash rate of all the
non-Metropolitan regions (27.6 per 100,000 population) (Map 4). The majority of serious crashes
in the Pilbara-Gascoyne region (72%) were single-vehicle crashes and 33% were ‘Non Collision’
crashes (Table 144). Seventeen per cent of serious crashes in the Pilbara-Gascoyne were
‘Intersection’ crashes and 58% were ‘Run Off Road’ crashes (Table 145).
Figure 28 Fatal Crashes and Fatalities by Year - Pilbara-Gascoyne

Reported Road Crashes in Western Australia 2011 115
Table 140 Persons Killed or Seriously Injured by Age Group and Gender - Pilbara-Gascoyne
Gender
Percentage of Persons Killed
or Seriously Injured
Percentage of
Population
Age-Specific
Rate
2
Male
Female
Total
1
Age Group
n
n
n
%
%
Rate
0 - 16
7
3
10
10.1
21.0
65.9
17 - 24
6
14
24
24.2
11.1
298.5
25 - 59
44
8
55
55.6
61.2
124.1
60 and over
6
0
6
6.1
6.7
124.2
Unknown Age
2
0
4
4.0
N/A
N/A
Total Persons
KSI
65
25
99
100.0
100.0
136.8
Source: Population data from Australian Bureau of Statistics, Customised report, 2013.
1. Includes persons of unknown gender.
2. Age-specific KSI rates per 100,000 population.
Figure 29 Persons Killed or Seriously Injured by Road User Type - Pilbara-Gascoyne

Reported Road Crashes in Western Australia 2011 116
Table 141 Speed a Factor by Crash Severity, Police-Attended Crashes – Pilbara-Gascoyne
Speed a Factor in Police-
Attended Crashes
Crash Severity
Fatal
Hospitalisation
Total Serious
n
n
n
Yes
0
13
13
No
4
21
25
Unknown
3
20
23
Total Police-Attended Crashes
7
54
61
Table 142 Highest Driver/Rider BAC in Crash by Crash Severity, Police-Attended Crashes –
Pilbara-Gascoyne
Highest Driver/Rider BAC
in Crash (g/100mL)
Crash Severity
Fatal
Hospitalisation
Total Serious
n
n
n
Nil
5
34
39
< 0.05
0
0
0
0.05 to < 0.08
0
2
2
0.08 to < 0.15
0
5
5
0.15
2
2
4
Subtotal 0.05
2
9
11
Unknown
0
11
11
Total Crashes
7
54
61
Table 143 Seat Belt Usage by Injury Severity, Police-Attended Crashes - Pilbara-Gascoyne
Injury Severity
Fatal
Serious
Total Persons KSI
Seat Belt Usage
n
n
n
Worn
2
52
54
Not Worn
2
8
10
Unknown
2
5
7
Total Motor Vehicle
Occupants
6
65
71

Reported Road Crashes in Western Australia 2011 117
Table 144 Crash Nature by Crash Severity – Pilbara-Gascoyne
Crash Severity
Fatal
Hospitalisation
Total Serious
Crash Nature
n
n
n
Multi-Vehicle Crashes
Rear End
0
5
5
Head On
0
5
5
Sideswipe Same Dir.
0
2
2
Right Angle
1
4
5
Right Turn Through
0
0
0
Other/Unknown Multi
1
2
3
Total Multi Vehicle
2
18
20
Single-Vehicle Crashes
Hit Pedestrian
2
2
4
Hit Animal
0
3
3
Hit Object
0
19
19
Non Collision
3
21
24
Other/Unknown Single
0
2
2
Total Single Vehicle
5
47
52
Total Crashes
7
65
72
Table 145 High Priority Crash Type by Crash Severity – Pilbara-Gascoyne
Crash Severity
Fatal
Hospitalisation
Total Serious
Crash Type
n
n
n
Intersection
2
10
12
Run Off Road
2
40
42
Head On
0
5
5
Other
3
15
18
Total Crashes
7
65
72
Note: High Priority Crash Types are not mutually exclusive and, therefore, some crashes may be counted more than once
and may sum to greater than the total number of crashes.
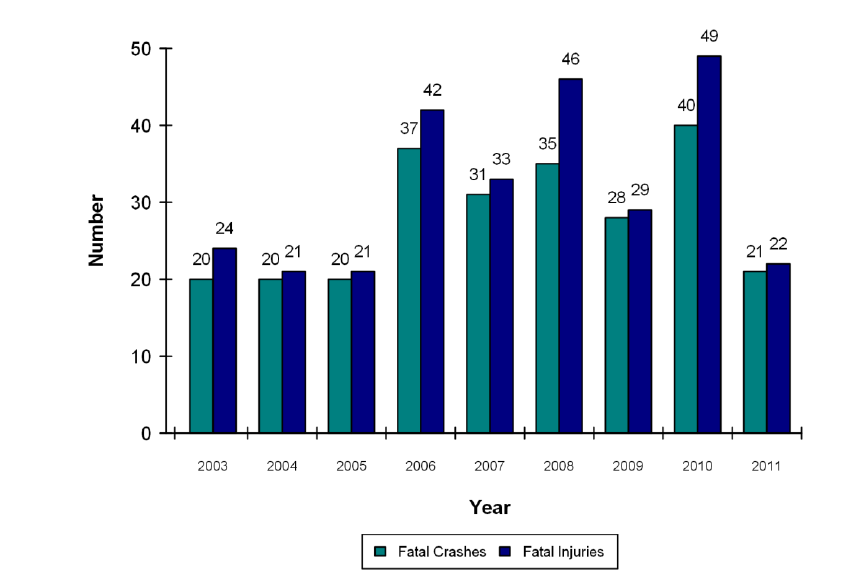
Reported Road Crashes in Western Australia 2011 118
6.8 South West
There were 21 fatal crashes in the South West region during 2011, in which 22 people died.
These numbers were the lowest in the last six years. Of persons killed or seriously injured where
gender was known, 66% were males. While less than 10% of the South West population were
aged 17 to 24 years, this group made up 29% of persons killed or seriously injured and had the
highest age-specific rate for persons killed or seriously injured (Table 146). Drivers accounted for
50% of persons killed or seriously injured, while 23% were passengers and 16% were
motorcyclists (Figure 31).
Fourteen per cent of serious crashes in the South West region were speed related and the
speed-related serious crash rate was 13.1 per 100,000 population (Table 116 and Map 6). Ten
per cent of serious crashes in the South West region were alcohol related (Table 117). Of the
non-Metropolitan regions, the South West had the fourth lowest percentage and second lowest
rate (8% and 7.1 per 100,000 population, respectively) of those killed or seriously injured while not
wearing a seat belt (Table 118 and Map 8).
Over half (60%) of the serious crashes in the South West region were single-vehicle crashes. Of
the non-Metropolitan regions, the South West had the second highest percentage of ‘Right Angle’
crashes (13%) and the second highest percentage of ‘Hit Pedestrian’ crashes (9%) (Table 119 and
Table 147). Approximately one third (33%) of serious crashes in the South West were
‘Intersection’ crashes, 46% were ‘Run Off Road’ crashes and 3% were ‘Head On’ crashes (Table
148).
Figure 30 Fatal Crashes and Fatalities by Year - South West

Reported Road Crashes in Western Australia 2011 119
Table 146 Persons Killed or Seriously Injured by Age Group by Gender - South West
Gender
Percentage of Persons Killed
or Seriously Injured
Percentage of
Population
Age-Specific
Rate
2
Male
Female
Total
1
Age Group
n
n
n
%
%
Rate
0 - 16
14
3
20
6.3
22.8
34.7
17 - 24
54
23
91
28.8
9.2
390.3
25 - 59
101
48
158
50.0
45.9
136.1
60 and over
14
18
36
11.4
22.0
64.6
Unknown Age
5
4
11
3.5
0.0
N/A
Total Persons
KSI
188
96
316
100.0
100.0
125.0
Source: Population data from Australian Bureau of Statistics, Customised report, 2013.
1. Includes persons of unknown gender.
2. Age-specific KSI rates per 100,000 population.
Figure 31 Persons Killed or Seriously Injured by Road User Type - South West

Reported Road Crashes in Western Australia 2011 120
Table 147 Crash Nature by Crash Severity - South West
Crash Severity
Fatal
Hospitalisation
Total Serious
Crash Nature
n
n
n
Multi-Vehicle Crashes
Rear End
1
24
25
Head On
0
8
8
Sideswipe Same Dir.
1
5
6
Right Angle
2
30
32
Right Turn Through
0
19
19
Other/Unknown Multi
0
10
10
Total Multi Vehicle
4
96
100
Single-Vehicle Crashes
Hit Pedestrian
2
22
24
Hit Animal
0
1
1
Hit Object
13
82
95
Non Collision
1
27
28
Other/Unknown Single
1
4
5
Total Single Vehicle
17
136
153
Total Crashes
21
232
253
Table 148 High Priority Crash Type by Crash Severity – South West
Crash Severity
Fatal
Hospitalisation
Total Serious
Crash Type
n
n
n
Intersection
4
79
83
Run Off Road
13
104
117
Head On
0
8
8
Other
4
51
55
Total Crashes
21
232
253
Note: High Priority Crash Types are not mutually exclusive and, therefore, some crashes may be counted more than once
and may sum to greater than the total number of crashes.
Reported Road Crashes in Western Australia 2011 121
6.9 Wheatbelt North
There were 27 fatal crashes in the Wheatbelt North region during 2011, in which 29 people were
killed. These numbers are the highest since before 2003. Of persons killed or seriously injured
where gender was known, 67% were males. While only 8% of the Wheatbelt North population
were aged 17 to 24 years, 22% of persons killed or seriously injured were in this age group, which
also had the highest age-specific rate for persons killed or seriously injured (Table 149). Drivers
accounted for 57% of persons killed or seriously injured, followed by passengers (25%) and
motorcyclists (15%) (Figure 33). The Wheatbelt North had the highest overall serious crash rate
(241.4 per 100,000 population) and the second highest age and gender standardised KSI rate
(307.6 per 100,000 population) (Map 3 and Map 9).
Fifteen per cent of police-attended serious crahes in the Wheatbelt North were speed related, and
the Wheatbelt North had the highest speed-related serious crash rate at 33.9 per 100,000
population (Table 116 and Map 6). Eight of the 27 fatal crashes were speed related (Table 150).
Sixteen per cent of serious crashes in the Wheatbelt North were alcohol related and this region
had the highest alcohol-related serious crash rate (35.9 per 100,000 population) (Table 117 and
Map 7). Of the non-Metropolitan regions the Wheatbelt North had the second lowest percentage
of motor vehicle occupants killed or seriously injured in police-attended crashes who were not
wearing a seat belt (8%) (Table 118).
The Wheatbelt North region had the second highest single-vehicle serious crash rate (181.6 per
100,000 population) (Map 5). Of the serious crashes in the Wheatbelt North, 75% were
single-vehicle crashes and 50% were ‘Hit Object’ crashes (Table 152). The Wheatbelt North
region had the third lowest percentage of ‘Intersection’ serious crashes (17%), and the third
highest percentage of ‘Run Off Road’ crashes (65%) (Table 119).

Reported Road Crashes in Western Australia 2011 122
Figure 32 Fatal Crashes and Fatalities by Year - Wheatbelt North
Table 149 Persons Killed or Seriously Injured by Age Group and Gender - Wheatbelt North
Gender
Percentage of Persons Killed
or Seriously Injured
Percentage of
Population
Age-Specific
Rate
2
Male
Female
Total
1
Age Group
n
n
n
%
%
Rate
0 - 16
1
2
6
3.6
22.8
52.4
17 - 24
16
12
36
21.8
8.0
901.4
25 - 59
57
25
87
52.7
46.6
372.7
60 and over
23
7
31
18.8
22.6
273.4
Unknown Age
1
2
5
3.0
0.0
N/A
Total Persons
KSI
98
48
165
100.0
100.0
329.2
Source: Population data from Australian Bureau of Statistics, Customised report, 2013.
1. Includes persons of unknown gender.
2. Age-specific KSI rates per 100,000 population.

Reported Road Crashes in Western Australia 2011 123
Figure 33 Persons Killed or Seriously Injured by Road User Type - Wheatbelt North
Table 150 Speed a Factor by Crash Severity, Police-Attended Crashes – Wheatbelt North
Speed a Factor in Police-
Attended Crashes
Crash Severity
Fatal
Hospitalisation
Total Serious
n
n
n
Yes
8
9
17
No
6
37
43
Unknown
13
39
52
Total Police-Attended Crashes
27
85
112

Reported Road Crashes in Western Australia 2011 124
Table 151 Highest Driver/Rider BAC in Crash by Crash Severity, Police-Attended Crashes –
Wheatbelt North
Highest Driver/Rider BAC
in Crash (g/100mL)
Crash Severity
Fatal
Hospitalisation
Total Serious
n
n
n
Nil
18
48
66
< 0.05
1
0
1
0.05 to < 0.08
0
1
1
0.08 to < 0.15
3
8
11
0.15
4
2
6
Subtotal 0.05
7
11
18
Unknown
1
26
27
Total Crashes
27
85
112
Table 152 Crash Nature by Crash Severity – Wheatbelt North
Crash Severity
Fatal
Hospitalisation
Total Serious
Crash Nature
n
n
n
Multi-Vehicle Crashes
Rear End
0
3
3
Head On
7
6
13
Sideswipe Same Dir.
0
2
2
Right Angle
0
4
4
Right Turn Through
0
1
1
Other/Unknown Multi
3
4
7
Total Multi Vehicle
10
20
30
Single-Vehicle Crashes
Hit Pedestrian
0
2
2
Hit Animal
0
3
3
Hit Object
11
50
61
Non Collision
4
17
21
Other/Unknown Single
2
2
4
Total Single Vehicle
17
74
91
Total Crashes
27
94
121
Table 153 High Priority Crash Type by Crash Severity – Wheatbelt North
Crash Severity
Fatal
Hospitalisation
Total Serious
Crash Type
n
n
n
Intersection
2
18
20
Run Off Road
15
64
79
Head On
7
6
13
Other
3
11
14
Total Crashes
27
94
121
Note: High Priority Crash Types are not mutually exclusive and, therefore, some crashes may be counted more than once
and may sum to greater than the total number of crashes.

Reported Road Crashes in Western Australia 2011 125
6.10 Wheatbelt South
There were 10 fatal crashes in the Wheatbelt South region during 2010, in which 10 people died.
These numbers were higher than in 2009 and 2010 (Figure 34). Of persons killed or seriously
injured where gender was known, 66% were males. Persons aged between 17 and 24 years in
the Wheatbelt South region exhibited the highest age-specific rate for persons killed or seriously
injured in all regions (Table 154). Over half (57%) of persons killed or seriously injured were
drivers, 28% were passengers and 15% were motorcyclists (Figure 35). There were no bicyclists
or pedestrians killed or seriously injured in the Wheatbelt South in 2011. The Wheatbelt South had
the second highest overall serious crash rate (219.9 per 100,000 population) and the highest age
and gender standardised KSI rate (311.3 per 100,000 population) (Map 3 and Map 9).
Fifteen per cent of police-attended serious crashes in the Wheatbelt South were speed related and
this region had the second highest speed-related serious crash rate out of all regions (30.8 per
100,000 population) (Table 116 and Map 6). In the Wheatbelt South, 9% of serious crashes were
alcohol related, and this region had the fourth highest alcohol-related serious crash rate of 17.6 per
100,000 population (Table 117 and Map 7). The percentage of motor vehicle occupants killed or
seriously injured who did not wear a seat belt was 13% (Table 118).
The Wheatbelt South had the highest single-vehicle serious crash rate of all regions (202.3 per
100,000 population) and 92% of serious crashes were single-vehicle crashes. 10% of serious
crashes in the Wheatbelt South were ‘Intersection’ crashes, while 80% were ‘Run Off Road’
crashes, which was the highest of all regions (Table 119). There were no serious ‘Head On’
crashes in the Wheatbelt South region in 2011 (Table 158).
Figure 34 Fatal Crashes and Fatalities by Year - Wheatbelt South

Reported Road Crashes in Western Australia 2011 126
Table 154 Persons Killed or Seriously Injured by Age Group and Gender - Wheatbelt South
Gender
Percentage of Persons Killed
or Seriously Injured
Percentage of
Population
Age-Specific
Rate
2
Male
Female
Total
1
Age Group
n
n
n
%
%
Rate
0 - 16
0
1
3
4.6
23.0
57.4
17 - 24
12
6
21
32.3
6.8
1,359.2
25 - 59
23
6
32
49.2
46.5
302.8
60 and over
2
6
8
12.3
23.7
148.2
Unknown Age
0
0
1
1.5
N/A
N/A
Total Persons
KSI
37
19
65
100.0
100.0
285.9
Source: Population data from Australian Bureau of Statistics, Customised report, 2013.
1. Includes persons of unknown gender.
2. Age-specific KSI rates per 100,000 population.
Figure 35 Persons Killed or Seriously Injured by Road User Type - Wheatbelt South
Reported Road Crashes in Western Australia 2011 127
Table 155 Speed a Factor by Crash Severity, Police-Attended Crashes – Wheatbelt South
Speed a Factor in Police-
Attended Crashes
Crash Severity
Fatal
Hospitalisation
Total Serious
n
n
n
Yes
2
5
7
No
1
15
16
Unknown
7
16
23
Total Police-Attended Crashes
10
36
46
Table 156 Seat Belt Usage by Injury Severity, Police-Attended Crashes - Wheatbelt South
Injury Severity
Fatal
Serious
Total Persons KSI
Seat Belt Usage
n
n
n
Worn
7
33
40
Not Worn
2
5
7
Unknown
0
5
5
Total Motor Vehicle
Occupants
9
43
52
Table 157 Crash Nature by Crash Severity – Wheatbelt South
Crash Severity
Fatal
Hospitalisation
Total Serious
Crash Nature
n
n
n
Multi-Vehicle Crashes
Rear End
0
2
2
Head On
0
0
0
Sideswipe Same Dir.
0
1
1
Right Angle
0
1
1
Right Turn Through
0
0
0
Other/Unknown Multi
0
0
0
Total Multi Vehicle
0
4
4
Single-Vehicle Crashes
Hit Pedestrian
0
0
0
Hit Animal
0
1
1
Hit Object
9
17
26
Non Collision
1
17
18
Other/Unknown Single
0
1
1
Total Single Vehicle
10
36
46
Total Crashes
10
40
50

Reported Road Crashes in Western Australia 2011 128
Table 158 High Priority Crash Type by Crash Severity – Wheatbelt South
Crash Severity
Fatal
Hospitalisation
Total Serious
Crash Type
n
n
n
Intersection
0
5
5
Run Off Road
10
30
40
Head On
0
0
0
Other
0
7
7
Total Crashes
10
40
50
Note: High Priority Crash Types are not mutually exclusive and, therefore, some crashes may be counted more than once
and may sum to greater than the total number of crashes.

Reported Road Crashes in Western Australia 2011 129
7. HOSPITAL INPATIENT DATA
This section presents information on road traffic casualties who were admitted to public and private
hospitals in Western Australia during 2011. The data was extracted on the 18
th
of April 2013 by
the WA Hospital Morbidity Data Collections, Data Integrity, Performance Activity & Quality Division
of the Western Australian Department of Health. Hospital inpatient data is captured using the
Hospital Morbidity Data System. This data offers an alternative data source to the police-reported
data, and it should be noted that some definitions may vary.
The hospital inpatient data presented refers to the number of persons admitted to hospital and not
the number of hospital admissions. Multiple admissions by patients often occur for the same injury
event, resulting in a need to identify and exclude re-admissions in order to minimise over-counting.
Those identified as new injury events are accepted as new admissions and thus, included. If more
than 12 months have elapsed since the patient’s previous relevant admission, any subsequent
hospital admissions are considered to be a new injury event and thus included.
The hospital inpatient data includes only those records where the external cause of injury code
indicates that the injuries are the result of a traffic crash (i.e. where the ICD-10-AM external cause
of injury code is in the range V00.0 to V89.9 and is identified as a traffic crash). A traffic crash is
defined by the National Centre for Classification in Health (NCCH) for ICD-10-AM as “any vehicle
crash occurring on a public highway; where a public highway is specified as a traffic way or street
which includes the entire width between property lines of land open to the public as a matter of
right or custom for purposes of moving persons or property from one place to another”.
The road user types referred to in the police-reported section of this report are defined differently
to the road user groups identified by ICD-10-AM and, therefore, are not directly comparable.
Hospital inpatient data may include the mode of transport but not whether the person injured was
the driver or passenger. This is normally due to insufficient information being provided when the
patient is admitted to hospital. In particular, the hospital inpatient data did not record for a
relatively large number of motor vehicle occupants whether they were drivers or passengers. For
police-reported data, nearly all road users who were identified as motor vehicle occupants were
also further identified as either the driver or passenger.
The hospital inpatient data also differs from police-reported data, in that road users who die at the
scene of a crash or en-route to hospital are not admitted to hospital and, therefore, are not
included in this section of the report. Hence, the number of fatalities reported by hospitals is lower
than the true number of people killed in road crashes each year. Additionally, only those
casualties requiring admission to hospital are included in inpatient data. Patients presenting to
Accident and Emergency departments, but not admitted to hospital, are not included in hospital
inpatient data.
For some road user groups (motorcyclists, bicyclists and pedestrians), there are considerably
more hospital admissions recorded than the corresponding number of police-reported
hospitalisations. One explanation for this may be that these road user groups tend to under-report
their crashes to police, but may still require treatment in hospital for their injuries. It is not known
why this under-reporting to police exists, but it has been suggested that persons involved in these
crashes may not be aware that they are required to report the crash to police, may not be able to

Reported Road Crashes in Western Australia 2011 130
report their crash, or may have chosen not to report the crash to police. In addition, some
casualties may have occurred off road, but been classified as on road due to incorrect or
insufficient information being provided when the patient was admitted.
Table 159 Hospital Inpatients by Injury Severity by Year
Year
2006
2007
2008
2009
2010
2011
2011 Change
from 2010
Injury Severity
n
n
n
n
n
n
%
Fatal
1
26
28
29
30
22
32
45.5
Serious
3,361
3,580
3,811
3,935
3,995
4,202
5.2
Total Hospital Inpatients
3,387
3,608
3,840
3,965
4,017
4,234
5.4
1. The number of fatalities excludes persons killed in road crashes who died before reaching a hospital.
Table 160 Hospital Inpatients by Road User by Year
Year
2006
2007
2008
2009
2010
2011
2011 Change
from 2010
Road User Group
n
n
n
n
n
n
%
Motor Vehicle - Driver
935
1,011
1,069
1,056
1,138
1,337
17.49
Motor Vehicle - Passenger
625
638
646
683
604
623
3.15
Motor Vehicle - Occupant-Unknown
308
308
320
317
264
273
3.41
Motor Cyclist
713
761
854
889
944
946
0.21
Pedal Cyclist
387
470
491
590
592
586
-1.01
Pedestrian
271
258
277
317
333
337
1.20
Other/Unknown
148
162
183
113
142
132
-7.04
Total Hospital Inpatients
3,387
3,608
3,840
3,965
4,017
4,234
5.40
Table 161 Hospital Inpatients by Age Group and Gender
Gender
Male
Female
Total
Age
n
Col %
n
Col %
n
Col %
0 - 11
118
4.3
78
5.3
196
4.6
12 - 16
184
6.7
84
5.7
268
6.3
17 - 20
340
12.3
155
10.5
495
11.7
21 - 24
324
11.7
138
9.4
462
10.9
25 - 29
301
10.9
166
11.3
467
11.0
30 - 39
460
16.6
176
12.0
636
15.0
40 - 49
403
14.6
200
13.6
603
14.2
50 - 59
304
11.0
159
10.8
463
10.9
60 and over
330
11.9
314
21.4
644
15.2
Total Hospital Inpatients
2,764
100.0
1,470
100.0
4,234
100.0

Reported Road Crashes in Western Australia 2011 131
Table 162 Hospital Inpatients by Road User Group by Gender
Gender
Male
Female
Total
Road User Group
n
Col %
n
Col %
n
Col %
Motor Vehicle Driver
740
26.8
597
40.6
1,337
31.6
Motor Vehicle Passenger
268
9.7
355
24.1
623
14.7
Motor Vehicle Occupant Unknown
134
4.8
139
9.5
273
6.4
Motorcyclist
855
30.9
91
6.2
946
22.3
Bicyclist
460
16.6
126
8.6
586
13.8
Pedestrian
218
7.9
119
8.1
337
8.0
Other/Unknown
89
3.2
43
2.9
132
3.1
Total Hospital Inpatients
2,764
100.0
1,470
100.0
4,234
100.0
Table 163 Hospital Inpatients by Road User Group by Age Group
Road User Group
Motor Vehicle
Driver
Motor Vehicle
Passenger
Motor Vehicle
Occupant Unk
Motorcyclist
Bicyclist
Pedestrian
Other/
Unknown
Total
Age
n
Col %
n
Col %
n
Col %
n
Col %
n
Col %
n
Col %
n
Col %
n
Col %
0 – 16
1
9
0.7
127
20.4
15
5.5
74
7.8
145
24.7
82
24.4
12
6.1
464
10.9
17 - 20
168
12.6
98
15.7
19
7.0
121
12.8
47
8.0
31
9.2
11
8.3
495
11.7
21 - 24
156
11.7
74
11.9
24
8.8
124
13.1
37
6.3
39
11.6
8
6.1
462
10.9
25 - 29
160
12.0
80
12.8
27
9.9
109
11.5
41
7.0
36
10.7
14
10.6
467
11.0
30 - 39
219
16.4
50
8.0
28
10.3
201
21.2
85
14.5
40
11.9
13
9.8
636
15.0
40 - 49
205
15.3
56
9.0
36
13.2
162
17.1
88
15.0
31
9.2
25
18.9
603
14.2
50 - 59
172
12.9
43
6.9
23
8.4
104
11.0
79
13.5
22
6.5
20
15.2
463
10.9
60 and over
248
18.5
95
15.2
101
37.0
51
5.4
64
10.9
56
16.6
29
22.0
644
15.2
Total
Hospital
Inpatients
1,337
100.0
623
100.0
273
100.0
946
100.0
586
100.0
337
100.0
132
100.0
4234
100.0
1
The 0 – 11 and 12 – 16 year old age groups have been combined in this table due to confidentially reasons.
Table 164 Hospital Inpatients by Indigenous Status by Year
Year
2006
2007
2008
2009
2010
2011
2011 Change
from 2010
Indigenous Status
n
n
n
n
n
n
%
Non-indigenous
3,110
3,311
3,565
3,657
3,745
3,957
1.8
Indigenous
277
297
275
308
272
277
5.7
Total Hospital
Inpatients
3,387
3,608
3,840
3,965
4,017
4,234
5.4
Table 165 Hospital Inpatients by Indigenous Status by Gender
Indigenous Status
Non-Indigenous
Indigenous
Total
Gender
n
Col %
n
Col %
n
Col %
Male
2,572
65.0
192
69.3
2,764
65.3
Female
1,385
35.0
85
30.7
1,470
34.7
Total Hospital Inpatients
3,957
100.0
277
100.0
4,234
100.0

Reported Road Crashes in Western Australia 2011 132
Figure 36 Hospital Inpatients by Indigenous Status by Age Group
Table 166 Hospital Inpatients by Indigenous Status by Age Group
Indigenous Status
Non-Indigenous
Indigenous
Total
Age Group
n
Col %
n
Col %
n
Col %
0 - 11
155
3.9
41
14.8
196
4.6
12 - 16
234
5.9
34
12.3
268
6.3
17 - 20
455
11.5
40
14.4
495
11.7
21 - 24
427
10.8
35
12.6
462
10.9
25 - 29
433
10.9
34
12.3
467
11.0
30 - 39
603
15.2
33
11.9
636
15.0
40 - 49
569
14.4
34
12.3
603
14.2
50 - 59
444
11.2
19
6.9
463
10.9
60 and over
637
16.1
7
2.5
644
15.2
Total Hospital Inpatients
3,957
100.0
277
100.0
4,234
100.0

Reported Road Crashes in Western Australia 2011 133
Figure 37 Hospital Inpatients by Indigenous Status by Road User Group
Table 167 Hospital Inpatients by Indigenous Status by Road User Group
Indigenous Status
Non-Indigenous
Indigenous
Total
Road User Group
n
Col %
n
Col %
n
Col %
Motor Vehicle Driver
1,284
32.4
53
19.1
1,337
31.6
Motor Vehicle Passenger
552
13.9
71
25.6
623
14.7
Motor Vehicle Occupant Unk
247
6.2
26
9.4
273
6.4
Motorcyclist
906
22.9
40
14.4
946
22.3
Bicyclist
565
14.3
21
7.6
586
13.8
Pedestrian
283
7.2
54
19.5
337
8.0
Other/Unknown
120
3.0
12
4.3
132
3.1
Total Hospital Inpatients
3,957
100.0
277
100.0
4,234
100.0
Reported Road Crashes in Western Australia 2011 134
Appendix A Trends Over Time

Reported Road Crashes in Western Australia 2011 135
Appendix A (i) Western Australia Road Crash Trends 1961 to 2011
Counts and Rates
Deaths
Persons Killed or Seriously Injured
Year
Fatal
Crashes
Fatalities
per Vehicle
1
per
Population
2
per Km
3
Persons KSI
per Vehicle
1
per
Population
2
per Km
3
1961
N/A
172
N/A
22.78
N/A
N/A
N/A
N/A
N/A
1962
177
22.77
1963
198
24.78
1964
222
27.14
1965
252
30.06
1966
253
7.97
29.28
1967
256
7.54
28.54
1968
320
8.74
34.12
1969
311
7.81
31.84
1970
351
8.29
35.40
1971
332
7.33
32.22
1972
305
340
7.13
32.28
1973
332
358
7.06
33.50
1974
303
334
6.21
29.89
1975
259
304
5.17
26.51
1976
255
308
4.88
26.14
3.21
1977
259
290
4.29
24.23
2.84
1978
304
345
4.96
28.10
3.19
1979
259
279
3.88
22.38
2.44
1980
268
293
3.93
23.16
2.50
3,337
44.79
263.77
28.46
1981
217
238
3.08
18.31
1.98
2,989
38.66
229.91
24.85
1982
203
236
2.93
17.63
1.91
3,048
37.82
227.65
24.71
1983
191
203
2.51
14.83
1.57
2,665
32.93
194.66
20.64
1984
203
220
2.65
15.81
1.63
2,882
34.72
207.15
21.37
1985
220
243
2.81
17.13
1.73
3,139
36.23
221.28
22.33
1986
208
228
2.57
15.63
1.57
2,982
33.61
204.38
20.56
1987
193
213
2.35
14.24
1.42
2,832
31.26
189.27
18.94
1988
199
230
2.46
14.98
1.49
2,847
30.42
185.45
18.49
1989
214
242
2.45
15.33
1.55
3,225
32.70
204.32
20.64
1990
181
196
1.89
12.15
1.24
2,824
27.22
175.07
17.82
1991
185
207
1.95
12.65
1.29
2,766
26.05
169.06
17.21
1992
171
200
1.85
12.06
1.21
2,738
25.31
165.13
16.61
1993
190
209
1.88
12.46
1.24
2,777
24.99
165.53
16.42
1994
195
211
1.85
12.39
1.22
2,721
23.82
159.78
15.68
1995
194
209
1.76
12.05
1.18
2,898
24.42
167.15
16.34
1996
220
247
2.04
13.99
1.41
2,839
23.44
160.83
16.19
1997
183
196
1.53
10.92
1.13
3,094
24.08
172.37
17.86
1998
199
223
1.64
12.23
1.25
3,181
23.40
174.52
17.80
1999
189
218
1.62
11.79
1.23
2,740
20.37
148.13
15.48
2000
184
212
1.56
11.31
1.07
2,349
17.30
125.32
11.82
2001
151
165
1.20
8.68
0.89
2,098
15.30
110.35
11.27
2002
159
178
1.27
9.24
0.93
3,056
21.74
158.66
15.95
2003
154
179
1.24
9.17
0.86
3,053
21.22
156.32
14.67
2004
163
179
1.21
9.03
0.84
3,360
22.70
169.47
15.76
2005
151
164
1.07
8.13
0.76
3,239
21.18
160.58
14.96
2006
182
201
1.26
9.76
0.89
2,965
18.52
143.98
13.11
2007
213
235
1.40
11.12
0.97
3,019
18.01
142.82
12.43
2008
185
205
1.17
9.41
0.81
3,095
17.72
142.07
12.22
2009
176
191
1.04
8.50
0.74
2,759
15.09
122.80
10.65
2010
174
191
1.02
8.32
0.73
2,722
14.56
118.55
10.36
2011
163
175
0.91
7.44
0.65
2,644
13.82
112.40
9.89
N/A - denotes information not available.
1. Rate is per 10,000 motor vehicles registered (see Appendix A (ii)).
2. Rate is per 100,000 estimated resident population (see Appendix A (ii)).
3. Rate is per 100 million estimated kilometres travelled (see Appendix A (ii)).

Reported Road Crashes in Western Australia 2011 136
Appendix A (i) Western Australian Road Crash Trends, 1961 to 2011 continued
Counts and Rates
Casualties
Reported Crashes
Year
Casualties
4
per Vehicle
1
per
Population
2
per Km
3
Crashes
per Vehicle
1
per
Population
2
per Km
3
1961
N/A
N/A
N/A
N/A
N/A
N/A
N/A
N/A
1962
1963
1964
1965
1966
1967
1968
1969
1970
1971
1972
1973
1974
1975
1976
5,799
92
492
60
29,754
471
2,525
310
1977
7,052
104
589
69
33,918
502
2,833
333
1978
8,482
122
691
78
37,163
534
3,027
344
1979
9,225
128
740
81
36,062
501
2,893
316
1980
8,682
117
686
74
33,668
452
2,661
287
1981
8,510
110
655
71
32,375
419
2,490
269
1982
8,616
107
644
70
32,544
404
2,431
264
1983
8,221
102
600
64
32,239
398
2,355
250
1984
8,919
107
641
66
34,550
416
2,483
256
1985
10,114
117
713
72
35,950
415
2,534
256
1986
10,540
119
722
73
38,368
432
2,630
264
1987
10,809
119
722
72
37,093
409
2,479
248
1988
12,117
129
789
79
39,966
427
2,603
260
1989
12,394
126
785
79
39,174
397
2,482
251
1990
11,593
112
719
73
35,206
339
2,183
222
1991
10,986
103
671
68
33,430
315
2,043
208
1992
10,750
99
648
65
32,387
299
1,953
196
1993
11,120
100
663
66
34,441
310
2,053
204
1994
11,210
98
658
65
35,516
311
2,085
205
1995
11,411
96
658
64
37,287
314
2,151
210
1996
11,628
96
659
66
37,386
309
2,118
213
1997
11,726
91
653
68
36,556
285
2,037
211
1998
12,232
90
671
68
39,104
288
2,145
219
1999
12,671
94
685
72
39,549
294
2,138
223
2000
12,211
90
651
61
38,117
281
2,033
192
2001
11,885
87
625
64
37,526
274
1,974
202
2002
10,709
76
556
56
36,366
259
1,888
190
2003
10,276
71
526
49
36,010
250
1,844
173
2004
10,503
71
530
49
37,826
256
1,908
177
2005
10,259
67
509
47
38,905
254
1,929
180
2006
10,457
65
508
46
39,534
247
1,920
175
2007
10,454
62
495
43
41,630
248
1,969
171
2008
10,214
58
469
40
39,297
225
1,804
155
2009
9,672
53
431
37
37,226
204
1,657
144
2010
10,469
56
456
40
39,615
212
1,725
151
2011
10,544
55
448
39
39,457
206
1,677
148
N/A - denotes information not available.
1. Rate is per 10,000 motor vehicles registered (see Appendix A (ii)).
2. Rate is per 100,000 estimated resident population (see Appendix A (ii)).
3. Rate is per 100 million estimated kilometres travelled (see Appendix A (ii)).
4. Casualties include persons killed, persons admitted to hospital, persons requiring medical attention only, and exclude persons
injured not requiring medical attention.

Reported Road Crashes in Western Australia 2011 137
Appendix A (ii) Western Australian Demographics, 1961- 2011
Demographics
Year
Vehicles
1
Population
2
Travel
3
MDLs
4
1961
N/A
755,213
N/A
N/A
1962
777,248
1963
798,895
1964
818,121
1965
838,248
1966
317,400
864,093
1967
339,400
896,988
1968
366,100
937,800
1969
398,100
976,620
1970
423,200
991,400
1971
453,000
1,030,500
1972
476,900
1,053,200
1973
506,800
1,068,500
1974
537,900
1,117,400
536,794
1975
587,800
1,146,700
562,764
1976
631,500
1,178,340
9,586
561,264
1977
675,800
1,197,100
*10,197
621,288
1978
695,500
1,227,900
*10,809
654,949
1979
719,700
1,246,600
11,420
675,033
1980
745,000
1,265,100
*11,725
700,398
1981
773,200
1,300,056
*12,030
731,000
1982
806,000
1,338,899
12,336
757,000
1983
809,300
1,369,050
*12,911
781,000
1984
830,000
1,391,237
*13,485
800,000
1985
866,300
1,418,564
14,059
819,200
1986
887,357
1,459,019
*14,506
846,135
1987
906,051
1,496,248
*14,954
879,614
1988
935,761
1,535,167
15,401
918,290
1989
986,245
1,578,434
*15,624
953,857
1990
1,037,655
1,613,049
*15,847
997,719
1991
1,061,643
1,636,067
16,070
1,014,738
1992
1,081,710
1,658,045
*16,487
1,066,548
1993
1,111,030
1,677,669
*16,916
1,100,478
1994
1,142,381
1,703,009
*17,356
1,106,096
1995
1,186,742
1,733,787
17,735
1,141,064
1996
1,210,991
1,765,256
*17,531
1,154,165
1997
1,269,581
1,794,992
*17,328
1,199,053
1998
1,327,203
1,822,668
17,873
1,260,196
1999
1,344,809
1,849,733
17,702
1,258,896
2000
*1,358,075
1,874,459
19,875
1,273,234
2001
1,371,341
1,901,159
18,610
1,288,492
2002
1,405,676
1,926,111
19,160
1,270,966
2003
1,438,441
1,953,070
20,810
1,320,777
2004
1,480,206
1,982,637
21,324
1,341,116
2005
1,529,615
2,017,088
21,647
1,360,598
2006
1,600,566
2,059,381
22,616
1,389,332
2007
1,676,495
2,113,841
24,289
1,480,873
2008
1,746,579
2,178,577
25,325
1,716,446
2009
1,828,346
2,246,659
25,902
1,790,500
2010
1,870,068
2,296,129
26,285
1,677,489
2011
1,912,739
2,352,215
26,740
1,739,251
N/A - Denotes information not available.
* Denotes estimated figure.
1. Motor vehicles registered. From 1997 onwards, data taken from ABS, Motor Vehicle Census, Catalogue No. 9309.0.
2. Estimated resident population. From 1983, population data taken from ABS, Catalogue No. 3101.0 for June.
3. Estimated kilometres travelled (million). Data taken from ABS, Survey of Motor Vehicle Use, Catalogue No. 9208.0.
2008 and 2009 estimates based on average kilometres travelled per vehicle (interpolated between 2007 and 2010 figures)
and number of registered vehicles.
4. Western Australian Motor Driver Licences on record (Department of Transport).
Reported Road Crashes in Western Australia 2011 138
Appendix B Additional Crash and Injury Tables

Reported Road Crashes in Western Australia 2011 139
Appendix B (i) Crash Severity by Month - Metropolitan
Crash Severity
Fatal
Hospitalisation
Total Serious
Other
Total
Month
n
Col %
n
Col %
n
Col %
n
Col %
n
Col %
January
3
4.4
93
6.6
96
6.5
2,171
6.8
2,267
6.8
February
9
13.2
120
8.6
129
8.8
2,544
8.0
2,673
8.0
March
7
10.3
136
9.7
143
9.7
3,066
9.6
3,209
9.6
April
8
11.8
118
8.4
126
8.6
2,595
8.1
2,721
8.2
May
5
7.4
112
8.0
117
8.0
2,777
8.7
2,894
8.7
June
5
7.4
109
7.8
114
7.8
2,770
8.7
2,884
8.7
July
3
4.4
109
7.8
112
7.6
2,762
8.7
2,874
8.6
August
6
8.8
135
9.6
141
9.6
2,895
9.1
3,036
9.1
September
6
8.8
106
7.6
112
7.6
2,639
8.3
2,751
8.3
October
5
7.4
119
8.5
124
8.5
2,490
7.8
2,614
7.8
November
6
8.8
103
7.4
109
7.4
2,749
8.6
2,858
8.6
December
5
7.4
139
9.9
144
9.8
2,404
7.5
2,548
7.6
Total Crashes
68
100.0
1,399
100.0
1,467
100.0
31,862
100.0
33,329
100.0
Appendix B (ii) Crash Severity by Month - Regional
Crash Severity
Fatal
Hospitalisation
Total Serious
Other
Total
Month
n
Col %
n
Col %
n
Col %
n
Col %
n
Col %
January
4
7.0
27
7.0
31
7.0
310
8.0
341
7.9
February
7
12.3
31
8.0
38
8.6
286
7.4
324
7.5
March
4
7.0
48
12.4
52
11.7
363
9.4
415
9.7
April
4
7.0
35
9.0
39
8.8
321
8.3
360
8.4
May
5
8.8
26
6.7
31
7.0
320
8.3
351
8.2
June
8
14.0
29
7.5
37
8.3
336
8.7
373
8.7
July
1
1.8
23
5.9
24
5.4
362
9.4
386
9.0
August
2
3.5
29
7.5
31
7.0
330
8.6
361
8.4
September
4
7.0
33
8.5
37
8.3
274
7.1
311
7.2
October
7
12.3
30
7.8
37
8.3
317
8.2
354
8.2
November
6
10.5
36
9.3
42
9.5
291
7.6
333
7.7
December
5
8.8
40
10.3
45
10.1
344
8.9
389
9.1
Total Crashes
57
100.0
387
100.0
444
100.0
3,854
100.0
4,298
100.0

Reported Road Crashes in Western Australia 2011 140
Appendix B (iii) Crash Severity by Month - Remote
Crash Severity
Fatal
Hospitalisation
Total Serious
Other
Total
Month
n
Col %
n
Col %
n
Col %
n
Col %
n
Col %
January
3
7.9
14
6.4
17
6.6
96
6.1
113
6.2
February
2
5.3
13
5.9
15
5.8
100
6.4
115
6.3
March
0
0.0
14
6.4
14
5.4
119
7.6
133
7.3
April
5
13.2
12
5.5
17
6.6
143
9.1
160
8.7
May
2
5.3
22
10.0
24
9.3
158
10.1
182
9.9
June
3
7.9
27
12.3
30
11.6
150
9.5
180
9.8
July
1
2.6
19
8.6
20
7.8
165
10.5
185
10.1
August
6
15.8
22
10.0
28
10.9
143
9.1
171
9.3
September
6
15.8
21
9.5
27
10.5
128
8.1
155
8.5
October
4
10.5
14
6.4
18
7.0
130
8.3
148
8.1
November
4
10.5
23
10.5
27
10.5
133
8.5
160
8.7
December
2
5.3
19
8.6
21
8.1
107
6.8
128
7.0
Total Crashes
38
100.0
220
100.0
258
100.0
1,572
100.0
1,830
100.0
Appendix B (iv) Injury Severity by Month - Metropolitan
Injury Severity
Fatal
Serious
Total Persons
KSI
Minor
None/Unknown
Total
Month
n
Col %
n
Col %
n
Col %
n
Col %
n
Col %
n
Col %
January
3
4.2
111
6.7
114
6.6
571
6.9
5,277
6.6
5,962
6.6
February
10
13.9
144
8.7
154
8.9
693
8.4
6,322
7.9
7,169
8.0
March
7
9.7
159
9.6
166
9.6
891
10.8
7,583
9.5
8,640
9.6
April
8
11.1
135
8.2
143
8.3
642
7.8
6,571
8.2
7,356
8.2
May
6
8.3
132
8.0
138
8.0
794
9.6
6,964
8.7
7,896
8.8
June
5
6.9
128
7.7
133
7.7
702
8.5
6,705
8.4
7,540
8.4
July
3
4.2
129
7.8
132
7.7
753
9.1
7,265
9.1
8,150
9.1
August
6
8.3
160
9.7
166
9.6
783
9.5
7,118
8.9
8,067
9.0
September
6
8.3
131
7.9
137
7.9
650
7.9
6,467
8.1
7,254
8.1
October
6
8.3
140
8.5
146
8.5
550
6.7
6,280
7.8
6,976
7.7
November
6
8.3
120
7.3
126
7.3
666
8.1
7,158
8.9
7,950
8.8
December
6
8.3
163
9.9
169
9.8
562
6.8
6,352
7.9
7,083
7.9
Total Persons
72
100.0
1,652
100.0
1,724
100.0
8,257
100.0
80,062
100.0
90,043
100.0

Reported Road Crashes in Western Australia 2011 141
Appendix B (v) Injury Severity by Month - Regional
Injury Severity
Fatal
Serious
Total Persons
KSI
Minor
None/Unknown
Total
Month
n
Col %
n
Col %
n
Col %
n
Col %
n
Col %
n
Col %
January
4
6.7
37
7.3
41
7.3
90
8.5
760
8.2
891
8.2
February
8
13.3
35
6.9
43
7.6
90
8.5
653
7.0
786
7.2
March
4
6.7
61
12.1
65
11.5
101
9.5
954
10.3
1,120
10.3
April
4
6.7
48
9.5
52
9.2
89
8.4
851
9.2
992
9.1
May
5
8.3
31
6.1
36
6.4
91
8.6
717
7.7
844
7.7
June
8
13.3
33
6.5
41
7.3
116
11.0
743
8.0
900
8.3
July
1
1.7
31
6.1
32
5.7
87
8.2
916
9.9
1,035
9.5
August
2
3.3
38
7.5
40
7.1
68
6.4
772
8.3
880
8.1
September
4
6.7
44
8.7
48
8.5
72
6.8
616
6.6
736
6.8
October
7
11.7
44
8.7
51
9.0
66
6.2
739
8.0
856
7.9
November
6
10.0
52
10.3
58
10.3
75
7.1
693
7.5
826
7.6
December
7
11.7
51
10.1
58
10.3
113
10.7
854
9.2
1,025
9.4
Total Persons
60
100.0
505
100.0
565
100.0
1,058
100.0
9,268
100.0
10,891
100.0
Appendix B (vi) Injury Severity by Month - Remote
Injury Severity
Fatal
Serious
Total Persons
KSI
Minor
None/Unknown
Total
Month
n
Col %
n
Col %
n
Col %
n
Col %
n
Col %
n
Col %
January
3
7.0
20
6.4
23
6.5
40
7.6
212
5.8
275
6.1
February
2
4.7
18
5.8
20
5.6
27
5.1
214
5.9
261
5.8
March
0
0.0
16
5.1
16
4.5
36
6.8
290
7.9
342
7.6
April
7
16.3
19
6.1
26
7.3
48
9.1
387
10.6
461
10.2
May
2
4.7
28
9.0
30
8.5
47
8.9
380
10.4
457
10.1
June
3
7.0
42
13.5
45
12.7
72
13.7
354
9.7
471
10.4
July
1
2.3
23
7.4
24
6.8
47
8.9
362
9.9
433
9.6
August
8
18.6
25
8.0
33
9.3
43
8.2
321
8.8
397
8.8
September
7
16.3
40
12.8
47
13.2
35
6.7
304
8.3
386
8.5
October
4
9.3
18
5.8
22
6.2
49
9.3
288
7.9
359
7.9
November
4
9.3
37
11.9
41
11.5
41
7.8
318
8.7
400
8.8
December
2
4.7
26
8.3
28
7.9
41
7.8
218
6.0
287
6.3
Total Persons
43
100.0
312
100.0
355
100.0
526
100.0
3,648
100.0
4,529
100.0

Reported Road Crashes in Western Australia 2011 142
Appendix B (vii) Crash Severity by Day Of Week - Metropolitan
Crash Severity
Fatal
Hospitalisation
Total Serious
Other
Total
Day of Week
n
Col %
n
Col %
n
Col %
n
Col %
n
Col %
Monday
7
10.3
149
10.7
156
10.6
4,311
13.5
4,467
13.4
Tuesday
10
14.7
195
13.9
205
14.0
5,115
16.1
5,320
16.0
Wednesday
10
14.7
204
14.6
214
14.6
5,161
16.2
5,375
16.1
Thursday
10
14.7
216
15.4
226
15.4
5,299
16.6
5,525
16.6
Friday
13
19.1
254
18.2
267
18.2
5,548
17.4
5,815
17.4
Saturday
10
14.7
223
15.9
233
15.9
3,838
12.0
4,071
12.2
Sunday
8
11.8
158
11.3
166
11.3
2,590
8.1
2,756
8.3
Total Crashes
68
100.0
1,399
100.0
1,467
100.0
31,862
100.0
33,329
100.0
Appendix B (viii) Crash Severity by Day of Week - Regional
Crash Severity
Fatal
Hospitalisation
Total Serious
Other
Total
Day of Week
n
Col %
n
Col %
n
Col %
n
Col %
n
Col %
Monday
7
12.3
56
14.5
63
14.2
521
13.5
584
13.6
Tuesday
7
12.3
44
11.4
51
11.5
514
13.3
565
13.1
Wednesday
5
8.8
45
11.6
50
11.3
541
14.0
591
13.8
Thursday
9
15.8
40
10.3
49
11.0
601
15.6
650
15.1
Friday
15
26.3
65
16.8
80
18.0
701
18.2
781
18.2
Saturday
9
15.8
79
20.4
88
19.8
553
14.3
641
14.9
Sunday
5
8.8
58
15.0
63
14.2
423
11.0
486
11.3
Total Crashes
57
100.0
387
100.0
444
100.0
3,854
100.0
4,298
100.0
Appendix B (ix) Crash Severity by Day of Week - Remote
Crash Severity
Fatal
Hospitalisation
Total Serious
Other
Total
Day of Week
n
Col %
n
Col %
n
Col %
n
Col %
n
Col %
Monday
4
10.5
27
12.3
31
12.0
227
14.4
258
14.1
Tuesday
4
10.5
29
13.2
33
12.8
210
13.4
243
13.3
Wednesday
2
5.3
34
15.5
36
14.0
225
14.3
261
14.3
Thursday
2
5.3
35
15.9
37
14.3
244
15.5
281
15.4
Friday
4
10.5
27
12.3
31
12.0
265
16.9
296
16.2
Saturday
10
26.3
23
10.5
33
12.8
218
13.9
251
13.7
Sunday
12
31.6
45
20.5
57
22.1
183
11.6
240
13.1
Total Crashes
38
100.0
220
100.0
258
100.0
1,572
100.0
1,830
100.0
Reported Road Crashes in Western Australia 2011 143
Appendix C P72 Form
WA Police Report of Road Traffic Crash

WESTERN AUSTRALIA POLICE P72
REPORT OF ROAD TRAFFIC CRASH
THERE IS NO COMPULSION TO REPORT A TRAFFIC CRASH IF
:
• Damage to ALL VEHICLES and/or PROPERTY is LESS than $1000, and
• There is NO INJURY TO ANY PERSON involved in this crash, and
• The PROPERTY OWNER has been advised of your details, and
• The crash is NOT a Hit and Run crash
Please print clearly. Please enter as many details as possible. Where more than two parties involved - use an additional form.
1) POLICE USE ONLY POLICE CRASH OFFICER ON DUTY (Y/N)………..
Police Officer attending scene: Name……………………..……………….PD No. ……..………. Sub District/Unit.....……….………….………………
Crash attended at: (time)………………(date)……………………….…… Police Crash (Y/ N)…… Photographs (Y/N)…..…. Scene Marked (Y/N)…..……
DRIVER 1 – Prelim. POS / NEG BAC 0.___ ___ ___CALC TO 0.___ ___ __ DRIVER 2 – Prelim. POS / NEG BAC 0. ___ ___ ___CALC TO 0. ___ ___ ___
Blood test taken (Y/N)…… Driver Number…… Contributing factors - Excessive Speed (Yes / No) / Fatigue (Yes / No) / Inattention (Yes / No) / Unknown
2) PRECISE
NAME OF SUBURB, TOWN OR LOCALITY……………………………………………………………………..……POSTCODE…………..…...
LOCATION
A) OCCURRED AT THE INTERSECTION OF……………………………..……….………………….……………….……….…..……...….…
AND…………………………………………....…………………..………………………………
OF
OR
CRASH
B) ON………………..………………………..…..…. ………. Metres N / S / E / W OF..………………………………………………..…
(street crash occurred on) .………...Kilometres (nearest cross street, landmark etc)
AREA SPEED ZONE ……………….KPH
3) DAY OF CRASH
TIME OF CRASH ___ ___ ___ ___ 24 hours
Sunday Monday Tuesday Wednesday Thursday Friday Saturday DATE OF CRASH ….……/….……./…….…..
4) HIT AND RUN (Y/N)……... Driver (M/F)…..… Estimated age…….… Description of Driver ……………………………………………………………………
Description of Vehicle (include any accessories fitted to vehicle)…………………………………………………………………………….………………………..
NUMBER OF VEHICLES INVOLVED IN CRASH - ___ ___
5) INVOLVED VEHICLE 1 – YOUR Details SEATBELT WORN (Y/N) …… PURPOSE OF TRAVEL: PRIVATE / BUSINESS
DRIVER’S FAMILY NAME………...……..………..……………….…GIVEN NAMES…………….…………………………………………… SEX: (M/F) …….
ADDRESS……………………………………………………………….……………….…SUBURB…………………..…………..…………POSTCODE…………..
OCCUPATION…………………………………………………………EMPLOYER………………..………………………………………………………………….
PHONE No.: Work…………….…………...Home………………….…………Mobile……………..…….…..…………… DATE OF BIRTH………./………/….….
DRIVERS LICENCE: No………………...…………….…… STATE OF ISSUE………………..… LICENCE CLASS/ES………………
LICENCE TYPE (Ordinary, Probationary, Learner, Expired, Cancelled etc.)……………..…………..………………….… EXPIRY DATE………/………/……..
VEHICLE MAKE AND MODEL………………..…………………….……..……… COLOUR………………..…… BODY TYPE……………………………
HEAVY VEHICLES: Configuration No:………… (see page 4 for ID number ) Was it Loaded (Yes/No)…… Type of load …………………………………
REGISTRATION No……………………….….…STATE OF REGISTRATION………….EXPIRY DATE………/………/………No. OF OCCUPANTS ___ ___
OWNERS NAME………………………………………..………… ADDRESS………………………..……………………….………………………………………..
OWNERS INSURANCE COMPANY……………….……………. DESCRIPTION OF DAMAGE………………………….…….…………….…………………….
VEHICLE TOWED (Y/N) …… POLICE AUTHORITY (Y/N)…… TOWING COMPANY……………………………….………..……….………………………
WHERE TOWED ………………………………………………………………………………………………………………………………………………………….
6) INVOLVED VEHICLE 2 SEATBELT WORN (Y/N) …… PURPOSE OF TRAVEL: PRIVATE / BUSINESS
DRIVER’S FAMILY NAME………...……..………..……………….…GIVEN NAMES…………….…………………………………………… SEX: (M/F) …….
ADDRESS……………………………………………………………….……………….…SUBURB…………………..…………..…………POSTCODE…………..
OCCUPATION…………………………………………………………EMPLOYER………………..………………………………………………………………….
PHONE No.: Work…………….…………...Home………………….…………Mobile……………..…….…..…………… DATE OF BIRTH………./………/….….
DRIVERS LICENCE: No………………...…………….…… STATE OF ISSUE………………..… LICENCE CLASS/ES…………….………
LICENCE TYPE (Ordinary, Probationary, Learner, Expired, Cancelled etc.)……………..…………..………………….… EXPIRY DATE………/………/……..
VEHICLE MAKE AND MODEL………………..…………………….……..……… COLOUR………………..…… BODY TYPE……………………………
HEAVY VEHICLES: Configuration No :…………(see page 4 for ID number)…Was it Loaded (Yes/No)…… Type of load…………………………………………..
REGISTRATION No……………………….….…STATE OF REGISTRATION………….EXPIRY DATE………/………/………No. OF OCCUPANTS ___ ___
OWNERS NAME………………………………………..………… ADDRESS………………………..……………………….………………………………….
OWNERS INSURANCE COMPANY……………….……………. DESCRIPTION OF DAMAGE………………………….…….…………….……………….
VEHICLE TOWED (Y/N) …… POLICE AUTHORITY (Y/N)…… TOWING COMPANY……………………………….………..……….……………………
WHERE TOWED ………………………………………………………………………………………………………………………………………………………….
Local No.
Crash No.

7) INJURIES AND ALL PERSONS IN YOUR VEHICLE: – refer to KEY below when completing involved persons details:
KEY: Include one of the following for Position PERSON INJURY SEATBELT/HELMET AIRBAG
Seating position 10. Back of the vehicle/wagon
11. Towed device
12. Bus seat
13. On tray (utility/truck)
14. Riding externally on vehicle
99. Unknown
For M/C or Cyclist use 1 and 4
1. Driver /
Rider
2. Passenger
3. Pedestrian
1. Killed
4. Admitted to hospital as inpatient
2. Injured, medical treatment only
5. Injured, no medical treatment
6. No injury
1. Worn
2. Not worn
3. Child restraint worn
4. Child restraint not worn
5. Unknown
1. Deployed
2. Fitted not
deployed
3. Not fitted
Veh Seating Seatbelt /
INJURIES AND ALL INVOLVED PERSONS : ( include drivers)
Enter full details for each person. (Your vehicle is vehicle No 1)
No Position
Person Injury
Helmet
AIRBAG
1 NAME:
ADDRESS Date of Birth / /
2 NAME:
ADDRESS Date of Birth / /
3 NAME:
ADDRESS Date of Birth / /
4 NAME:
ADDRESS Date of Birth / /
5 NAME:
ADDRESS Date of Birth / /
6 NAME:
ADDRESS Date of Birth / /
7 NAME:
ADDRESS Date of Birth / /
8 NAME:
ADDRESS Date of Birth / /
CRASH FEATURES (Cross all appropriate boxes)
8) TRAFFIC CONTROL 9) ROAD FEATURE 10) ROAD ALIGNMENT 11) ROAD CONDITION
1. Traffic Lights 1. 4 Way intersection (crossroads) 1. Left Curve 2. Right Curve 1. Wet
2. Stop Sign 2. 3 Way Junction / T Junction 3. Straight 2. Dry
3. Give Way Sign 3. Multiple intersection
12)
ROAD GRADE 13) ROAD SURFACE
4. Pedestrian Crossing 4. Roundabout 1. Level 1. Sealed
5. School Crossing 5. Median opening 2. Crest of Hill 2. Unsealed
6. No Sign or Control 6. Slow Point (eg. speed hump) 3. Up Slope 4. Down Slope 3. Off road
7. Other – specify: 7. Railway crossing
14)
ATMOSPHERIC CONDITIONS 15) LIGHTING
.....…………………..
8. Bridge 1. Clear 1. Daylight
Rail Level Crossing
9. Subway 2. Fog / mist 2. Dawn or Dusk
8. Boom Gates 10. Driveway 3. Raining
Darkness
9. Flashing Lights Only 11. Pedestrian Island 4. Smoke, dust 3. Street lights on
10. Stop Sign 12. No special feature 5. Overcast 4. Street lights off
11. Give Way 13. Other – specify: 6. Sun Glare 5. Street lights not provided
12. Unguarded …………….………..………… 7. Other – .……….….……………………………………………..…...
16) ESTIMATE of combined damage of ALL vehicles AND property: Less than $1000 Over $1000
17) Type of Crash (Cross all appropriate boxes)
( 1 ) Vehicle to Vehicle Collisions ( 2 ) Single Vehicle Collision
1. Right turn into oncoming vehicle
On Road OR Off Road
2. Right angle collision 1. Struck pedestrian 6. Struck pedestrian
3. Side impact - same direction 2. Struck animal 7. Struck animal
4. Side impact - opposite direction 3. Struck object 8. Struck object
5. Head on collision 4. Overturned 9. Overturned
6. Rear end collision 5. Fall from moving vehicle 10. Fall from moving vehicle
7. Collision with parked vehicle
8. Collision with one vehicle reversing If you hit an object, state each object and distance of each object from the road…………….metres
3 Vehicle Movement Prior to Crash (Select appropriate vehicle numbers and enter into boxes, e.g. V 1, V 2 or V3
A Direction
Veh
B Lane Veh
Veh
C Approach
Veh
1 North bound
1 1
st
lane ( kerb or left)
5 Left turn lane
1 Approaching intersection
2 South bound
2 2
nd
lane
6 Merge lane
2 Within intersection
3 East bound
3 3
rd
lane
7 Shoulder
3 Not related with intersection
4 West bound
4 Right turn lane
8 On wrong side of road
4 Into driveway
5 Out of driveway
D Action
Veh
Veh
E Other
Veh
Veh
1 Straight ahead
5 Overtaking right side
1 Proceeding normally
4 Out of control
2 Right turn
6 Overtaking left side
2 Slowing
5 Changing lanes
3 Left turn
7 Backing
3 Stopped
6 Turn - Into parking
4 U-turn
8 Parked
7 Turn - Out of parking
9 6 3
8 5 2
7
41
)

18) INDEPENDENT Witnesses (Not Passengers)
Telephone Number
NAME ADDRESS Work Home Mobile
19) DESCRIPTION and DETAILS of CRASH - Briefly describe how the crash happened, stating clearly speeds of vehicles before and at impact:
if vehicle lights on, if vehicle fitted with roo bar/bull bar, and if Ambulance attended.
…………………………………………………………………………………………………………………………………………………………………………………
………………………………………………………………………………………………………………………………………………………………………………….
…………………………………………………………………………………………………………………………………………………………………………………
………………………………………………………………………………………………………………………………………………………………………………….
…………………………………………………………………………………………………………………………………………………………………………………
………………………………………………………………………………………………………………………………………………………………………………….
…………………………………………………………………………………………………………………………………………………………………………………
………………………………………………………………………………………………………………………………………………………………………………….
…………………………………………………………………………………………………………………………………………………………………………………
………………………………………………………………………………………………………………………………………………………………………………….
…………………………………………………………………………………………………………………………………………………………………………………
………………………………………………………………………………………………………………………………………………………………………………….
…………………………………………………………………………………………………………………………………………………………………………………
………………………………………………………………………………………………………………………………………………………………………………….
…………………………………………………………………………………………………………………………………………………………………………………
………………………………………………………………………………………………………………………………………………………………………………….
………………………………………………………………………………………………………………………………………………………………………………….
………………………………………………………………………………………………………………………………………………………………………………….
…………………………………………………………………………………………………………………………………………………………………………………
…….……………………………………………………………………………………………………………………………………………………………………………
1. What colour were the Traffic Control Lights (Red / Amber / Green) facing: you .……….………...…..… …………..……..……..……....
2. How far were you from the vehicle / pedestrian when you first sighted them / it………………………………………………………………………………………
3. Did you sound your horn (Y/N) ………….……………
20) Sketch of Locality
Label all vehicles and objects
1. Show street names
2. Show control signs, road markings
3. Show all objects struck and by which vehicle
4. Select appropriate symbols for diagram
5. Show NORTH point
PEDESTRIAN
VEHICLE 1 (front)
VEHICLE 2 (front)
21) Number of sheets used to report this crash:…..…..
I understand and acknowledge that this form may be adduced in evidence in any court proceedings resulting from the investigation of this crash.
Information may be released in accordance with the Western Australia Police Service Privacy Statement.
Please retain a copy of this form as it may be required by your Insurance Company and/or Solicitor. Costs apply for additional copies.
22) ONLY SIGN AT TIME FORM IS HANDED TO RECEIVING OFFICER
Signature………………………………………….… Time…………...24 Hours Date ……./....…/..…..
Police / Staff Signature……………….………………….……… Print Surname ………………….…………...…………….…....… PD No…….…..………
Sub District / Unit……………………………….…………..…………….……… A/L……..……….….……..………………………………………………….…………
For self-reported crashes only
Copy provided
Yes No - Reason if No..……….………………………………………………………………………………..………………………..
2
1

Heavy vehicle identification chart
Select the number of the vehicle configuration which best suits the Heavy Vehicle involved in
your crash and place the number on the P72 Crash detail form at the heading of Heavy
Vehicle Configuration.
10
9
8
6
7
5
4
3
2
1

WESTERN AUSTRALIA POLICE SERVICE P72 – ADDITIONAL VEHICLES
`6a) INVOLVED VEHICLE 3 SEATBELT WORN (Y/N) …… PURPOSE OF TRAVEL: PRIVATE / BUSINESS
DRIVER’S FAMILY NAME………...……..………..……………….…GIVEN NAMES…………….…………………………………………… SEX: (M/F) …….
ADDRESS……………………………………………………………….……………….…SUBURB…………………..…………..…………POSTCODE…………..
OCCUPATION…………………………………………………………EMPLOYER………………..………………………………………………………………….
PHONE No.: Work…………….…………...Home………………….…………Mobile……………..…….…..…………… DATE OF BIRTH………./………/….….
DRIVERS LICENCE: No………………...…………….……STATE OF ISSUE………………..…LICENCE CLASS/ES…………….………………
LICENCE TYPE (Ordinary, Probationary, Learner, Expired, Cancelled etc.)……………..…………..………………….…… EXPIRY DATE………/………/……..
VEHICLE MAKE AND MODEL………………..…………………….……..……… COLOUR………………..…… BODY TYPE………………………………….
HEAVY VEHICLES: Configuration…………………………………………Was it Loaded (Yes/No)…… Type of load ……………………………………………..
REGISTRATION No……………………….….…STATE OF REGISTRATION………….EXPIRY DATE………/………/………No. OF OCCUPANTS ___ ___
OWNERS NAME………………………………………..………… ADDRESS………………………..……………………….………………………………………..
OWNERS INSURANCE COMPANY……………….……………. DESCRIPTION OF DAMAGE………………………….…….…………….……………………..
VEHICLE TOWED (Y/N) …… POLICE AUTHORITY (Y/N)…… TOWING COMPANY……………………………….………..……….………………………
WHERE TOWED ………………………………………………………………………………………………………………………………………………………….
6b) INVOLVED VEHICLE 4 SEATBELT WORN (Y/N) …… PURPOSE OF TRAVEL: PRIVATE / BUSINESS
DRIVER’S FAMILY NAME………...……..………..……………….…GIVEN NAMES…………….…………………………………………… SEX: (M/F) …….
ADDRESS……………………………………………………………….……………….…SUBURB…………………..…………..…………POSTCODE…………..
OCCUPATION…………………………………………………………EMPLOYER………………..………………………………………………………………….
PHONE No.: Work…………….…………...Home………………….…………Mobile……………..…….…..…………… DATE OF BIRTH………./………/….….
DRIVERS LICENCE: No………………...…………….……STATE OF ISSUE………………..…LICENCE CLASS/ES…………….………………
LICENCE TYPE (Ordinary, Probationary, Learner, Expired, Cancelled etc.)……………..…………..………………….…… EXPIRY DATE………/………/……..
VEHICLE MAKE AND MODEL………………..…………………….……..……… COLOUR………………..…… BODY TYPE………………………………….
HEAVY VEHICLES: Configuration…………………………………………Was it Loaded (Yes/No)…… Type of load ……………………………………………..
REGISTRATION No……………………….….…STATE OF REGISTRATION………….EXPIRY DATE………/………/………No. OF OCCUPANTS ___ ___
OWNERS NAME………………………………………..………… ADDRESS………………………..……………………….………………………………………..
OWNERS INSURANCE COMPANY……………….……………. DESCRIPTION OF DAMAGE………………………….…….…………….……………………..
VEHICLE TOWED (Y/N) …… POLICE AUTHORITY (Y/N)…… TOWING COMPANY……………………………….………..……….………………………
WHERE TOWED ………………………………………………………………………………………………………………………………………………………….
6c) INVOLVED VEHICLE 5 SEATBELT WORN (Y/N) …… PURPOSE OF TRAVEL: PRIVATE / BUSINESS
DRIVER’S FAMILY NAME………...……..………..……………….…GIVEN NAMES…………….…………………………………………… SEX: (M/F) …….
ADDRESS……………………………………………………………….……………….…SUBURB…………………..…………..…………POSTCODE…………..
OCCUPATION…………………………………………………………EMPLOYER………………..………………………………………………………………….
PHONE No.: Work…………….…………...Home………………….…………Mobile……………..…….…..…………… DATE OF BIRTH………./………/….….
DRIVERS LICENCE: No………………...…………….……STATE OF ISSUE………………..…LICENCE CLASS/ES…………….………………
LICENCE TYPE (Ordinary, Probationary, Learner, Expired, Cancelled etc.)……………..…………..………………….…… EXPIRY DATE………/………/……..
VEHICLE MAKE AND MODEL………………..…………………….……..……… COLOUR………………..…… BODY TYPE………………………………….
HEAVY VEHICLES: Configuration…………………………………………Was it Loaded (Yes/No)…… Type of load ……………………………………………..
REGISTRATION No……………………….….…STATE OF REGISTRATION………….EXPIRY DATE………/………/………No. OF OCCUPANTS ___ ___
OWNERS NAME………………………………………..………… ADDRESS………………………..……………………….………………………………………..
OWNERS INSURANCE COMPANY……………….……………. DESCRIPTION OF DAMAGE………………………….…….…………….……………………..
VEHICLE TOWED (Y/N) …… POLICE AUTHORITY (Y/N)…… TOWING COMPANY……………………………….………..……….………………………
WHERE TOWED ………………………………………………………………………………………………………………………………………………………….
6d) INVOLVED VEHICLE 6 SEATBELT WORN (Y/N) …… PURPOSE OF TRAVEL: PRIVATE / BUSINESS
DRIVER’S FAMILY NAME………...……..………..……………….…GIVEN NAMES…………….…………………………………………… SEX: (M/F) …….
ADDRESS……………………………………………………………….……………….…SUBURB…………………..…………..…………POSTCODE…………..
OCCUPATION…………………………………………………………EMPLOYER………………..………………………………………………………………….
PHONE No.: Work…………….…………...Home………………….…………Mobile……………..…….…..…………… DATE OF BIRTH………./………/….….
DRIVERS LICENCE: No………………...…………….……STATE OF ISSUE………………..…LICENCE CLASS/ES…………….………………
LICENCE TYPE (Ordinary, Probationary, Learner, Expired, Cancelled etc.)……………..…………..………………….…… EXPIRY DATE………/………/……..
VEHICLE MAKE AND MODEL………………..…………………….……..……… COLOUR………………..…… BODY TYPE………………………………….
HEAVY VEHICLES: Configuration…………………………………………Was it Loaded (Yes/No)…… Type of load ……………………………………………..
REGISTRATION No……………………….….…STATE OF REGISTRATION………….EXPIRY DATE………/………/………No. OF OCCUPANTS ___ ___
OWNERS NAME………………………………………..………… ADDRESS………………………..……………………….………………………………………..
OWNERS INSURANCE COMPANY……………….……………. DESCRIPTION OF DAMAGE………………………….…….…………….……………………..
VEHICLE TOWED (Y/N) …… POLICE AUTHORITY (Y/N)…… TOWING COMPANY……………………………….………..……….………………………
WHERE TOWED ………………………………………………………………………………………………………………………………………………………….
Reported Road Crashes in Western Australia 2011 149
Appendix D Safe Systems Diagram

18
ABOUT THE SAFE SYSTEM
Figure 9: The Safe System (adapted from Australian Transport Council, 2007)
While efforts will continue to prevent crashes, when they
do occur, there are three factors that directly influence the
severity of the outcome: the protection provided by the
vehicle; the speed at which it hits; and the nature of the
object hit. We can manage these factors to keep crash
energies below our physical limits.
Of course, we cannot build a system where users can
behave irresponsibly. We must continue our efforts to
improve road user behaviour. We do this by managing
the licensing of vehicles, drivers and riders in the system,
informing and educating road users, enforcing road rules,
and building our understanding of road crashes and risks,
to encourage road users to be alert and compliant.
The ‘Safe System’ views the road transport system
holistically by seeking to manage the interaction
between road users, roads and roadsides, travel
speeds and vehicles. The Safe System recognises
that it is probably not possible to prevent all crashes
but aims to prevent those that result in death and
serious injury.
In Australia the Safe System road safety philosophy is
being adopted to help reduce road trauma as part of the
Australian Transport Council’s National Road Safety Action
Plan 2007‑08. The Safe System philosophy has also been
applied internationally in countries such as Sweden and the
Netherlands. The Towards Zero Strategy has been framed
using the Safe System approach.
Central to the Safe System (see Figure 9) is an
acknowledgement of our limited ability as humans to
tolerate physical force. Human tolerance levels in crashes
are shown in Table 5 (page 35). The Safe System aims
to manage crash energies to prevent death and serious
injury. It also recognises that human error in the system is
inevitable no matter how educated and compliant we are
in obeying traffic laws. In Sweden it has been estimated
that even with total compliance with current speed limits,
seatbelt wearing laws and drink driving laws about half of
all road trauma would remain (Nilsson, 2005).
While individual road users remain responsible for
behaving safely and complying with all traffic laws, the
Safe System requires system designers to provide a road
system that increasingly prioritises safety outcomes to
cater for the mistakes people make in traffic.
L
E
A
D
I
N
G
T
O
A
L
E
R
T
A
N
D
C
O
M
P
L
I
A
N
T
R
O
A
D
U
S
E
R
S
S
a
f
e
V
e
h
i
c
l
e
s
S
a
f
e
R
o
a
d
s
a
n
d
R
o
a
d
s
i
d
e
s
S
a
f
e
R
o
a
d
U
s
e
r
s
S
a
f
e
S
p
e
e
d
s
I
N
C
R
E
A
S
E
D
P
R
O
T
E
C
T
I
O
N
T
O
R
E
D
U
C
E
S
E
R
I
O
U
S
N
E
S
S
O
F
C
R
A
S
H
E
S
A
d
m
i
s
s
i
o
n
t
o
t
h
e
s
y
s
t
e
m
E
d
u
c
a
t
i
o
n
a
n
d
i
n
f
o
r
m
a
t
i
o
n
U
n
d
e
r
s
t
a
n
d
i
n
g
c
r
a
s
h
e
s
a
n
d
r
i
s
k
s
E
n
f
o
r
c
e
m
e
n
t
o
f
r
o
a
d
r
u
l
e
s
Increased protection to reduce seriousness of crashes
HUMAN
TOLERANCE
TO PHYSICAL
FORCE
Reported Road Crashes in Western Australia 2011 151
Appendix E Road Safety-Related Legislation and Other Initiatives
Reported Road Crashes in Western Australia 2011 152
The following is a brief listing of road safety-related legislation and other initiatives, which could
have contributed to reductions in road crashes and injury in WA.
1919 First Road Traffic Act introduced.
1953 First Traffic Control signals introduced (West Perth Subway).
1954 Stop sign regulation introduced.
1960 (circa) Amphometer Speed Detection Device introduced (Air pressure tapes).
1964 Probationary Licence Scheme introduced.
1968 First Breath Analysis Apparatus used.
1968 Preliminary Breath Testing introduced. (Aico Test - a tube with crystals that
changed colour)
1968 Blood alcohol concentration (BAC) limits of:
0.08gm%; and
0.15gm% (driving under the influence - DUI).
1969 On-the-spot traffic infringement notices (TIN) introduced.
1969 Seat belts required to be fitted to motor car front seats.
1970 Legal drinking age changed from 21 years to 18 years.
1971 Seat belts required to be fitted to motor cars for all seats and wearing of seat belts
made compulsory.
1971 Head Supports required to be fitted for all cars manufactured on or after January 1
1972.
1974 Road Traffic Act 1974 and its regulations enacted bringing all traffic enforcement
under police control. (Previously most rural and several Metropolitan Local Councils
controlled traffic enforcement in their areas)
1974 Compulsory Wearing of Safety Helmets. Motorcycle riders required to wear an
approved protective helmet. Pillion passengers of six years of age and older also
required to wear an approved helmet.
1974 Motoring went Metric (Mph to Km/h)
1975 Demerit points introduced an accrual of 12 points results in a three month
suspension of licence.
1977 Child restraints required to be used for children aged 1 to 7 years old (older must
wear seat belts).
Reported Road Crashes in Western Australia 2011 153
1977 Speed Gun JF 100 Mobile Radar Detection Device introduced (operated from
within the patrol vehicle.
1978 Maximum speed of 60km/h introduced in built-up areas, except where zoned for a
different speed limit.
1978 Maximum speed of 110 km/h introduced in areas other than those zoned
otherwise, or in built-up areas.
1979 Preliminary Breath Testing Apparatus "Liar*' Electronic introduced.
1979 Drivers responsible for children aged one to seven years wearing seat belt.
1979 Red light cameras introduced for use at traffic light controlled intersections.
1981 Road Traffic Board established to administer the Road Traffic Act.
1982 Infra Red (Digitector) high volume speed detection device introduced.
1982 BAC limit of 0.02gm% for probationary drivers introduced with a penalty of
cancellation of probationary licence and a $100 fine.
1986 Fairy Slant Radar Speed Detection Devices introduced.
1987 Breath Analysis Evidentiary Equipment improved - DRAGER 71 10 introduced.
1987 Motor Vehicle (Third Party Insurance) Act 1943 amended to limit cover to injury
caused through "driving of a motor vehicle", following a High Court decision.
1988 Random breath testing (RBT) introduced.
1988 Speed Camera Radars introduced.
1989 Penalty for failing to wear a seat belt increased from $50 to $100.
1989 Seat belt exemption for passengers over 70 years of age repealed.
1989 Prime Minister's 10 point road safety package was devised.
1990 Penalties for most traffic offences increased.
1991 Speed limiting device legislation for heavy vehicles introduced.
1992 Compulsory bicycle helmet wearing legislation came into effect. From July 1,
1992 a rider had the opportunity to buy a helmet or be fined and from January 1,
1993 a rider was fined if found not to be wearing a correctly fastened helmet. Helmet
subsidy scheme applied.
1992 Maximum speed limit for drivers of heavy vehicles increased to 100km/h.
1992 Penalties increased for speeding offences committed by drivers of heavy vehicles.
Reported Road Crashes in Western Australia 2011 154
1993 BAC limit of 0.05gm% introduced. Penalties of $100 and three demerit points were
applied.
1993 Local traffic area 40km/h legislation introduced.
1993 Threshold on General Damages introduced to eliminate non-pecuniary loss for
minor personal injury claims.
1994 Speed limits (max) increased for:
probationary drivers from 80km/h to 90km/h where applicable; and
freeways from 90km/h to 100km/h.
1995 Seat belt regulations repealed and new regulations became effective. From
January 1
st
all children, regardless of age were to be correctly restrained.
1995 Revised Towed agricultural implements regulations introduced impacting on the
use of agricultural implements being towed on the road.
1995 Suspension of motor driver's licence for non-payment of fines introduced.
1995 Young Offenders Act introduced.
1996 Restricted use of right lane regulation introduced regardless of speed limit - all
vehicles to keep left unless overtaking, intending to turn right, or providing good
reason for being in the right hand lane. (Note – changed to apply to 90km/h roads
and higher in 2000).
1997 Alcohol Preliminary Testing Units with electrical digital reading capabilities
(LION SD 400) introduced.
1997 Road Safety Council (RSC) formed to replace the Traffic Board of Western
Australia.
1998 Penalties for some traffic offences increased (and penalty units introduced).
1999 New Practical driving assessment introduced as first component of the Graduated
Driver Training and Licensing System (March).
2000 Road Traffic Code 2000 commenced (1 December 2000) with provisions similar to
the Australian Road Rules (apart from a few exceptions).
2000 Restricted use of right lane regulation applied to roads where speed limit 90km/h
or greater (all vehicles are required to keep left unless overtaking, intending to turn
right, or providing good reason for being in the right hand lane).
2001 Regulation prohibiting passengers riding in the open load space of some
vehicles (utilities) introduced on 1 January, 2001.
2001 Road Traffic Act 1974 amended to give effect to the Graduated Driver Training and
Licensing system for novice drivers. Probation period extended from 1 to 2 years or
until 19 years of age (whichever is the greater period).
Reported Road Crashes in Western Australia 2011 155
2001 Probationary licences no longer cancelled for non-payment of Fines (only
suspension of licence).
2001 Using a Hand-held Mobile Phone whilst driving banned from July 1, 2001.
2001 National driver licence classes and minimum standard assessment vehicles for
testing of drivers introduced (7 May ).
2001 Compulsory Photographs and signatures on licence (7 May).
2001 Industry training and assessment for MC licence applications
2001 Default built-up area speed limit reduced from 60km/h to 50km/h. Applied to all
roads in a built-up area except within a speed zone in which another speed limit is
signed (1 December).
2002 Speed limit of 90km/h for Probationary drivers removed (6 February).
2002 Hazard perception test introduced for learner drivers.
2002 A trial of Double Demerit points during holiday periods introduced for offences in
relation to speeding, drink driving and failure to use restraints.
2002 Heavy Vehicle Accreditation Scheme implemented (requiring the introduction of a
quality systems approach to the management of heavy vehicle maintenance and
driver fatigue).
2002 Road Safety Council Act 2002 passed. Under the Act the functions of the Road
Safety Council and administration of the Road Trauma Trust Fund were transferred
from the Road Traffic Act 1974.
2002 Road Traffic (Vehicle Standards) Rules and Regulations 2002 introduced.
2004 Road Traffic Amendment (Impounding and Confiscation of Vehicles) Act 2004.
This amendment allows police to impound vehicles and suspend driver’s licences for
reckless and dangerous driving.
2004 Automatic Number Plate Recognition Devices introduced.
2004 Double Demerit Points for Nominated Offences (Drink Driving 0.05%<0.08%,
Speeding, Not wearing a Seat Belt and Occupying Open Load Spaces) gazetted into
legislation for nominated dates.
2004 Road Traffic Act amended to introduce hoon legislation, including inter alia, 48
hour impounding (December).
2004 Redefinition of "driving" by the High Court to exclude claims for personal injury
arising from vehicles not in motion.
Reported Road Crashes in Western Australia 2011 156
2005 Changes for converting overseas licences commenced 1 January. Testing of
licence holders from non-recognised countries for all classes of licence. Licence
holders from recognised countries tested for classes other than car and motorcycle.
2006 Final phase of the Open Load Space regulations came into effect prohibiting the
carriage of passengers in the load space of utilities, panel vans and trucks (1
January).
2006 Owner-onus regulations came into effect requiring responsible persons (vehicle
owners) to identify who was driving their vehicle at a particular time and introducing
an offence for failing to take reasonable measures to ensure that if a request for the
identity of a driver is made in relation to the vehicle, the responsible person will be
able to comply (1 January).
2006 New regulations for push-type motorised scooters introduced. Electric motors
with 200W or less power permitted and only to be used where wheeled recreational
devices permitted (29 December).
2007 Penalties increased for speeding, seat belts and penalties for other offences
amended (January) based on review by Road Safety Council. Fines for seat belt
non-wearing increased further in April 2007.
2007 Indemnity for persons reporting unsafe or dangerous drivers (6 July).
2007 New drug driving laws introduced (12 October).
2008 Zero BAC for novice drivers introduced (previously 0.02% BAC).
2008 Night time driving restrictions for novices in their first 6 months on a
probationary licence (p1) introduced (1 July).
2008 Fines increased for some speeding and seat belt offences (1 March)– light
vehicles: 20km/h to 29km/h increased from 5PU ($250) to 6PU ($300), 30km/h-
39km/h increased from 7PU ($350) to 14 PU ($700). Heavy vehicles 20km/h –
29km/h increased from 7PU to 8PU, 30km/h – 39km/h increased from 10PU to
17PU. Driver responsibility extended from passengers under 16 to all passengers
(irrespective of age) with fines increasing depending on numbers of unrestrained
passengers and whether driver restrained or not. If driver restrained but passengers
not: 1 passenger=10PU, 2=12PU, 3=14PU, 4 or more 16PU. Penalties greater if
driver also not wearing a seat belt.
2008 Driving in contravention of a driver's licence class condition constitute
unlicensed driving (30 June).
2008 Licences with photographs and signatures valid for 10 years (30 June).
2008 Learners permit validity extended from 1 to 3 years (30 June).
2008 Compulsory surrender of all driver's licence documents (i.e. driver's licence
cards) at commencement of a licence disqualification or cancellation. (30 June).
Reported Road Crashes in Western Australia 2011 157
2008 Disqualification of a WA driver's licence in another Australian jurisdiction
recognised in WA (30 June).
2008 Overseas visitor licence 12 month recognition replaced by allowance to drive while
visitor (30 June).
2008 New demerit point disqualification period based on the number of demerit points
accrued introduced with good behaviour option and double disqualification if re-
offence in probationary period. No extraordinary licences able to be obtained in
period (June 2008).
2008 Penalties increased for ‘hoon’ behaviour including roadside impounding for 1
week for first offence (July).
2009 Definition of unauthorised driving offences amended. Broaden circumstances
where a vehicle could be impounded for unauthorised driving offences. Roadside
impoundment unauthorised driving offences increased to 28 days. Hoon impounding
offences increased to 3 months roadside impoundment for a second charge (1 July).
2009 Enhanced Speed Enforcement Program commenced to upgrade entire traffic
camera fleet and processing systems to digital (July).
2010 Hoon legislation amended to remove the requirement of circumstances of
aggravation. All s.60 Reckless driving offences are now impounding offences. (1
January).
2010 Novice Driver Graduated Demerit Point Scheme
From 1 December 2010 a novice driver who hold a licence up to 1 year are restricted
to 3 demerit points in that year and 7 demerit points over 2 years. Any demerit points
accumulated above theserestrictions will result in a 3 month disqualification period.
2010 Immediate Disqualification for drivers charged with drink driving offences.
Drivers who are charged with an offence of drving with a BAC 08 and above are
served with a notice disqualifying the person from driving for a period of 2 months.
2010 Introduction of Redflex Red light/speed cameras and Vitronic PoliScan digital
speed cameras into the speed camera fleet (July).
2010 Child car restraints regulations amended to ensure that children aged under
seven years are restrained in an age-appropriate restraint. Children under four years
are also restricted from being seated in the front seat of a vehicle with two or more
rows (1 October).
2010 Restraints regulations amended to ensure all passengers are restrained in either a
seat belt or child restraint. The total number of passengers must, therefore, not be
greater than the total number of seat belts (1 October).
2011 Hands-free use of mobile phones whilst driving banned for all functions except
making and receiving a phone call and use of the satellite navigation function
(1 March).
2011 Last of the wet film Multanova radar speed cameras retired (April).
2011 Penalties increased for certain drink and drug driving offences (1 October).
Reported Road Crashes in Western Australia 2011 158
2011 Zero Blood Alcohol Concentration (BAC) applicable to a prescribed class of
drivers introduced. (1 October).
2011 LTI TruCam hand held speed cameras introduced into the speed camera fleet
(August).
2011 First fixed site speed camera installed on Mitchell Freeway (December).
2012 Mandatory Supervised Learner Driving Hours increased from 25 hours over six
months after the Practical Driving Assessment to 50 hours in total, with 25 hours now
required before the Practical test (November).
2013 Learner Approved Motorcycle Scheme (LAMS) introduced which increased the
range, frame size and style of suitable scooters and motorcycles that can be ridden
on an R-E class licence (January).

Reported Road Crashes in Western Australia 2011 159
GLOSSARY OF TERMS
5YA: Five-year average. Average calculated for the five years prior to 2010 (i.e. 2005 to 2009).
Alcohol-Related Crash: A crash that involved at least one driver/rider with a BAC of
0.05 g/100mL or above.
ARIA: (Accessibility/Remoteness Index of Australia). A geographical measure of remoteness. For
more information see < http://www.gisca.adelaide.edu.au >.
Articulated Truck: A vehicle consisting of a prime mover having no significant load carrying area,
but with a turn-table device that can be linked to a trailer. With or without a trailer the Gross
Combination Mass (i.e., the combined prime mover and trailer) must exceed 3.5 tonnes.
BAC: Blood alcohol concentration measured as grams of alcohol per 100mL of blood. A BAC of
0.05 g/100mL is equivalent to a BAC of 0.05 gm%.
Bicycle: A vehicle with one or more wheels that is designed to be propelled by human power
through a belt, chain or gears. It does not include a wheelchair, wheeled recreational device,
wheeled toy, or any vehicle with an auxiliary motor capable of generating a power output over 200
watts (whether or not the motor is operating).
Bicyclist: A person riding a bicycle, including pillion passengers.
Child Restraint: A device used for restraining a young child travelling in a motor vehicle (e.g. baby
capsule, baby seat, booster seat, etc.).
Child Road User: A road user under 17 years of age.
Col %: Column percentage.
Crash Severity: Derived from the most serious injury in a crash. The three levels are:
1. Fatal crash – involved a fatality;
2. Hospitalisation Crash – involved a person who was seriously injured, but no fatalities;
3. Other – involved minor or no/unknown injuries only.
Driver: Any person that is driving a vehicle (excluding a motorcycle, bicycle, animal or animal
drawn vehicle).
Driver/Rider: Any person in control of a vehicle (excluding a bicycle, animal or animal drawn
vehicle). Includes motor vehicle drivers and motorcycle riders, but excludes motor vehicle
passengers and motorcycle pillion and sidecar passengers.
Drivers/Riders Involved in Crashes: All persons in control of vehicles (excluding bicycles,
animals and animal drawn vehicles) that were in crashes. Includes drivers/riders who were not
injured as well as those who were injured or killed.
Fatal Crash: A road crash in which at least one person was killed immediately or died within 30
days of the crash, as a result of the crash.
Reported Road Crashes in Western Australia 2011 160
Fatality: A person who was killed immediately or died within 30 days of the day of a road crash as
a result of the crash.
Helmet: A protective device worn on the head to prevent injuries in the event of a crash.
Motorcyclists and bicyclists are required by legislation to wear a helmet that meets Australian
standards.
Hospital Admissions: The total number of times road users were admitted to hospital as a result
of road crashes. A single road user can be admitted to hospital more than once for treatment of
injuries sustained in a single crash and each admission is counted, hence the number of hospital
admissions will be higher than the number of people admitted to hospital as a result of road
crashes.
Hospitalisation Crash: A road crash that involved at least one serious injury but no fatalities.
In Scope Crashes: Crashes that occur on state or local roads, or any roads that are open to
public access (e.g. Kings Park, CALM roads and laneways). Does not include crashes that occur
off road or in car parks. Does not include collisions that occur due to a medical condition, suicide
attempts or police chases.
Injury Severity: The level of injury sustained by a person involved in a crash. The four levels
used in this report are:
1. Fatal – the person died within 30 days of the crash, due to injuries received in the crash;
2. Serious – the person was admitted to hospital as an inpatient for treatment of injuries
sustained in the crash, but did not die within 30 days of the crash. (In earlier volumes of
this series of reports, the term hospitalised was used instead of serious injury);
3. Minor – the person was injured and may have received medical attention, but was not
admitted to hospital as an inpatient. Includes injuries for which no medical treatment
was required;
4. None/Unknown – the person was not injured or it was not recorded whether any injuries
were sustained.
KSI: Killed or seriously injured.
KSI Rate: Number of persons killed or seriously injured per specified unit. In this report the
following KSI rates are provided:
1. per 10,000 registered vehicles,
2. per 100 million vehicle kilometres travelled and
3. per 100,000 population.
Mature Adult Road User: A road user aged 25 to 59 years.
Medical Attention Crash: A road crash in which the most serious injury resulted in a person
requiring medical treatment, but without being admitted to hospital.
Metropolitan: The area equivalent to the Perth Statistical Division as defined by the Australian
Bureau of Statistics.
Reported Road Crashes in Western Australia 2011 161
Minor Injuries: Injuries from a road crash in which the person was not admitted to hospital.
Includes injuries such as sprains and bruises, which may not require medical treatment.
Motorcycle: A motor vehicle with two or three wheels. Includes motor vehicles that have a
sidecar attached, motor scooters, mopeds, trail bikes and mini-bikes.
Motorcycle Pillion: A pillion or sidecar passenger of a motorcycle.
Motorcycle Rider: A person riding a motorcycle, motor scooter, moped, trail bike or mini-bike.
Excludes pillion and sidecar passengers – see Motorcycle Pillion.
Motorcyclists: A motorcycle rider or motorcycle pillion.
Motor Vehicle Occupant: An occupant of a motorised vehicle, excluding motorcycles, tractors
and trailer type vehicles (caravans, campers etc.). Excludes occupants and riders of non-
motorised transport, such as bicycles, animal drawn vehicles and ridden animals.
Multi-Vehicle Crash: A crash involving two or more moving vehicles.
n: Number.
N/R: Not reported. Where a count is less than ten, percentage changes are not reported.
Off-Road: Locations that are not classified as roads. Includes car parks, cycle paths, beaches,
parking areas, petrol stations, driveways and recreational areas.
‘Other’ Road User: Persons riding an animal or persons in an animal drawn vehicle.
Out of Scope Crashes: Crashes that occur due to a medical condition, deliberate acts (e.g.
suicide attempts), police chases or in off-road locations such as beaches, car parks, cycle paths,
driveways, petrol stations, recreational areas or ramps at boat harbours.
Passenger: Any person other than the driver travelling in a motor vehicle. Excludes persons
riding on an animal, bicycle or motorcycle and persons in an animal drawn vehicle.
Pedestrian: A person on foot or sitting or lying, a person in or on a wheeled recreational device or
wheeled toy, an occupant of a non-motorised wheelchair, an occupant of a motorised
wheelchair/gopher, a person pushing a motorised or non-motorised wheelchair. Includes a person
on roller skates, in-line skates or a skateboard, but excludes a person riding a bicycle. Also
includes a person who has just alighted from a vehicle.
Persons Killed or Seriously injured: The number of fatalities and persons seriously injured as
the result of a crash. Includes persons who were killed outright or died within 30 days of the day of
the road crash as a result of the crash and persons admitted to hospital as a result of a road crash
and who did not die from injuries sustained in the crash within 30 days of the crash.
Person Seriously Injured: A person admitted to hospital as a result of a road crash and who
does not die from injuries sustained in the crash within 30 days of the crash.
Region: Subdivisions of Western Australia used by Main Roads Western Australia.
Reported Road Crashes in Western Australia 2011 162
Restraint: A device designed to hold a person within the body of a vehicle and limit movement
during a crash, thereby reducing severity of injury. Includes inertia reel and fixed lap or sash seat
belts, and child restraints such as capsules. (See also Seat belt).
Rider: Used as an abbreviation for Motorcycle Rider in some tables and graphs. A person riding
a motorcycle, motor scooter, moped, trail bike or mini-bike. Excludes bicycle riders, motorcycle
pillion and sidecar passengers.
Rigid Truck: A vehicle constructed primarily for load carrying with a gross vehicle mass (GVM)
exceeding 3.5 tonnes.
Road: Any thoroughfare, highway or road that is open to or used by the public for the purpose of
driving or riding of motor vehicles.
Road Crash: Any unpremeditated incident where in the course of the use of any vehicle on a
road that was not temporarily closed off to the public, a person is injured or property is damaged.
The crash must involve vehicle movement. Does not include collisions that occur due to a medical
condition, deliberate acts (e.g. suicide attempts) or police chases.
Road User: Includes drivers, passengers, motorcycle riders, motorcycle pillion, bicycle riders,
persons riding an animal, persons in an animal drawn vehicle and pedestrians.
Road User Groups: Categories used to separate different road users. These categories are
used for hospital admission data only and are not directly comparable with the ‘Road User Types’
used for police-reported data.
Road User Types: Categories used to separate different road users. These categories are used
for police-reported data only and are not directly comparable with the ‘Road User Groups’ used for
hospital admission data.
Run-Off-Road Crash: Crashes in which a vehicle involved exits the carriageway, through a loss of
control, swerving to avoid a collision or for other reasons. After the vehicle has left the
carriageway it may also collide with a person, object, or vehicle, or it may roll over, and/or a person
may fall or be ejected from the vehicle.
Seat belt: A device designed to hold a person within the body of a vehicle and limit movement
during a crash, thereby reducing severity of injury. Includes inertia reel and fixed lap or sash seat
belts, and child restraints such as capsules. The device must meet the relevant Australian Vehicle
Design Rules and the Australian Standards. Drivers and passengers of motor vehicles must wear
seat belts.
Senior Adult Road User: A road user aged 60 years or over.
Serious Crash: A road crash that resulted in at leasxt one fatality and/or where at least one
person was seriously injured.
Reported Road Crashes in Western Australia 2011 163
Serious Injury Rate: The number of persons seriously injured per specified unit. In this report
the following serious injury rates are provided:
1. per 10,000 registered vehicles;
2. per 100 million vehicle kilometres travelled; and
3. per 100,000 population.
Seriously Injured: Admitted to hospital as an inpatient for treatment of injuries sustained in a
crash, but did not die within 30 days of the crash.
Single-Vehicle Crash: A crash in which only one moving vehicle was involved. Includes
collisions with pedestrians, animals and fixed objects such as a tree, pole, bridge, dropped load, or
parked vehicle, and includes non-collisions such as a roll-over.
Speeding: A vehicle is considered to be speeding if it travels at excessive speed for the prevailing
conditions, or above the posted speed limit.
Speed-Related Crash: A crash in which speed was found to be a factor in causing the road
crash.
Vehicle: Includes motor vehicles, trailers, trams, bicycles, animal drawn vehicles or animals that
are being ridden and motorised golf buggies. Excludes non-motorised wheelchairs, motorised
wheelchairs/gophers, trains, wheeled recreational devices and wheeled toys.
Wheelchair: A chair mounted on two or more wheels that is built to transport a person who is
unable to walk or has difficulty in walking. Does not include a pram, stroller or trolley.
Wheeled Recreational Device: A wheeled device built to transport a person that is propelled by
human power or gravity and ordinarily used for recreation or play. Includes in-line skates, roller
skates, skateboards and similar wheeled devices. Does not include a golf buggy, pram, stroller,
trolley, bicycle, wheelchair or wheeled toy.
Wheeled Toy: A child’s pedal car, child’s scooter, child’s tricycle or a similar toy. Does not
include a bicycle.
Young Adult Road User: A road user aged 17 to 24 years.

FEEDBACK QUESTIONNAIRE
We would appreciate your comments on this report. Please complete this questionnaire and
return it to the address below.
1. Which of the following best describes your area of work or study?
Planning and Infrastructure
Research
Main Roads
University Student
Police
High School Student
Health
Primary School Student
Local Government
School Librarian
Other (please specify) ______________________________________________________________
2. How did you come across this report?
It was sent to me
I found it in the school library
I requested it from a government
I found it in a public library
department and was sent the report
Website
Other (please specify) ____________________________________________________________________
3. Did you find all of the information you were looking for in this report?
Yes
No
4. What additional information would you like to have seen in this report?

5. Do you have access to the Internet at work or at home?
Yes
No
6. How would you feel about your future access to this publication being solely through the Internet?
................................................................................................................................................ fold here
7. Do you have any other comments or suggestions as to how this publication should be
improved?
Thank You
............................................................................................................................................... fold here
Attention: Matthew Legge
Office of Road Safety
Level 10,
40 St Georges Terrace
PERTH, Western Australia 6000
Please
Affix
Stamp
Here
