
Ally Bank
Community Reinvestment Act
Strategic Plan
January 1, 2023 – December 31, 2026
Table of Contents
SECTION I. INTRODUCTION 1
A.
Ally Bank Product Offerings and Business Strategy
1
B.
Ally Bank Financial Information
2
SECTION II. CRA STRATEGIC PLAN PROPOSAL 2
A.
Ally Bank’s Commitment to CRA
2
B. Overview of Strategic Plan, Effective Date and Term 2
S
ECTION
I
I
I.
ASSESSMENT AREA
3
A. Median Family Income and Population Data 3
B.
Housing Data
5
C. Economic Outlook and Other Relevant Data 8
SECTION IV. NEEDS AND OPPORTUNITES IN THE ASSESSMENT AREA 11
A.
Needs
in the
Assessment
Area
11
B. Opportunities in the Assessment Area 14
SECTION V. PUBLIC PARTICIPATION 17
A.
Informal Public
Suggestions
17
B. Formal Public Comment Solicitation 17
SECTION VI. ALLY BANK STRATEGIC PLAN and MEASURABLE GOALS 18
A.
Definitions
18
B. Framework and Methodology 19
C.
Measurable Goals for “Outstanding”
24
D. Measurable Goals for “Satisfactory” 25
E.
Strategic Plan Ratings System and Alternate Evaluation Method
2
7
SECTION V
I
I.
REQUEST FOR APPROVAL AND CONTACT INFORMATION
28
A. Regulatory Criteria for Approval 28
B.
Request for Approval of Ally Bank CRA Strategic
Plan 2023
–
202
6
28
C. Contact Information 28
APPENDICES 29
Appendix
1:
Ally
Bank Products, Deposits, Awards, and Financial Information
30
Appendix 2: Map of Assessment Area and Census Tracts 32
Appendix 3: Additional
Demographic Information
35
Appendix 4: Additional Needs Assessment Information 41
Appendix
5
:
Map of Broader Statewide or Regional Area
42
Appendix 6: Proof of Publication of Request for Public Comment 43
CONFIDENTIAL EXHIBITS (Bound Under Separate Cover)
Confidential Exhibit A: Financial Information
Confidential Exhibit B: Bases for Measurable Goals
Confidential Exhibit C: Analysis of CRA Performance of Peer Banks

1
SECTION I. INTRODUCTION
Ally Bank (or “Bank”) is a Utah state-chartered commercial bank established in August 2004 that maintains its
headquarters in Sandy, Utah. The Bank is an indirect wholly-owned subsidiary of Ally Financial Inc.
1
(“AFI” and,
collectively with Ally Bank, “Ally”) and is regulated at the federal level by the Board of Governors of the Federal
Reserve System (“Federal Reserve Board”) acting through the Federal Reserve Bank of Chicago (“Chicago FRB”).
At the state level, the Bank is regulated by the Utah Department of Financial Institutions (“UDFI”). As a federally
insured depository institution, Ally Bank is subject to the Community Reinvestment Act (“CRA”),
2
which requires
banks to help meet the credit needs of their entire community, including low- and moderate-income
neighborhoods. In light of Ally Bank’s nationwide direct business model and lack of branches, the Bank has
elected to be evaluated under the “strategic plan” performance test as provided in 12 C.F.R. §228.27. The Bank
has prepared this new CRA Strategic Plan for 2023-2026 (“this Strategic Plan” or “2023-2026 Plan”) to replace the
Bank’s current CRA Strategic Plan for 2020-2022 (“2020-2022 Plan”) that expires on December 31, 2022.
3
A. Ally Bank Product Offerings and Business Strategy
Ally Bank is a leading online bank that offers banking products and services nationwide with no branches or
ATMs.
4
Ally Bank offers deposit and loan products to consumers, including automotive vehicle financing,
mortgage financing through Ally Home, point of sale personal consumer loans through Ally Lending, consumer
credit cards through Ally Credit Card (securities-brokerage and investment-advisory services are offered through
Ally Invest, an Ally Bank affiliate). Ally Bank’s premier online deposit business offers a full spectrum of deposit
and other banking products, including savings, money-market and checking accounts, certificates of deposit, and
individual retirement accounts.
Ally Bank is a leading provider of auto finance and leasing products, and provides several financing solutions for
more than 20,000 automotive dealerships (including wholesale and dealer floorplan loans, real estate loans, and
working capital loans), and purchases new and used consumer and small business retail installment sale contracts
and leases. Ally Bank’s corporate finance business offers financing for equity sponsors and middle-market
companies. The Bank also manages a growing community development loan portfolio. See Appendix 1.A for Ally
Bank’s current product offerings.
Ally Bank is a customer-centric company with passionate customer service and innovative financial solutions. We
are relentlessly focused on “Doing it Right” and being a trusted financial-services provider to our consumer,
commercial, and corporate customers. The June 2021 elimination of overdraft fees on all Ally deposit accounts
demonstrates Ally’s passionate focus on “doing right” by its customers, especially those who may be financially
vulnerable or living paycheck-to-paycheck. The Bank’s ongoing strategy is designed to nurture long-term
customer relationships and capitalize on the shift in consumer preference to direct banking. Ally Bank’s
relentless focus on providing a superior customer experience has resulted in numerous awards, including “Best
Online Bank for Low Fees” from Money Magazine, and several other “Best Online Bank” awards from industry
and consumer publications.
5
Consistent with the accelerating industry trend toward digitally-based financial
services, Ally Bank will continue its direct banking business model and will focus on strengthening and expanding
existing relationships with its auto and deposit customers, in addition to attracting new customers with an
expanded suite of consumer products.
1
AFI is a leading digital financial services company that offers a wide range of financial products and services.
2
Codified at 12 U.S.C. §2901 et seq.
3
This Strategic Plan will have been submitted for approval shortly after the August 5, 2022, due date for public comments on the three federal banking agencies’ Notice of
Proposed Rulemaking regarding the Community Reinvestment Act published on May 5, 2022 (“May 2022 NPR”) 78 Fed. Reg. 33884 (proposed, June 3, 2022, but before the
issuance of any final rule. It is the Bank’s understanding that under applicable provisions in the NPR, and subject to the final rules, this Strategic Plan when approved would
remain in effect under the current CRA regulations until the expiration date of December 31, 2026.
4
In addition to the Bank’s headquarters in Sandy, Utah, Ally has primary operations in Detroit, Michigan; Charlotte, North Carolina; Fort Washington, Pennsylvania; New York,
New York; and Lewisville, Texas.
5
See Appendix 1.B for additional awards.

2
B. Ally Bank Financial Information
Ally Bank is profitable, growing, and well-capitalized. As of March 31, 2022, Ally Bank had $174.5 billion in total
assets, $145.2 billion in total deposits, $15.6 billion of total equity capital, and 9,515 full-time employees.
Additional financial information, including a link to the Bank’s Consolidated Reports of Condition and Income (Call
Report) as of March 31, 2022, are included at Appendix 1.C.
SECTION II. CRA STRATEGIC PLAN PROPOSAL
A. Ally Bank’s Commitment to CRA
Ally Bank embraces its obligations under the CRA as an extension of its strong LEAD
6
corporate culture of being
an “Ally” to its customers and communities and has devoted significant effort to complying with both the letter
and the spirit of the CRA. Ally Bank’s Board of Directors (“Ally Bank Board”) and senior management are deeply
committed to achieving meaningful impact in its communities. To this end, Ally Bank has established a
comprehensive CRA Program that involves participation from the Ally Bank Board, senior management, the
Bank’s CRA Department, and other Bank employees.
Ally Bank’s CRA Program is under the direction of the Ally Bank Board, with a Bank-wide management CRA
Committee comprised of members of senior management from the Business Lines, Finance, Risk, Compliance,
Corporate Communications, and Treasury. The CRA Committee is responsible for oversight of the Bank’s CRA
activities, the CRA Portfolio, and the Bank’s approved CRA Strategic Plan,
7
with designated senior managers
responsible for management of the Bank’s Community Development (“CD”) transaction approval process.
Ally Bank has demonstrated its ongoing commitment to CRA by building a strong CRA Department that consists of
individuals with extensive experience in the banking industry, particularly in the areas of affordable housing,
community development finance, community services, and legal and regulatory compliance. The Bank’s CRA
Officer is charged with overseeing the development and implementation of the Bank’s CRA Strategic Plan,
coordinating all CRA activities, and reporting to the CRA Committee and the Ally Bank Board on a regular basis.
The Bank’s CRA Department has developed deep ties in the community, and remains actively engaged with
community members, with an emphasis on finding and developing new or expanded ways to help meet
community needs in a safe and sound manner. The CRA Department performs extensive due diligence regarding
all proposed CRA loans and investments, and approvals follow the Enterprise Delegated Lending Authority and
the Bank’s CRA Policy. Ally Bank received an “Outstanding” CRA rating on its most recent CRA Performance
Evaluation, dated September 28, 2020.
8
B. Overview of Strategic Plan, Effective Date and Term
Ally Bank’s strong commitment to CRA is further evidenced by the extent and breadth of its measurable goals set
forth in this Strategic Plan: Ally Bank will make $5.4 billion in loans and investments over the four-year plan
period and will provide 3,300 volunteer hours of CD services to earn an “Outstanding” CRA rating. The overall
$5.4 billion goal amount is an increase from the 2020-2022 Plan’s $3.7 billion goal for “Outstanding.” The $5.4
billion goal amount is comprised of CRA-qualifying loans and CD investments, with annual interim goals, and also
contains specific assessment area goals for auto loans, mortgage loans, and CD loans/investments. This
considerable volume of CRA-qualifying loans and CD investments will allow the Bank to be even more responsive
to critical community needs and implement responsive, flexible, and innovative loans and investments. In
developing this 2023-2026 Plan and its proposed goals, the Bank sought and received input from numerous
6
Ally’s LEAD values include “Look Externally,” “Execute with Excellence,” “Act with Professionalism,” and “Deliver Results.”
7
The CRA Committee also has responsibility to review and approve the proposed CRA Strategic Plan and then make a recommendation for approval to the Ally Bank Board.
8
The Performance Evaluation can be accessed at: https://www.federalreserve.gov/apps/CRAPubWeb/CRA/BankRating.

3
entities representing a wide array of community partners as specified in Sections IV and V below. The goals are
set forth and described in greater detail in Section VI below.
The effective date of this Strategic Plan is January 1, 2023, and the term is four years: 2023-2026.
If during the term of this Strategic Plan there is a material change in circumstance, Ally Bank may request an
amendment to this Strategic Plan as provided for in 12 C.F.R. §228.27(h).
SECTION III. ASSESSMENT AREA
The Federal Reserve Board’s regulation implementing the CRA requires a bank to delineate one or more
assessment areas within which the bank’s record of helping to meet the credit needs of its community will be
examined. The assessment area must include the geographies in which the bank has its main office, its branches,
and its deposit-taking ATMs (12 C.F.R. §228.41(c)(2)). Because Ally Bank operates no physical branches or
deposit-taking ATMs, the Bank delineates its assessment area based on its Sandy, Utah headquarters located in
Salt Lake County. The Bank’s CRA assessment area in Utah (“UTAA”) includes Salt Lake County and seven
surrounding counties: Davis, Morgan, Summit, Tooele, Utah, Wasatch, and Weber (see map at Appendix 2.A). In
compliance with 12 C.F.R. §228.41(c) – (e), the UTAA includes only whole geographies or political subdivisions
(counties), does not reflect illegal discrimination, and does not arbitrarily exclude low- or moderate-income
(“LMI”) geographies. Ally Bank continues its efforts to expand CRA activities to more rural areas of Utah,
including three counties – Morgan, Summit and Wasatch – which were added to the Bank’s UTAA in 2017. These
rural areas often have lower median family incomes and do not receive as much benefit from CRA activities as
the more metropolitan areas such as Salt Lake County (see Table 1 below).
9
A. Population Data and Median Family Income
Data from the 2020 census indicates that Utah was the fastest-growing state in the nation over the past decade
with a population growth of 18.4%.
10
This growth shows no signs of slowing in the next decade, driven by both
net migration to Utah associated with economic factors discussed in Section C below and by the state having one
of the highest fertility rates in the nation of 1.92 births per woman versus the US average of 1.64.
11
The Bank’s UTAA contains a 2021 population of approximately 2.67 million (Table 1). This number has increased
5% since the 2018 data covered in Ally’s 2020-2022 strategic plan. Salt Lake is the most populous county,
surpassing 1.18 million people in 2021 and accounting for 35% of the state’s population.
12
Table 1: UTAA Population Data
9
Summit and Wasatch Counties are the location of several ski and summer resorts (such as Park City and Deer Valley) but have such a shortage of affordable housing that most
resort employees cannot afford to live near their work and must commute from long distances. Ally Bank has financed affordable rental workforce housing to help meet the
needs of LMI individuals who work in Summit and Wasatch Counties.
10
https://www.usnews.com/news/best-states/utah/articles/2021-04-26/utah-has-fastest-growing-population-2020-census-shows
11
https://www.deseret.com/2022/3/20/22965720/utah-fertility-rate-drops-reframe-conversation-children-public-good-private-responsibility
12
Population data used herein is from the United States Census Bureau Annual Estimates of the Resident Population for Counties: April 1, 2020 to July 1,
2021 at https://www.census.gov/data/datasets/time-series/demo/popest/2020s-counties-total.html.
County 2020 Population 2021 Est. Population
Davis 362,679 367,285
Morgan 12,295 12,657
Salt Lake 1,185,238 1,186,421
Summit 42,357 43,093
Tooele 72,698 76,640
Utah 659,399 684,986
Wasatch 34,788 36,173
Weber 262,223 267,066
AA Total 2,631,677 2,674,321
State of Utah Total 3,271,616 3,337,975
Ally Bank Assessment Area Population
Source: U.S. Census Bureau; FFIEC

4
In addition to growing, the state’s population is also diversifying. As of 2019, Utah was the 34
th
most racially and
ethnically diverse state in the nation, with 78% of the state identifying as non-Hispanic White and 22% of the
population identifying as another race (compared to a national average of 40% non-white). Hispanic/Latino
persons were 14% of the population and 1.2% of the population were African-American. The population of
diverse Utahans is expected to increase to 35% by the year 2060 with 22% of the population forecasted to be
Hispanic, 5% multi-racial, 4% Asian,2% African-American, and 2% Native American/Alaskan/Hawaiian. Since
2010, non-white racial and ethnic minority populations accounted for about 40% of Utah’s population increase
(Appendix 3-F, p. 9).
Poverty disproportionately impacts racial minorities in Utah with Native American adults (16%) and children
(27%) experiencing the highest rates of intergenerational poverty in 2020 compared to 2% of white adults and 2%
of white children (Appendix 3-E, p. 16). However, poverty rates are consistently lower in Utah than the United
States, with an estimated 12.3% of persons living in poverty in the United States in 2020 compared to 8.9% of
Utahans (Appendix 3-E, p. 7).
Several of the zip codes with the highest counts of individuals in intergenerational poverty are located within
Ally’s UTAA (Appendix 3-E, page 22). Ogden, located in Weber County, has the highest count of adults and
children in intergenerational poverty in the state.
There are currently 576 census tracts comprising Ally’s UTAA. The income breakdown of these census tracts is
set forth in Table 2. This Table reflects an overall increase of 100 census tracts from the 476 census tracts
reflected in Ally Bank’s 2020-2022, with a decrease of six low-income census tracts, an increase of 13 moderate-
income census tracts, and a decreased percentage of combined LMI census tracts from 25% of total tracts to 22%.
Table 2: UTAA Census Tract Demographics
All of the counties in the UTAA are included in the Salt Lake City-Provo-Orem Combined Statistical Area (“CSA”) as
defined by the Office of Management and Budget. Both Wasatch and Summit Counties are designated as non-
metropolitan areas and contain some of the more rural areas in Utah. The data in the charts below was collected
from the most recently available data as published online by the FFIEC and the U.S. Census Bureau. The 2021
income data by county, as reported by the Federal Financial Institutions Examination Council (“FFIEC”), is set
forth in Table 3.
County
Name
# of Low-
Income
Tracts
# of
Moderate-
Income
Tracts
# of Middle-
Income
Tracts
# of Upper-
Income
Tracts
Unknown
Tracts
Total # of
Census
Tracts
Davis 0 8 33 25 0 66
Morgan 0 0 3 1 0 4
Salt Lake 5 56 115 71 4 251
Summit 0 0 4 10 0 14
Tooele 1 6 8 1 1 17
Utah 9 24 76 43 4 156
Wasatch 0 0 2 7 1 10
Weber 2 15 34 7 0 58
TOTALS 17 109 275 165 10 576
% of Total 3.0% 18.9% 47.7% 28.6% 1.7% 100.0%
Source: FFIEC last updated 04/19/2022 (preliminary)
UTAA Census Tract Demographics

5
Table 3: UTAA Median Family Income Data
Approximately 15% of Utahans received at least one month of public assistance in 2020. Of these, 33% were
adults between 21 and 50 years of age, and 41% were children ages 0-17 (Appendix 3-E, p. 11). Data indicates
that in 2020, there were almost 195,000 children in Utah (21%) at risk of remaining in poverty as adults. One
item which helps families break out of the cycle of poverty is access to stable, affordable housing.
B. Housing Data
Utah’s nation-leading population growth has exacerbated the already existing affordable housing crisis in the
state, for both homeowners and renters, as the state’s housing supply is insufficient to meet demand. This is
especially true within the UTAA, with housing unit supply data for each county in the UTAA set forth in Table 4
below.
Table 4: UTAA Housing Data
In an effort to keep up with demand, residential construction value totaled $7.7 billion in 2021, a 12.8% increase
over the prior year. Permits for residential construction totaled 35,500 in 2021, compared to 32,237 in 2020. Of
County
Combined
Statistical Area
Code
Metropolitan
Statistical Area
Code
2021 FFIEC
Est. MSA/MD
non-MSA/MD
Median
Family
Income
("MFI")
Low Income
<50% of MFI
or below
Moderate Income
50% to <80% of MFI
Middle Income 80%
to <120% of MFI
Upper Income
120% MFI or
above
Salt Lake 482 41620 $91,700 $0 - $45,849 $45,850 - $73,359 $73,360 - $110,039 $110,040
Tooele 482 41620 $91,700 $0 - $45,849 $45,850 - $73,359 $73,360 - $110,039 $110,040
Davis 482 36260 $89,400 $0 - $44,699 $44,700 - $71,519 $71,520 - $107,279 $107,280
Weber 482 36260 $89,400 $0 - $44,699 $44,700 - $71,519 $71,520 - $107,279 $107,280
Morgan 482 36260 $89,400 $0 - $44,699 $44,700 - $71,519 $71,520 - $107,279 $107,280
Utah 482 39340 $83,700 $0 - $41,849 $41,850 - $66,959 $66,960 - $100,439 $100,440
Summit 482 99999 $74,100 $0 - $37,049 $37,050 - $59,279 $59,280 - $88,919 $88,920
Wasatch 482 99999 $74,100 $0 - $37,049 $37,050 - $59,279 $59,280 - $88,919 $88,920
UTAA Median Family Income Data
Source: FFIEC last updated 7/14/21
County
Total # of
Housing
Units
Total # of 1-
4- Family
Units
% of
Occupied 1-
to 4-Family
Units
% of
Owner
Occupied
Units
% of
Vacant
Units
% Renter
Occupied
Salt Lake 372,990 297,442 75% 62% 6% 32%
Tooele 20,148 18,948 76% 71% 8% 21%
Davis 101,756 92,214 81% 74% 4% 22%
Weber 87,515 76,706 73% 65% 8% 26%
Morgan 6,400 6,360 79% 79% 6% 16%
Utah 155,425 136,128 71% 64% 4% 32%
Summit 27,083 20,640 49% 38% 49% 13%
Wasatch 22,704 21,040 56% 52% 29% 19%
Source: FFIEC, last modified 4/22/2022
UTAA Housing Data

6
this, 12,000 permits were for apartment units resulting in a 3
rd
consecutive year where multi-family permits
exceeded single family permits (though only the fifth time in the state’s recorded history that multi-family
permits outnumbered single family) (Appendix 3-A, p. 157). The majority of this activity has been concentrated in
the Salt Lake City area. Building permits were granted for 34,500 apartment units in Salt Lake County between
2011-2021, three times the 11,600 units permitted between 2000 and 2010 (Appendix 3-B, p. 1).
Because demand for housing units has outpaced supply, data from the Federal Housing Finance Agency reported
by the Gardner Policy Institute at the University of Utah (“Gardner Institute”) notes that the Salt Lake City
metropolitan statistical area (“MSA”) has experienced the third largest housing price increases over the past five
years of any top 100 metropolitan area, behind only Boise and Tacoma. Between the second quarter 2016 and
second quarter 2021, Salt Lake MSA single family housing prices increased by 79%, an average of 12.3% per year.
Rental rates increased by 37% over that same period, an average annual increase of 6.5% (Appendix 3-B, p. 2).
The Gardner Institute reports as of December 2020, the state’s median housing price was $380,000, making
home ownership unaffordable for 48.5% of households in the state. Additional price increases through 2Q 2021
pushed the unaffordability percentage above 50% (Appendix 3-C, p. 1). The graph below shows the steady rise of
home prices since 2013, including a 28.3% spike in the second quarter of 2021 as COVID migrations drew
additional people to the area (Appendix 3-C, p. 3).
The state’s major urban markets have been especially hard hit. As of February 2022, Ogden is the 3
rd
most
overpriced housing market in the nation with a 61.25% premium. Provo is ranked 7
th
with a 53.66% premium and
Salt Lake City is ranked 9
th
with a 52.3% premium.
13
Gardner Institute experts note that pricing increases have
occurred for a record six continuous years, with double-digit increases in some years, and describe the resulting
impact on pricing of single-family homes and condos as “perilous territory”.
14
There is little indication that the challenges to single-family housing affordability will stop soon. Realtor.com’s
2022 Housing Forecast ranked Salt Lake City as the nation’s top housing market for the year, projecting 23.7%
increases in sales and prices for the year.
15
The dramatic pricing increases in the single-family housing market has made buying a home unaffordable for
many families, contributing to increased demand for multi-family housing. The Gardner Institute reports that Salt
Lake County had 148,500 rental units at year-end 2021, but only 2% of these were vacant, creating the lowest
13
https://business.fau.edu/executive-education/housing-market-ranking/housing-top-100/index.php
14
https://www.deseret.com/utah/2020/12/9/22165836/housing-affordability-in-utah-entering-perilous-territory-study-says
15
https://news.move.com/2021-12-07-Realtor-com-R-Forecasts-the-Top-Housing-Markets-of-2022

7
vacancy rate in the 20 years for which data is recorded (Appendix 3-B, p. 1). Similar record low vacancies were
reported in Davis County of 1.9%, Utah County 2.2% and Weber County 2.1% (Appendix 3-C, p. 10). Limited
supply combined with high demand is driving apartment rents up: a September 2021 report by property
management firm Entrata found the average rent in 5 major Utah counties rose 45% in just 18 months (Appendix
3-L).
Source: Entrata; Utah’s Rental Market by the Numbers, 10 September 2021 (Appendix 3-L)
The COVID-19 pandemic also had a negative effect on construction of new housing units. The supply chain was
disrupted, particularly for building materials sourced from China and lumber from Canada, and quarantine
activity slowed the availability of labor (Appendix 3-C, p.11).
Unfortunately, construction currently underway as well as proposed apartment development will not be
sufficient to meet demand. There are 12,367 units under construction in Salt Lake County and 9,665 units
proposed. The Gardner Institute forecasts these will result in an apartment vacancy rate of just 5.7% by 2024
(Appendix 3-B, p. 3).
As Utah continues to be one of the nation’s fastest growing states, it is forecasted that demand for affordable
housing will continue to outpace supply. The rise in home prices will remain a barrier to homeownership for
lower-income households, and the limited supply of affordable rental housing will remain a challenge.
The following are key statistics regarding Utah’s housing affordability:
· Between 2010 and 2020, the growth in Utah households exceeded the growth in housing units by 44,500
housing units. The Gardner Institute notes “the shortage has created record low rental vacancy rates, the
smallest supply of unsold vacant new homes, and the smallest supply of vacant for-sale existing homes.
In other words, the shortage has removed vacant units from the housing market, an unhealthy condition

8
leading to higher housing prices and rental rates. Given the sizeable gap between household growth and
housing units, it will take several years for the housing market to return to a healthy condition” (Appendix
3-C, p. 8).
· Even before the pandemic, individuals and families living in the metro Salt Lake area were feeling the
impacts of insufficient affordable housing. Through 2018 (the most recent data reported by HUD’s
Comprehensive Housing Affordability Strategy), more than 41% of renter households in Salt Lake County
(nearly 60,000 renter households) were housing-burdened, paying more than 30% of their income for
housing and utilities. This number increased from 20% of renter households in 2009 (Appendix 3-B, p. 2).
· More than 50% of households in Utah are unable to afford the median price single-family home. For
renters, home ownership is increasingly more difficult due to record price increases. In 2019, 63.1% of
renter households could not afford the median home price, growing to 72.8% in 2020 (Appendix 3-C, p.
14).
· According to the National Low-Income Housing Coalition, the Fair Market Rent for a two-bedroom
apartment in Salt Lake County is $1,051 per month. In order to afford this level of rent /utilities without
paying more than 30% of gross income on housing, a household must earn $48,160 annually. A minimum
wage earner would need to work 128 hours per week to afford a 2-bedroom home (Appendix 3-D).
C. Economic Outlook and Other Relevant Data
Utah has experienced a relatively strong recovery from the COVID-19 pandemic. The state added 72,500 jobs in
2021, making up for the 20,900 jobs lost in 2020 as well as adding 51,600 new jobs. While the state’s travel and
tourism industry has been among the slower industries to recover, Utah ski resorts had a record number of visits
in the 2020-2021 season as did visitors to the state and national parks. (Appendix 3-A, p. 161) The real estate and
construction industries remain strong due to factors discussed in the preceding section. Salt Lake County added
25,000 jobs in 2021, a 3.5% increase. The county posted a record-low unemployment rate of 1.7% in December
2021 (Appendix 3-B, p. 2).
In August of 2021, Forbes ranked Utah the top state for Gross Domestic Product (”GDP”) growth, reporting “The
Utah economy has been a powerhouse in recent decades, hence the reason why it takes the No. 1 spot. Over the
last five years, Utah’s GDP grew by an excellent 19.1%, the second-highest growth rate for that period out of all
50 states.” Utah’s GDP growth was only second to Washington state.
16
According to the March 2022 Utah Employment Summary, issued by the state’s Department of Workforce
Services, all industry sectors except the professional and business services sector (which helps supply temporary
labor to businesses, a difficult task in such a tight labor market), have added jobs over the past year. Utah’s job
growth was 4%, slightly below the national average of 4.6%. The state’s 2.0% unemployment rate was below the
national average of 3.6%.
17
One fast growing industry sector in the state is technology, for which the region has been nicknamed “Silicon
Slopes.” Of tech sector employees moving to the state, 79% said outdoor recreation and/or access to wilderness
and public lands was the dominant factor in their choice to move to Utah.
18
For more than 10 years, Utah has
consistently ranked within the top quartiles of many national indices as a hub supporting both small businesses
and technological advancements. Specific rankings in recent years include:
· In the 2022 WalletHub List of Best Small Cities to start a business, Utah holds 10 cities in the top 30 for
best cities to start a business.
19
16
https://www.forbes.com/sites/andrewdepietro/2021/08/04/2021-us-states-by-gdp-and-which-states-have-experienced-the-biggest-growth/?sh=2a7d15bc846c
17
https://jobs.utah.gov/blog/post/2022/04/14/utah-s-employment-summary-march-2022#continue
18
https://gardner.utah.edu/wp-content/uploads/Utah-Outdoor-Partners-Survey-Jan2021.pdf?x71849&x71849
19
https://wallethub.com/edu/best-small-cities-to-start-a-business/20180

9
· According to data by real estate data company Clever, Salt Lake City ranks as the second-best startup city
in the U.S. (behind Las Vegas). This is due to Salt Lake’s high concentration of CEOs providing access to
experience and networking opportunities (4.1 per 1,000 residents, three times the national average of
1.42 per 1,000) as well as the region’s highly educated workforce (more than half of those over age 25
have a bachelor's degree). University of Utah start-up businesses raised a record $884 million in
investment capital in 2021, and start-ups affiliated with Brigham Young University have raised $6.25
billion in venture capital funding to date (Appendix 3-H).
· According to the Milken Institute’s 2022 Report on Best-Performing Cities, a ranking based on jobs,
wages, and specifically high-tech growth, Utah holds two of the top three rankings in Tier 1 Large Cities
(Prove-Orem, UT and Salt Lake City, UT) and the top two spots in Tier 1 Small Cities (Logan, UT-ID and St.
George, UT). The report notes these rankings mark the continued success of the region in creating jobs
and raising wages (Appendix 3-I, p. 1).
As additional evidence of the strong technology and business sectors, in 2021, Utah’s technology and
enterprise/SaaS software sector accounted for 41% of the state’s $32.1 billion in equity related financial
transactions (Appendix 3-K). In addition to traditional enterprise and SaaS related technology, Utah is home to a
burgeoning healthcare innovation hub, with Utah’s healthcare technology seed-stage startups attracting a record
setting $79 million dollars raised in 2021 and health care innovation (developing new medicines, diagnostics,
services, and delivery methods to improve patients’ access and quality of care) representing $13 billion of the
state’s GDP (Appendix 3-J and Appendix 3-A, p. 141-144).
One measure of Utah’s economic health is the Hachman Index for economic diversity. Using indicators such as
gross domestic product or employment, the index measures the mix of industries present in a particular region
relative to a well-diversified reference region. Scores range from 0 to 100, with a higher score indicating more
economic diversity, while a lower score indicates less economic diversity. In 2021, Utah fell from the most
economically diverse state in the U.S. in 2019 to sixth with a Hachman Index score of 95.47 (Appendix 3-A, p. 75).
Data is also available for counties within the UTAA. In general, urban counties tend to have more diverse
economies with a larger variety of employment opportunities and a wider range of industry sectors available to
the population. Salt Lake, Weber, Davis, Utah, and Tooele all have index scores above 75, ranking them in the
top 10 counties in the state for economic diversity. Summit County’s economy is tourism-based around Park City,
and therefore it has employment concentrations in arts, entertainment, recreation, accommodations, and food
services. Morgan County also has a low Hachman Index score because it has the state’s highest concentration of
construction-related employment (Appendix 3-A, p. 76).
Table 5: UTAA Hachman Index
Source: (Appendix 3-A, p.75-78).
County Hachman Index, 2020
Salt Lake 93.90
Tooele 79.10
Davis 85.70
Weber 88.90
Morgan 53.40
Utah 82.00
Summit 38.90
Wasatch 67.00
Utah overall 95.50
UTAA Hachman Index Scores

10
Economists report a tight labor market, combined with low housing supply and corresponding high housing
prices, pose the greatest risk to Utah’s economic growth in the next few years. Unemployment is expected to
remain around 2%, which will create upward pricing on labor wages (Appendix 3-A).
The following highlights were taken from the full 2022 Economic Report to the Governor (Appendix 3-A):
• Personal Income: Utah’s total personal income in 2021 was an estimated $179.2 billion, a 5.7% increase
from $169.7 billion in 2020. Utah’s estimated 2021 per-capita income was $53,859, up 3.2% from
$52,204 in 2020 and a 24% increase from the 2017 per-capita income of $43,459 data reported in Ally’s
2020-2022 Plan. Components of personal income include net-work earnings, dividends/interest/rent and
transfer payments including government benefits such as Social Security. Utah has the lowest share of
transfer receipt income of any state. The highest work earnings from Utah’s private sector came from
the professional, scientific, and technical services sector, followed by manufacturing and construction
(Appendix 3-A, p.29).
· Public Education: In fall 2021, there were 675,247 students in Utah’s public education system, an
increase of 8,638 students (1.3%) from fall 2020. Although Utah’s student population is primarily White
(72.4%), it is becoming more diverse. In fall 2021, 18.7% of Utah’s student body was Hispanic or Latino,
1.6% was Asian, 1.6% was Pacific Islander, 1.3% was African-American or Black, 0.9% was Native
American/Alaskan/Hawaiian, and the remaining students (3.3%) identified with multiple ethnicities.
According to the 2017 state population projections, within the school-age population (5 to 17 years of
age) individuals identifying as non-White will grow from 25% in 2015 to 42% in 2065. In fiscal year 2018,
the most recent year for which National Center for Education Statistics data are available by state, Utah’s
net current expenditure per pupil was $7,576 (the nation’s lowest). However, some consider current
expenditure as a percent of total personal income as a better measure of Utah’s effort to fund public
education. Using this measure, Utah ranks 36th nationally, at 3.5% of personal income (Appendix 3-A, p.
103).
• Nonprofit Sector: Internal Revenue Service (“IRS”) data shows that Utah has 10,750 nonprofits operating
within the state, a 0.40% increase from 2020, with total assets from reporting entities worth $38.2
billion, a 12.9% increase from the year prior. The sector also reported total income of $33.7 billion, a
24.6% increase, and total revenue of $17.3 billion, a 3.3% increase. While the IRS reports an increase in
revenue at nonprofits from 2020 to 2021, the data reveals that the vast majority of nonprofits in Utah are
small. Accordingly, 6,526 nonprofits don’t report any income (religious organizations and those with
income below $50,000 are not required to report). In April 2021, the Utah Nonprofits Association (UNA)
surveyed Utah nonprofits about their finances, changes in demand for their services, financial resiliency,
and staffing. The results indicate that 74% of nonprofits who responded to the survey have seen an
increase in demand for services. While these nonprofits’ total revenues decreased by 30% in 2020
compared with 2019, organizations estimated a 10% increase in 2021 compared with 2020. Nonprofits
also projected a 37% decline in 2021 staffing compared with 2019 (Appendix 3-A, p. 149).
· 2060 Projections: The Gardner Institute economists forecast Utah’s population to grow from 3.3 million
in 2020 to 5.5 million in 2060 with a corresponding increase from 1.1 million households in 2020 to 2.2
million in 2060. An aging population will play a role in a projected decrease in household size, from 3.0
people per household in 2020 to 2.3 in 2060. The Greater Salt Lake Economic Region will lead this
growth, growing from 2.8 million residents in 2020 to 4.6 million in 2060. Utah County’s projected
addition of nearly 674,000 residents between 2020 and 2060 results in a population of 1.3 million and
driving over one-third of total regional growth. A projected 2060 population of 1.7 million will keep Salt
Lake County as the largest county in the future. Utah’s growing economy will likely add 1.3 million jobs
over the next four decades to reach 3.4 million jobs by 2060. Salt Lake (545,500 jobs), Utah (346,500
jobs), Davis (114,000 jobs), and Washington (109,900 jobs) counties account for over 80% of the

11
anticipated job growth. The projected job gains in construction (207,100 jobs), health care and social
assistance (184,900 jobs), and professional, scientific, and technical services (195,100 jobs) sectors drive
this change (Appendix 3-A, p. 165).
SECTION IV. NEEDS AND OPPORTUNITIES IN THE ASSESSMENT AREA
As detailed in Ally Bank’s Previous Strategic Plans, the Bank engages in several ongoing needs assessment
activities, including regular meetings and calls with several community partners (as discussed below) for the
purpose of determining community needs. In formulating this 2023-2026 Plan, Ally Bank has built upon its
previous needs assessment efforts with updates through both informal processes and a more formal survey
process described below.
A. Needs in the Assessment Area
Covid-19 has had significant impacts in Utah since early 2020 and magnified the needs of already vulnerable
people in Utah. Utah had the sixth highest rate of Covid cases per million people in the country, yet experienced
one of the lowest fatality rates of all the states which was primarily attributed to its relatively young population.
Utah also experienced one of the lowest unemployment rates in the country following the onset of COVID-19,
although unemployment did spike to over 10% in the early stages then quickly recovered. Those in poverty and
lower income service workers in the hospitality and retail sectors were disproportionately affected, experiencing
job or wage loss of 38% due to the pandemic which was twice the rate of the general labor force in 2020
(Appendix 3-E, p. 4). In general, the immediate impacts from Covid appear to have been largely alleviated with
help from unemployment benefits, the federal stimulus package and policy changes. However, evaluation
continues with regard to the potential for longer-lasting impacts on academic achievement, economic success,
and physical and mental health. Comments from many of the UTAA service providers indicate that in most cases,
the challenges facing lower income populations were exacerbated by the impacts of Covid, with rising inflation
already placing increased hardships on lower-income individuals and families.
1. Informal Needs Assessment Process: Several Ally Bank employees are actively involved in leadership
roles with local community organizations, the missions of which include serving the needs of LMI individuals
within the UTAA. During the course of their service, these employees derive meaningful Information from their
informal interactions, which facilitates ongoing access to timely information relevant to community needs and
the related gaps in services. The Bank also engages in regular communication with several additional entities
operating within the Bank’s UTAA, including affordable housing developers, affordable housing loan funds,
nonprofit community service providers (including healthcare, mental health, and substance abuse treatment
providers), and providers of small business capital.
Ally Bank senior executives have also participated over the years in the Bank’s needs assessment process through
meetings with various nonprofit and for-profit entities to learn about needs within the Bank’s UTAA, as well as
related challenges and opportunities. Although in-person meetings have been greatly reduced due to COVID-19
restrictions, the Bank’s President of Consumer & Commercial Banking Products, along with the Auto Chief
Operating Officer, participated in meetings with key community partners in the UTAA. Ally senior management
has continued an ongoing dialogue with impactful organizations about additional support and opportunities for
expansion. CRA loan officers continue to devote considerable time and effort structuring loans with various
nonprofits to assure that these loans would best serve the needs and mission of each organization while also
meeting the Bank’s requirements.
In addition to direct communication with numerous community partners, Ally Bank also reviewed and analyzed
several informative reports provided by government entities, as well as community development and research
organizations, to help identify needs within the UTAA (links to these reports are in Appendices 3 and 4.B).

12
2. Formal Needs Assessment Process: As part of updating its needs assessment, the Bank developed a
needs assessment survey and invited participation from numerous community-based agencies and other
organizations that are engaged in qualifying community development activities and serve residents within the
UTAA. This year, fifty-six (56) organizations responded to the survey (see Appendix 4-A for a list of survey
participants) and provided responses to questions regarding:
· Organizational focus
· Geographies and populations served
· Greatest needs of populations served
· Top challenges experienced by populations served
· Primary barriers to achieving organizational mission
3. Needs Assessment Findings and Conclusions: The top four greatest needs consistently identified by the
organizations responding to the Bank’s survey were similar to those identified through the Bank’s 2019 survey,
although with a different priority, and include the following:
a. Affordable Housing (remained the greatest need)
b. Employment Opportunities
c. Access to Affordable Healthcare (including mental health)
d. Educational Opportunities
The four areas of greatest need identified through the Bank’s survey overlap to a significant extent with the
issues identified in the various government and economic reports and needs assessments analyzed by the Bank
(see Appendices 3.A-H and 4.B).
a. Affordable Housing: Organizations representing a broad cross section of survey respondents
most often cited lack of access to safe, decent, affordable housing as the greatest need for lower-income
individuals and families. This is particularly true for special needs populations including (i) homeless individuals;
(ii) aging adults; (iii) persons with disabilities; (iv) individuals coming out of the criminal justice system; and
(v) individuals receiving mental health and substance abuse treatment. One respondent observed that access to
stable, affordable housing is essential in order to address a myriad of needs experienced by lower-income
individuals and families, such as financial stability, healthcare, mental well-being, education and more.
The lack of affordable housing has continued to be recognized as the biggest challenge for these populations and
the need continues to grow, particularly given the rising barriers to homeownership and the increased costs to
build affordable rental housing. Home prices and rental rates have continued to rise significantly over the past
two years, with the affordable housing crisis particularly concentrated in households with income below the
median, as discussed in Section III.B above. Affordable rental housing remains in short supply, with
approximately 41% of renters spending more than 30% of household income for housing expenses, and nearly
19% of renters spending at least 50% of household income for housing. The Bank has actively supported, and will
continue to support, the creation and preservation of affordable housing through direct loan originations, loan
purchases, loan participations, lines of credit to Community Development Financial Institutions (“CDFI”) and loan
funds such as the Rocky Mountain Community Reinvestment Corporation (“RMCRC”), as well as investments in
Low Income Housing Tax Credits (“LIHTC”) and affordable housing preservation funds.
b. Employment Opportunities: Survey respondents cited employment opportunities as the second
greatest need among the populations they serve. While Utah’s unemployment rate has been one of the lowest
in the nation over the past few years, the unemployment rate does not account for individuals who are employed
but face challenges such as (i) employment that is not secure or may be temporary or part-time; (ii) low wage

13
jobs that provide insufficient income to meet family needs; (iii) lack of access to training to improve job skills and
wages; (iv) lack of benefits such as health insurance or paid sick leave; and (v) record of prior criminal activity.
One respondent noted that the demand for job training and educational opportunities has increased since many
individuals left the service industry due to Covid. Additionally, respondents noted that for many individuals,
including refugees, the path to better economic stability may be self-employment.
Because small businesses are a significant source of job creation, support for the formation and expansion of
small businesses helps address the need for more and better jobs. The Bank has provided, and will continue to
provide, access to capital and technical assistance programs for small businesses through charitable grants, loans,
and investments. The Bank has worked with organizations such as the Wasatch Community Gardens, Flourish
Ventures, The Suazo Business Center, and the Utah Microenterprise Loan Fund which provide job training
programs, facilitate entrepreneurship, and support small businesses through loans and technical assistance.
The Bank has also made investments through Small Business Investment Company (“SBIC”) funds (both debt and
equity) and community development venture capital funds to support the growth of small businesses and job
creation.
c. Access to Affordable Healthcare: The third most frequently cited need was access to affordable
healthcare, including (i) dental care; (ii) vision services; (iii) mental health treatment; and (iv) substance abuse
treatment. While Utah’s uninsured rate is relatively low compared to other states, it is not consistent
throughout the state nor for all population groups. According to Utah public health data, approximately 12% of
all Utah adults are uninsured; however, areas in some rural counties in the state have uninsured rates in excess
of 15% (Appendix 3-A, p. 131 & 138). Utah residents with lower household income, particularly those who live in
poverty and who lack education, are most likely to be without health insurance. Some minority populations have
been disproportionately affected, with uninsured rates of approximately 23% for Black/African Americans and
nearly 30% for Hispanic/Latinos (Appendix 3-A, p. 136). One survey respondent commented that due to job loss
during the pandemic, many individuals and families lost access to health insurance.
The rising cost of health insurance premiums and deductibles has compounded the problem by causing a
significant increase in high-deductible health plans. Both lack of insurance and high deductibles often cause
individuals to delay or avoid treatment for medical conditions, which ultimately results in more critical illness and
increased costs for treatment. Despite gains in the number of children who have healthcare coverage, Utah has
one of the worst rates of uninsured children, ranking sixth highest out of all states in the nation (Appendix 4.B-5,
p. i). There is also a growing need to proactively address behavioral health in Utah children to mitigate the
longer-term implications such as suicide and depression, particularly in the aftermath of the pandemic. Several
survey respondents noted the emotional strains of the pandemic greatly affected children, witnessing parents’
anxieties while facing school closures, remote learning, and isolation from friends due to social distancing. Lower
income adults were also negatively impacted for similar reasons, including job or income loss, lack of access to
resources, and social isolation. The Bank has facilitated access to healthcare through charitable donations to
agencies such as Maliheh Clinic, Comunidades Unidas, Wasatch Homeless Healthcare, Polizzi Clinic, Friends for
Sight, and Utah Partners for Health, as well as loans and investments to support construction of public health
clinics.
d. Educational Opportunities: The lack of educational opportunities was frequently cited by survey
respondents, in particular (i) education relating to financial literacy; (ii) early childhood education;
(iii) homeownership preparation; and (iv) English as a Second Language. One survey respondent observed that
learning how to manage money was one of biggest challenges they saw with families at income levels below
125% of AMI (defined below). Several organizations commented on the detrimental effects from remote
learning and social isolation, with two charter schools serving low-income children reporting significant negative
impacts. One school noted that 70% of its students fell behind academically while another stated that many
students began the 2021-22 school year a full year behind academically.

14
Chronic absenteeism is more prevalent among children living in poverty at 24% compared to only 10% for all
Utah students (Appendix 3-E, p. 30). Earnings potential and financial security are highly correlated to the level of
education completed by an individual, with those lacking a high school diploma at a much higher risk of living in
poverty. Utah has made some progress, improving the graduation rate for children in poverty from 50% up to
79% since 2012. Although Utah is ranked as the sixth healthiest state, the United Health Foundation reports
health disparities continue to exist based on a variety of factors including socioeconomic status (Appendix 3-A, p.
131). Early childhood education can address these issues to help reverse intergenerational poverty.
Utah is a refugee resettlement area, with 15,000+ refugees settled in Utah since 1995 (Appendix 4.B-3). This has
contributed to rapidly growing ethnic and cultural diversity in Utah, creating a need for services to integrate into
the local community, facilitate English language proficiency, and secure employment. The cap for the refugee
resettlement program was recently raised with more refugees coming to Utah, which will place greater pressure
on local non-profits that address the needs of this population. The Bank has actively supported a variety of
educational programs through charitable donations and services, as well as loans, to support agencies such as the
International Rescue Committee, Neighborhood House, Guadalupe Schools, Success in Education,
NeighborWorks Mountain Country Home Solutions, and the Community Development Corporation of Utah.
The Bank’s survey also asked responding organizations to identify the greatest challenges to achieving their
respective missions. The top two barriers cited were inadequate funding resources and limited organizational
capacity. The challenges cited by most organizations include: (i) decline in funding resources due to tax reform
and resulting cuts in Federal programming; (ii) donor fatigue; (iii) the unwillingness of many institutional donors
to provide funds for operations; and (v) limited staffing with inability to pay an adequate wage and provide
competitive benefits. The staffing challenge is evident given the extremely low unemployment rate in Utah
(2.7%). It has been further exacerbated by the significant number of people who either left the workforce due to
Covid or left the non-profit sector for higher paying jobs with employers (such as fast-food establishments) that
were able to raise their minimum wage. Based on information collected through a survey conducted by the Utah
Nonprofits Association, as well as responses from the Bank’s survey, most nonprofits have experienced an
increase in demand for services and a significant decline in staffing.
These findings are supported by several national studies covering the nonprofit sector which consistently cited
lack of resources, including funding needs and inadequate staff, as the biggest challenges. One report noted that
community-based organizations (CBOs) affect the lives of one in five Americans, with the recipients of those
services and society as a whole facing significant risks if CBOs are not adequately funded. The Bank supports
capacity building through a diversified charitable donation program, as well as services and technical assistance,
all of which provide broad nonprofit support within the Bank’s UTAA.
Ally Bank has taken these needs into consideration in formulating this Strategic Plan and will continue to focus on
the issues identified through the Bank’s community needs assessment process – specifically, affordable housing,
job opportunities through economic development, educational opportunities, and access to healthcare. The
Bank plans to continue working with existing community partners, as well as identifying new organizations and
community development opportunities, in an effort to remain aware of community needs and opportunities.
B. Opportunities in the Assessment Area
Ally Bank has drawn upon an increased number and variety of sources (from its 2019 assessment) to assess both
the needs and opportunities in the UTAA. While there are unmet needs in the UTAA as discussed above, many of
the needs are not readily addressed through CD loans and investments (most requests from LMI service providers
are for charitable donations). Ally Bank continues to work diligently with a wide array of community partners in
the UTAA to develop additional ways to meet the UTAA’s needs other than through donations, but opportunities
to deploy significant amounts of capital in the form of CD loans or investments are limited because of Utah’s
relatively small population base (under 3.3 million people) and the disproportionate number of large banks with

15
CRA assessment areas (“AAs”) in Utah. These two combined factors create an extraordinarily competitive
environment for CRA-qualifying loans and investments, which has become even more challenging in the three
years subsequent to the submission of Ally’s 2020-2022 Plan due to the significant asset growth of the large non-
traditional banks that have Utah AAs significantly outpacing population growth in Utah, as discussed more fully
below.
1. Small Population in UTAA: The population of Ally Bank’s UTAA is just under 2.7 million people.
Although Utah was the fastest growing state in the nation over the past ten years (see Section III.A above), Utah
remains a relatively small state with just under 3.3 million people. A smaller population results in:
· fewer federal tax credit allocations,
· fewer strong nonprofits to which Ally Bank can extend CD loans, and
· fewer CD investments, including CRA-qualifying bonds.
For example, affordable housing is a strong need in the UTAA, but most multifamily affordable housing projects in
Utah rely on some level of federal or local government subsidy in order to keep rents low enough to be
affordable for LMI individuals.
20
Federal housing subsidies are typically based on state population. The average
amount of federal LIHTC allocated to Utah and awarded by the state housing finance agency over the last five
years is relatively small: approximately $92 million (which resulted in an average of 15 multifamily affordable
housing projects per year and the addition of 640 new affordable housing units per year).
21
The addition of 640
new affordable housing units per year is a positive step, but does not come close to alleviating the growing
shortage in available affordable housing units estimated to be 54,000 units.
State subsidies also play a smaller role in affordable housing, but can be restricted by state budget constraints in
any given year. In the area of single-family affordable housing, over the last three years the state housing finance
agency issued only $216 million in CRA-qualifying taxable housing revenue bonds. By contrast, the state housing
finance agency has originated an average of $1.1 billion of new single-family loans annually over the past three
years. Utah Housing Corporation (Utah’s largest financer of affordable housing) has made a shift away from the
use of mortgage revenue bonds (“MRB”), with the bulk of the loans sold as Ginnie Mae, Freddie Mac or Fannie
Mae mortgage-backed securities with only $27.3 million of new taxable MRBs issued last year.
22
2. Disproportionate Number of Large Banks in a small state: Utah is home to numerous non-traditional
banks that offer banking products and gather deposits nationwide but typically do not have branches or ATMs
that would result in a CRA AA. Utah’s concentration of these large non-traditional banks stems primarily from
the rapid growth in the Utah Industrial Bank industry starting in the mid-1990s and continuing through 2005,
when companies such as Merrill Lynch, American Express, General Electric, BMW, General Motors, Sears, Wright
Express, Fry’s Electronics, and Target obtained Industrial Bank charters. Additionally, several of today’s largest
non-traditional banks with Utah CRA AAs previously operated under an Industrial Bank charter (see Table 6
below).
Many of the non-traditional banks have assets over $10 billion, with six of them having assets over $85 billion
(see Table 6 below). In fact, the six largest non-traditional banks have combined total assets of over $1.191
trillion as of 3/31/2022, an increase of over $425 billion (approximately 56%) from the $766 billion of total assets
these same six banks had as of 6/30/2019:
20
In light of the restricted amount of LIHTC awarded to Utah, many participants in the affordable housing industry are working collaboratively on developing methods of
increasing the amount of affordable housing units without reliance on government subsidies. However, these are not easy issues, and an acceptable solution may take several
more years to develop.
21. See Utah Housing Corporation website located at the following link: https://utahhousingcorp.org/multifamily
22
See Utah Housing Corporation 2020 and 2021 Annual Reports at the following link: https://utahhousingcorp.org/multifamily

16
Table 6: Large Non-Traditional Banks (Assets > $85B) with a Utah Assessment Area
There are also 21 Utah state-chartered commercial banks (with combined total assets of $192 billion), most of
which have branches/AAs in Salt Lake County. There are also 16 Utah Industrial Banks with combined total assets
of $179 billion (Appendix 3-N). In addition to all of the banks listed above, there are several large national retail
banks that also have Utah AAs: Bank of America, Chase Bank, Wells Fargo Bank, U.S. Bank, Key Bank, Zions First
National Bank, and Bank of the West. In the June 30, 2021 FDIC Summary of Deposits, there were 44 FDIC-
insured banking or savings institutions with 202 office/branch locations in Salt Lake County alone.
The presence of so many banks, including some of the country’s largest banks by asset size, in such a small state
(in both population and area) results in extremely stiff competition for the limited supply of even the most
routine CD loans and investments, such as mortgage-backed securities (“MBS”) or bonds issued by the Utah
Housing Corporation. Because Ally Bank has less than 1% of its consumer loans in the UTAA, CD loans and
investments will continue to play vital role in Ally Bank’s CRA activities.
The combination of the UTAA’s small population and the number of increasingly large banks competing for the
same CD loans and investments has resulted in the Salt Lake area being known as a CRA “hot spot,” with
significantly higher pricing and “CRA premiums” on many loans and investments. There is fierce competition for
CD loans and also CRA-qualifying MBS in the UTAA, resulting in significant “CRA premiums.” Simply put, Utah
does not have enough capacity to absorb the combined billions of dollars per year of CD loans and investments
the banks listed above seek to deploy.
Ally Bank’s highest CRA priority has always been – and will continue to be – to demonstrate responsiveness to the
needs and opportunities in its UTAA. In light of the challenges in obtaining sufficient amounts of CD loans and
investments in the UTAA, and in accordance with the 2013 revisions to the Interagency Questions and Answers
Regarding CRA (“Interagency Q&A”), Ally Bank began actively seeking CD opportunities in the broader statewide
or regional area (“BSRA”) that includes the UTAA. In order to deploy the $5.4 billion in new loan and investment
originations under this Strategic Plan, Ally Bank will need to continue the strategy of making CD loans and
investments in the BSRA. For purposes of this Strategic Plan, Ally Bank’s BSRA will include the following 11
contiguous states of the West Region of the United States: Arizona, California, Colorado, Idaho, Montana,
Nevada, New Mexico, Oregon, Utah, Washington, and Wyoming (see map at Appendix 5).
Total Assets as of
3/31/2022
Regulator & Charter
Bank
Location
CRA Assessment Area
Ally Bank* $174,479,000,000 FRB - State Commercial Bank Utah
Salt Lake County + seven
additional Counties in Utah
American Express National Bank*
$132,189,503,000 OCC - National Bank Utah
Salt Lake, Summit, and Tooele
Counties in Utah
Goldman Sachs Bank* $474,643,000,000 FRB - State Commerical Bank
New York
(with Utah
branch)
Two AAs: (1) Multistate MSA
35644 (New York-Northern New
Jersey-Long Island, NY-NJ-PA);
and (2) Salt Lake, Summit, and
Tooele Counties in Utah
Morgan Stanley Bank* $201,737,000,000 OCC - National Bank Utah Salt Lake County
Synchrony Bank $86,123,000,000 OCC - Federal Savings Bank Utah
Formerly three AAs: Salt Lake,
Summit, and Tooele Counties in
Utah
UBS Bank USA $122,409,837,000 FDIC - Utah Industrial Bank Utah Salt Lake County
Total Assets: $1,191,581,340,000
*Formerly chartered as a Utah Industrial Bank

17
SECTION V. PUBLIC PARTICIPATION
A. Informal Public Suggestions
Ally Bank has sought informal suggestions and input from members of the public in the UTAA, as required by
12 C.F.R. §228.27(d)(1). The Bank works with numerous community partners (both Utah-based and
nationally/nationwide) in the development and refinement of its overall strategy to provide responsive loans,
investments, and services and also regarding measurable goals. Many of those community partners participated
in the Bank’s needs assessment survey discussed above. The categories of entities providing informal suggestions
include the following:
· Affordable Housing Developers (both nonprofit and for-profit)
· State Housing Finance Agencies
· Local Housing Authorities
· Community Development Financial Institutions (“CDFIs”)
· Affordable Housing Loan Funds
· Nonprofit Community Service Providers
· Healthcare Providers (including Substance Abuse Treatment Providers)
· Local Food Banks and Homeless Shelters
· Educational Service Providers
· Financial Literacy and Individual Development Account (“IDA”) Providers
· Small Business Equity and Loan Funds
· Small Business Development Centers
· Community Development Representatives
· Entities involved in New Markets Tax Credit (“NMTC”) Projects
· State, County, and Local Municipalities
· Economic Development Agencies
· Rural Agency Service Providers
· Local and Regional Public Policy Research Organizations
Regarding categories of needs to be addressed, the informal suggestions closely mirrored the needs identified in
the Bank’s formal survey results. In addition, several community partners requested that the Bank continue to be
active in providing capital to small businesses and in helping to establish new and innovative ways to finance
small businesses and foster entrepreneurism. Regarding the proposed increased amounts of specific UTAA goals,
partners expressed strong support, especially in light of the competitive CRA environment in Utah.
B. Formal Public Comment Solicitation
Ally Bank solicited formal public comment on this Strategic Plan for 30 days by publishing notice in at least one
newspaper of general circulation in the UTAA, as required by 12 C.F.R. §228.27(d)(2), and made copies of this
Strategic Plan available to members of the public who requested it during the 30-day timeframe. A copy of the
proof of publication is attached at Appendix 6. The Bank’s request for comment was published on August 7,
2022, and the 30-day public comment period concluded on September 6, 2022. Ally Bank received one request
for a copy of this Strategic Plan but did not receive any public comments. Prior to submission, this Strategic Plan
was approved by Ally Bank’s CRA Committee and the Ally Bank Board.

18
SECTION VI. ALLY BANK CRA STRATEGIC PLAN AND MEASURABLE GOALS
This Strategic Plan and its measurable goals reflect thorough analyses of the credit needs and opportunities in
Ally Bank’s UTAA (including significant public input); the Bank’s business strategy, capacity, and constraints; the
Bank’s two previous CRA Strategic Plans; the Bank’s past CRA performance; the CRA performance of peer banks;
and recently approved CRA Strategic Plans of other banks. Ally Bank’s measurable goals reflect the latitude
described in the Federal Reserve Board’s Guidelines for Requesting Approval for a Strategic Plan Under the
Community Reinvestment Act (“FRB Strategic Plan Guidelines”), which provide as follows:
The strategic plan evaluation option in the regulation provides a bank with the opportunity to tailor its
CRA objectives to the needs of its community and to its own capacities, business strategies and expertise.
Therefore, not all of the factors described in the regulation would necessarily apply to each strategic
plan. A bank has a great deal of latitude in constructing a strategic plan, but it is expected that public
participation in development of the plan will provide a bank access to the fullest possible information
about the needs of its community and how those needs might be met.
Ally Bank’s measurable goals also reflect the regulatory flexibility regarding a bank’s measurable goals, both in
how the goals are expressed and regarding the three performance categories (loans, investments, and services).
For example, although the regulations provide that a bank should address in its plan all three performance
categories and emphasize lending and lending-related activities, they also provide:
Nevertheless, a different emphasis, including a focus on one or more performance categories, may be
appropriate if responsive to the characteristics and credit needs of its assessment area(s), considering
public comment and the bank’s capacity and constraints, product offerings, and business strategy
(12 C.F.R. §28.27(f)(ii)).
Ally Bank has developed its two main measurable goals based upon these regulatory guidelines. Ally Bank
believes strongly that the construct of the combined loans and investments goal, in particular, will provide the
Bank with the critical flexibility necessary to be much more responsive to community needs and opportunities as
they arise.
Certain goals in this Strategic Plan were partially derived from confidential, proprietary non-public information
and analyses. Therefore, where noted, the basis for the goals is contained in Confidential Exhibits that are bound
separately from this Strategic Plan.
A. Definitions
As used in this Strategic Plan, the following definitions
23
shall apply:
· “Auto Loan” includes:
(1) loans to LMI consumers for the purchase of a vehicle (“LMI Consumer Auto Loan”), and
(2) closed-end loans of $1,000,000 or less to businesses located in an LMI census tract for the
purchase of a vehicle (“Small Business Auto Loan”).
23
For all defined terms, the LMI qualification shall be determined based on AMI/ MFI figures applicable as of the date of origination or purchase by Ally Bank or AFI, regardless of
any subsequent changes in AMI/MFI.

19
· “Broader Statewide or Regional Area” or “BSRA” shall include, for purposes of Ally Bank’s CD
activities, the 11 contiguous states of the West Region of the United States: Arizona, California, Colorado, Idaho,
Montana, Nevada, New Mexico, Oregon, Utah, Washington, and Wyoming (Appendix 5).
· “CRA-Qualifying Loan” includes the following loans either originated or purchased by Ally Bank (or, at
the Bank’s election, AFI): (1) CD Loans; (2) Mortgages to LMI Borrowers as defined below; and (3) Auto Loans as
defined above.
· “Community Development” (“CD”) has the meaning set forth in 12 C.F.R. §228.12(g)(1) – (5), with
sections (1) through (4) as follows:
1. Affordable housing (including multifamily rental housing) for low- or moderate-income individuals;
2. Community services targeted to low- or moderate-income individuals;
3. Activities that promote economic development by financing businesses or farms that meet the
size eligibility standards of the Small Business Administration’s Development Company or Small
Business Investment Company programs (13 CFR 121.301) or have gross annual revenues of
$1 million or less; or
4. Activities that revitalize or stabilize:
(i) low- or moderate-income geographies;
(ii) designated disaster areas; or
(iii) distressed or underserved nonmetropolitan middle-income geographies designated by the
Board of Governors of the Federal Reserve System, FDIC, and the Office of the Comptroller of
the Currency. . . .
· “CD Loan” has the meaning set forth in 12 C.F.R. §228.12(h): a loan that has as its primary purpose
community development and . . . benefits the bank’s assessment areas(s) or a broader statewide or regional area
that includes the bank’s assessment area(s).
· “CD Investment” has the same meaning as “Qualified Investment” set forth in 12 C.F.R. §228.12(t): a
lawful investment, deposit, membership share, or grant that has as its primary purpose community development.
· “CD Service” has the meaning set forth in 12 C.F.R. §228.12(i): a service that has as its primary
purpose community development and is related to the provision of financial services.
· “Mortgage Loan to LMI Borrower” means a loan to an LMI borrower for the purchase or refinance of
a residence.
· “New Originations” for a calendar year will include new CD Investments, new CRA-Qualifying Loans
either originated or purchased by Ally Bank, and existing CD Loans that are renewed and credit underwritten that
year (can only count each loan once per year).
B. Framework and Methodology
Ally Bank will make $5.4 billion in loans and investments and provide 3,300 volunteer hours of CD Services over
the four-year plan period to earn an “Outstanding” CRA rating. There will be two main goals: the first goal is for
combined CRA-Qualifying Loans & CD Investments and the second goal is for CD Services. The framework and
methodology for each of these two goals are discussed below.
1. Goal for Combined CRA-Qualifying Loans & CD Investments: There is one overall combined goal of
$5.4 billion for new originations of CRA-Qualifying Loans & CD Investments (“Combined Loans & Investments

20
Goal”), which is almost 10% higher on an annualized basis than the Bank’s 2020 – 2022 Plan’s goal of $3.7 billion.
There are also annual interim goals from $1.3 billion to $1.4 billion (see Table 7 below) that increase gradually
from Plan Year 1 through Plan Year 4:
Table 7.1: Annual Interim Goal Ranges for Loans/Investments
The Combined Loans & Investments Goal also contains the following features:
· UTAA goals: Because Ally Bank’s highest CRA priority is responding to the needs and opportunities in
the UTAA, there are three specific UTAA lending and investment goals that must be achieved through CRA-
Qualifying Loans or CD Investments that benefit the UTAA, including activities in the BSRA that directly benefit
the UTAA and entities whose purpose, function, or mandate includes serving geographies or individuals located
within the UTAA (Interagency Q&A §___.12(h)-6)). The three specific UTAA goals below all reflect increases that
correspond to the overall goal increase:
o Auto Loans: This goal encompasses both LMI Consumer Auto Loans and Small Business Auto
Loans and is appropriate in light of Ally’s position as a national leader in auto finance. This goal
contains a requirement that at least 90% of the Small Business Auto Loans must be $100,000 or
under.
o Mortgage Loans to LMI Borrowers: This goal is reflective of Ally’s commitment to affordable
single-family housing for LMI individuals.
o CD Loans/Investments: This goal is appropriate because CD Loans and CD Investments have
historically made up the vast majority of the dollar amounts of Ally Bank’s CRA performance in the
UTAA, primarily because Ally Bank’s nationwide business model results in the Bank having small
dollar amounts of its consumer/small business loans in the UTAA. The CD Loans/Investments goal
amount is based upon a number of factors, including the Bank’s business model, the Bank’s asset
growth, and the performance of similarly situated lenders (additional bases for the CD
Loans/Investments goal amount is set forth in Confidential Exhibits B and C).
· UTAA or BSRA: The Combined Loans & Investments Goal framework provides that if Ally Bank
achieves the three specific UTAA goals for a calendar year, then Ally Bank will also receive credit for amounts
deployed in that same calendar year as (a) either CD Investments, CD Loans or Mortgage Loans to LMI Borrowers
that will benefit (b) either the UTAA or the BSRA (CD activities in the BSRA do not have to benefit the UTAA).
Pursuant to applicable regulations, Mortgages to LMI Borrowers are not subject to the BSRA geographic
restrictions on CD Loans/Investments/Services. Accordingly, if the UTAA goals for LMI Mortgage Loans are met,
LMI Mortgage Loans anywhere in the United States will count toward the total goal amounts.
· Any amount in excess of the designated “annual interim goal” amount in one calendar year for a
certain asset category may be applied toward the next calendar year’s “annual interim goal” for that same asset
category. This will allow Ally Bank the flexibility to meet needs that may arise late in a calendar year without
concern about significantly exceeding the annual interim goal amount for that year.
2023
2024
2025
2026
Ally Bank CRA Strategic Plan 2023-2026 Goals for "Outstanding"
I. Combined Goal for CRA-Qualifying Loans
1
& CD Investments for "Outstanding"
Four-Year Plan Goal for 2023-2026 for "Outstanding": $5.4 billion in New
2
Originations
Annual Interim Goals for "Outstanding":
$1.300 billion
$1.325 billion
$1.375 billion
$1.400 billion

21
· For purposes of this Strategic Plan and all defined terms herein, the LMI qualification shall be
determined based on Area Median Income (“AMI”)/Median Family Income (“MFI”) figures applicable as of the
date of origination or purchase by Ally Bank or AFI, regardless of any subsequent changes in AMI/MFI.
· As allowed under CRA regulations, Ally Bank may, but is not required to, choose to take credit for
CRA-Qualifying Loans and CD Investments originated or purchased by AFI, any subsidiary of AFI, or any affiliate or
subsidiary of Ally Bank.
The overall construct of the Combined Loans & Investments Goal allows Ally Bank the important flexibility to
structure transactions in ways that are most responsive to community needs, which may differ from year to year.
For example, in one specific calendar year there may be an opportunity to extend large amounts of CD Loans, but
the next year there may be few such opportunities. Additionally, pricing and availability of certain types of CD
Investments (both equity and debt) may vary widely from year to year. The framework will also allow Ally Bank to
more effectively manage its increasingly large and complex CRA Portfolio.
Ally Bank’s goal amounts for “Outstanding“ are set forth in Section VI.C. below (these goal amounts are
consistent with the framework of goals set forth in Ally Bank’s 2020 – 2022 Plan). This Strategic Plan also
contains a Combined Loans & Investments Goal for “Satisfactory” (broken into “High Satisfactory” and “Low
Satisfactory,” as set forth in Section VI.D. below). In establishing goal levels for “Outstanding” and “Satisfactory,”
Ally Bank followed regulatory guidance that the goals must be “measurable” (12 C.F.R. §228.27(f)(3)).
From a performance context perspective, Ally Bank also considered its own past performance and goals, as well
as those of similarly situated lenders (large non-traditional banks operating under approved CRA Strategic Plans).
The 2023 – 2026 Plan goal amounts represent an almost 10% increase on an annualized basis from the goal
amounts in the 2020-2022 Plan, while the Bank’s total assets increased by approximately 4% (from $167.5 billion
as of 12/31/2019 to $174.5 billion as of 3/31/2022). Ally Bank’s $5.4 billion overall goal amount for new loan and
investment originations represents approximately .70% of its 2023-2026 projected Average Total Assets (and
approximately .77% of its current Total Assets), which is appropriate based upon the performance of similarly
situated lenders, including the .56% weighted average of new originations of large non-traditional banks
operating under CRA Strategic Plans approved by the Federal Reserve, and the .60% weighted average excluding
highest and lowest of six non-traditional banks with assets over $75 billion (see Confidential Exhibits B and C for
further discussion and analysis). Ally Bank has sought and received informal input regarding the 2023 – 2026 Plan
goals, including the overall goal amount (annualized) and also the specific amounts for the three UTAA goals
(annualized), from several community partners. These community partners expressed support for the proposed
overall goal amount (annualized) and the specific UTAA goals, especially in light of the Bank’s strong level of CRA
activity in the UTAA over the past few years, and also the proposed increase in the UTAA goal amounts.
In executing the Combined Loans & Investments Goal, Ally Bank’s CD Loans and Investments will likely include the
following:
· Loans to financial intermediaries such as CDFIs
· Loans to organizations engaged in affordable housing construction or rehabilitation, including
multifamily rental housing, targeted to benefit LMI individuals
· Loans to or equity investments in LIHTC projects
· Loans to or equity investments in NMTC projects
· Loans to or equity investments in SBICs and community development venture capital funds that
promote economic development by financing small businesses
· Loans to or equity investments in community facilities that provide services targeted to benefit LMI
individuals

22
· Loans to or equity investments in projects that revitalize or stabilize LMI geographies
· Purchase of mortgage-backed securities with underlying loans to LMI individuals
· Purchase of state and municipal obligations, such as revenue bonds, that specifically support
affordable housing or other categories of community development
· Charitable donations to entities providing services to LMI individuals
Ally Bank will continue its efforts to seek to develop innovative, complex and/or responsive loans and
investments similar to the University Growth Fund I (“UGF”), Kickstart Seed Fund III (“Kickstart”), and the Salt
Lake County Pay for Success Development Fund (all described in Ally Bank’s CRA Performance Evaluations dated
February 21, 2017 and September 28, 2020).
24
More recent examples of such projects include Ally Bank’s $5
million lead investment in the Fearless Fund (early stage venture capital fund formed by three Black women to
provide seed capital to small businesses owned by women of color), Ally Bank’s $30 million of investments in
Altura Capital funds (owned and lead by Latino team that focuses on financing minority-owned small businesses
and helping them scale), and $10 million investment in NEF Emerging Minority Developer Fund (Confidential
Exhibit B contains further discussion of such loans and investments, including those currently in development).
2. Goal for CD Services: There is one goal for CD Services, which is expressed in terms of the number of
hours spent performing qualifying CD Services. The Bank’s goals for number of CD Service hours for
“Outstanding“ are set forth in Section VI.C. below, and represent Ally Bank’s strong commitment to serving its
community. Historically, most of the Bank’s CD Service hours have been performed by Utah-based Bank
employees. The 3,300 hours goal for “Outstanding” is essentially flat to the 2020-2022 Plan (825 hours per year
down slightly from 833 hours per year), due to the Bank’s reduced institutional capacity. There are fewer
employees in the Bank’s Utah office than there were when the Bank submitted its 2020-2022 Plan, all of whom
will need to perform an increased number of hours per employee to meet the 3,300-hour goal.
The largest components of the Bank’s CD Service hours are (a) service on qualifying nonprofit Boards of Directors
(or Committees) that focus on affordable housing or community services targeted to benefit LMI individuals, and
(b) teaching financial literacy to LMI individuals. Ally Bank anticipates that these two categories of services will
continue to be major components of the Bank’s overall CD Services efforts during 2023 – 2026.
Table 7.2: Annual Interim Goals for CD Services
Under this Strategic Plan, the CD Service hours may be performed by Bank employees, members of the Ally Bank
Board, or by employees of AFI or any subsidiary of AFI. At least 50% of the CD Service hours must be within the
UTAA, with the remaining 50% benefitting either the UTAA or the BSRA. Any CD Service Hours in excess of the
designated “annual interim goal” in one calendar year may be applied toward the next calendar year’s “annual
interim goal.”
24
The Performance Evaluation can be accessed at: https://www.federalreserve.gov/apps/CRAPubWeb/CRA/BankRating.
2023
2024
2025
2026
1 At least 50% of the CD Hours per year must be in the UTAA, with the other 50% benefitting either the UTAA or the BSRA.
2 Any CD Service Hours in excess of the designated Annual Interim Goal in one calendar year may be applied toward the next calendar year's Annual
Interim Goal.
II. Goal for Community Development Service Hours for "Outstanding"
Four-Year Plan Goal for 2023-2026: 3,300 Hours
1
Annual Interim Goals for "Outstanding":
790 hours
2
810 hours
2
840 hours
2
860 hours
23
In carrying out the CD Services goal, Ally Bank’s CD Services will likely include one or more of the following:
· Providing technical assistance on financial matters to nonprofit, tribal, or government organizations
serving LMI housing or economic revitalization and development needs
· Developing or teaching financial education or literacy to LMI individuals and in LMI geographies
· Supporting organizations and facilities providing education and services for LMI children, students, and
adults
· Providing credit counseling, homebuyer and home-maintenance counseling, financial planning, or other
financial services education to promote community development and affordable housing
· Other qualified service opportunities that may be identified in the future
Ally Bank has consistently participated in and promoted innovative and responsive CD Service opportunities that
impact the needs of LMI populations. A recent example is the Bank’s development and implementation of a
comprehensive 12-month financial literacy and match savings program tailored to the specific needs of an
innovative nonprofit organization that offers an opportunity for ex-convicts, homeless individuals, and people
with substance abuse issues to change their lives through participation in a free two-year residential program
that provides vocational training, education, and other supportive services (this nonprofit does not accept any
government or insurance funding, but sustains itself through the small businesses run by program participants).
Several Bank employees have taught various cohorts of the financial literacy classes and mentored the
participants, while two other employees served on the Development Committee to help raise donations to fund
the savings match for those who sign a savings contract and save regularly for one year. Over the years, the
nonprofit had documented that those who stayed in the residential program for longer periods of time were
much more likely to remain crime free and drug free after leaving the program. In response, Ally Bank and the
nonprofit structured the savings match component to offer higher savings matches to those staying longer, which
will help reduce recidivism.
As noted above in Section IV, the demand for technical assistance to nonprofit organizations remains one of their
biggest challenges. Ally Bank strives to be a long-term partner to these organizations, with several Ally
employees who have served for many years with important community partners. For example, one Ally Bank
volunteer has served over ten years on the Board of an entity that specializes in services to developmentally
disabled adults (including supportive housing and job opportunities). Another employee has served on the Board
of an affordable housing fund for eight years, including two years as Board Chair. Other representative CD
Service activities of Ally employees include:
· Service on the Loan Committees of three large and highly regarded affordable housing funds located in
Utah, California, and Oregon
· Service on the Loan Committee of a minority-led nonprofit CDFI
· Service on the Board, Finance Committee, and Investment Committee of a nonprofit that provides
quality, affordable day care (for children and also adults) and other support services to LMI families
· Service for a nonprofit that provides coaching, mentoring, and employment workshops for LMI women
transitioning from welfare to employment and self-sufficiency.
Ally Bank looks forward to seeking additional opportunities to provide impactful service by partnering with
critical nonprofit community partners during 2023 – 2026.

24
C. Measurable Goals for “Outstanding”
Table 8 below sets forth Ally Bank’s measurable goal amounts for “Outstanding” (based upon the definitions
and framework discussed in Sections VI.A. and VI.B. above):
Table 8: Ally Bank CRA Strategic Plan Goals for “Outstanding”
2023
2024
2025
2026
$millions
Category Geography
Plan Year 1
(2023)
Plan Year 2
(2024)
Plan Year 3
(2025)
Plan Year 4
(2026)
$1,300
3
$1,325
3
$1,375
3
$1,400
Utah Assessment Area
("UTAA")
8
Sub-Goals
1. Auto Loans
3,4
UTAA $23 $23 $24 $25
2. Mortgage Loans to LMI Borrowers
3
UTAA $21 $21 $22 $23
3. Community Development ("CD")
Loans/Investments
3
UTAA $307 $314 $325 $330
$351 $358 $371 $378
2023
2024
2025
2026
1 At least 50% of the CD Hours per year must be in the UTAA, with the other 50% benefitting either the UTAA or the BSRA.
2 Any CD Service Hours in excess of the designated Annual Interim Goal in one calendar year may be applied toward the next calendar year's Annual Interim
Goal.
UTAA or BSRA
6,7
$949
3
$967
3
$1,004
3
$1,022
Four-Year Plan Goal for 2023-2026: 3,300 Hours
1
Annual Interim Goals for
"Outstanding":
790 hours
2
810 hours
2
840 hours
2
860 hours
5
If Ally Bank achieves the UTAA goals for a calendar year, then Ally Bank will also receive credit for amounts deployed in that same calendar
year as either (a) CD Loans, LMI Mortgage Loans, or CD Investments that will benefit (b) either the UTAA or the BSRA (CD activities in the
BSRA do not have to benefit the UTAA).
6
For CD Loans, Investments or Services, the BSRA includes Arizona, California, Colorado, Idaho, Montana, Nevada, New Mexico, Oregon,
Utah, Washington, and Wyoming.
7
Per applicable regulations, LMI Mortgage Loans are not subject to the BSRA geographic restrictions on CD Loans/Investments/Services;
accordingly, if the UTAA Goal for Mortgage Loans to LMI Borrowers is met, Mortgage Loans to LMI Borrowers anywhere in the United States
will count towards the total goal amounts.
8
"UTAA" includes the following eight counties in Utah: Davis, Morgan, Salt Lake, Summit, Tooele, Utah, Wasatch and Weber.
II. Goal for Community Development Service Hours for "Outstanding"
2
"New Originations" for a calendar year will include new CD Investments, new CRA-Qualifying Loans either originated or purchased by Ally
Bank, and existing CD Loans that are renewed and credit underwritten that year (can only count each loan once per year).
3
Any amount in excess of the designated Annual Interim Goal in one calendar year for a certain asset category may be applied toward the
next calendar year's Annual Interim Goal for that same asset category.
4
"Auto Loans" include: (a) loans to LMI consumers for the purchase of a vehicle; and (b) closed-end loans of $1,000,000 or less to
businesses located in LMI census tracts for the purchase of a vehicle, 90% of which must be $100,000 or under.
Total Combined CRA-Qualifying Loans &
Investments:
UTAA Goal Subtotals:
CD Loans, Mortgage Loans to LMI
Borrowers or CD Investments
5
1
"CRA-Qualifying Loans" include the following loans either originated or purchased by Ally Bank or its affiliates: (a) CD Loans; (b) Mortgages
to LMI Borrowers; and (c) Auto Loans, as defined in Footnote 4.
Ally Bank CRA Strategic Plan 2023-2026 Goals for "Outstanding
"
I. Combined Goal for CRA-Qualifying Loans
1
& CD Investments for "Outstanding"
Four-Year Plan Goal for 2023-2026 for "Outstanding": $5.4 billion in New
2
Originations
Annual Interim Goals for
"Outstanding":
$1.300 billion
$1.325 billion
$1.375 billion
$1.400 billion
Breakdown of Annual Interim Goal Amounts for "Outstanding": New
2
Originations for CRA-Qualifying Loans
1
&
CD Investments

25
D. Measurable Goals for “Satisfactory”
This Strategic Plan has separate measurable goal amounts for “High Satisfactory” and “Low Satisfactory,” each of
which has corresponding point values in the Plan Ratings System described in Section VI.E. below.
1. Measurable goals for “High Satisfactory”: Table 9 below sets forth Ally Bank’s measurable goal
amounts for “High satisfactory” (subject to the definitions and framework discussed in Sections VI.A.
and VI.B. above):
Table 9: Ally Bank CRA Strategic Plan Goals for “High Satisfactory”
2023
2024
2025
2026
$millions
Category Geography
Plan Year 1
(2023)
Plan Year 2
(2024)
Plan Year 3
(2025)
Plan Year 4
(2026)
$1,125
3
$1,150
3
$1,200
3
$1,225
Utah Assessment Area
("UTAA")
8
Sub-Goals
1. Auto Loans
3,4
UTAA $20 $20 $21 $22
2. Mortgage Loans to LMI Borrowers
3
UTAA $18 $18 $19 $20
3. Community Development ("CD")
Loans/Investments
3
UTAA $266 $273 $284 $289
$304 $311 $324 $331
2023
2024
2025
2026
740 hours
2
760 hours
1 At least 50% of the CD Hours per year must be in the UTAA, with the other 50% benefitting either the UTAA or the BSRA.
2 Any CD Service Hours in excess of the designated Annual Interim Goal in one calendar year may be applied toward the next calendar year's Annual Interim Goal.
$894
1
"CRA-Qualifying Loans" include the following loans either originated or purchased by Ally Bank or its affiliates: (a) CD Loans; (b) Mortgages to
LMI Borrowers; and (c) Auto Loans, as defined in Footnote 4.
2
"New Originations" for a calendar year will include new CD Investments, new CRA-Qualifying Loans either originated or purchased by Ally Bank,
and existing CD Loans that are renewed and credit underwritten that year (can only count each loan once per year).
3
Any amount in excess of the designated Annual Interim Goal in one calendar year for a certain asset category may be applied toward the next
calendar year's Annual Interim Goal for that same asset category.
4
"Auto Loans" include: (a) loans to LMI consumers for the purchase of a vehicle; and (b) closed-end loans of $1,000,000 or less to businesses
located in LMI census tracts for the purchase of a vehicle, 90% of which must be $100,000 or under.
Ally Bank CRA Strategic Plan 2023-2026 Goals for "High Satisfactory
"
I. Combined Goal for CRA-Qualifying Loans
1
& CD Investments for "High Satisfacatory"
Four-Year Plan Goal for 2023-2026 for "Outstanding": $4.7 billion in New
2
Originations
Annual Interim Goals for
"Outstanding":
$1.125 billion
$1.150 billion
$1.200 billion
$1.225 billion
Breakdown of Annual Interim Goal Amounts for "High Satisfactory": New
2
Originations for CRA-Qualifying Loans
1
Total Combined CRA-Qualifying Loans & Investments:
UTAA Goal Subtotals:
CD Loans, Mortgage Loans to LMI
Borrowers or CD Investments
5
UTAA or BSRA
6,7
$821
3
$839
3
$876
3
If Ally Bank achieves the UTAA goals for a calendar year, then Ally Bank will also receive credit for amounts deployed in that same calendar year as
either (a) CD Loans, LMI Mortgage Loans, or CD Investments that will benefit (b) either the UTAA or the BSRA (CD activities in the BSRA do not have
to benefit the UTAA).
6
For CD Loans, Investments or Services, the BSRA includes Arizona, California, Colorado, Idaho, Montana, Nevada, New Mexico, Oregon, Utah,
Washington, and Wyoming.
7
Per applicable regulations, LMI Mortgage Loans are not subject to the BSRA geographic restrictions on CD Loans/Investments/Services;
accordingly, if the UTAA Goal for Mortgage Loans to LMI Borrowers is met, Mortgage Loans to LMI Borrowers anywhere in the United States will
8
"UTAA" includes the following eight counties in Utah: Davis, Morgan, Salt Lake, Summit, Tooele, Utah, Wasatch and Weber.
II. Goal for Community Development Service Hours for "High Satisfactory"
Four-Year Plan Goal for 2023-2026: 2,900 Hours
1
Annual Interim Goals for
"Outstanding":
690 hours
2
710 hours
2

26
2. Measurable goals for “Low Satisfactory”: Table 10 below sets forth Ally Bank’s measurable goal
amounts for “Low Satisfactory” (subject to the definitions and framework discussed in Sections VI.A.
and VI.B. above):
Table 10: Ally Bank CRA Strategic Plan Goals for “Low Satisfactory”
2023
2024
2025
2026
$millions
Category Geography
Plan Year 1
(2023)
Plan Year 2
(2024)
Plan Year 3
(2025)
Plan Year 4
(2026)
$975
3
$1,000
3
$1,050
3
$1,075
Utah Assessment Area
("UTAA")
8
Sub-Goals
1. Auto Loans
3,4
UTAA $17 $18 $19 $19
2. Mortgage Loans to LMI Borrowers
3
UTAA $16 $16 $17 $17
3. Community Development ("CD")
Loans/Investments
3
UTAA $230 $236 $248 $254
$263 $270 $284 $290
2023
2024
2025
2026
2 Any CD Service Hours in excess of the designated Annual Interim Goal in one calendar year may be applied toward the next calendar year's Annual Interim
Goal.
Ally Bank CRA Strategic Plan 2023-2026 Goals for "Low Satisfactory"
I. Combined Goal for CRA-Qualifying Loans
1
& CD Investments for "Low Satisfacatory"
Four-Year Plan Goal for 2023-2026 for "Outstanding": $4.7 billion in New
2
Originations
Annual Interim Goals for
"Outstanding":
590 hours
2
610 hours
2
640 hours
2
660 hours
1 At least 50% of the CD Hours per year must be in the UTAA, with the other 50% benefitting either the UTAA or the BSRA.
5
If Ally Bank achieves the UTAA goals for a calendar year, then Ally Bank will also receive credit for amounts deployed in that same calendar year
as either (a) CD Loans, LMI Mortgage Loans, or CD Investments that will benefit (b) either the UTAA or the BSRA (CD activities in the BSRA do
not have to benefit the UTAA).
6
For CD Loans, Investments or Services, the BSRA includes Arizona, California, Colorado, Idaho, Montana, Nevada, New Mexico, Oregon,
Utah, Washington, and Wyoming.
7
Per applicable regulations, LMI Mortgage Loans are not subject to the BSRA geographic restrictions on CD Loans/Investments/Services;
accordingly, if the UTAA Goal for Mortgage Loans to LMI Borrowers is met, Mortgage Loans to LMI Borrowers anywhere in the United States will
count towards the total goal amounts.
8
"UTAA" includes the following eight counties in Utah: Davis, Morgan, Salt Lake, Summit, Tooele, Utah, Wasatch and Weber.
II. Goal for Community Development Service Hours for "Low Satisfactory"
Four-Year Plan Goal for 2023-2026: 2,500 Hours
1
$766
3
$785
1
"CRA-Qualifying Loans" include the following loans either originated or purchased by Ally Bank or its affiliates: (a) CD Loans; (b) Mortgages to
LMI Borrowers; and (c) Auto Loans, as defined in Footnote 4.
2
"New Originations" for a calendar year will include new CD Investments, new CRA-Qualifying Loans either originated or purchased by Ally
Bank, and existing CD Loans that are renewed and credit underwritten that year (can only count each loan once per year).
3
Any amount in excess of the designated Annual Interim Goal in one calendar year for a certain asset category may be applied toward the next
calendar year's Annual Interim Goal for that same asset category.
4
"Auto Loans" include: (a) loans to LMI consumers for the purchase of a vehicle; and (b) closed-end loans of $1,000,000 or less to businesses
located in LMI census tracts for the purchase of a vehicle, 90% of which must be $100,000 or under.
Total Combined CRA-Qualifying Loans & Investments:
UTAA Goal Subtotals:
CD Loans, Mortgage Loans to LMI
Borrowers or CD Investments
5
UTAA or BSRA
6,7
$712
3
$730
3
Annual Interim Goals for
"Outstanding":
$975 million
$1.000 billion
$1.050 billion
$1.075 billion
Breakdown of Annual Interim Goal Amounts for "Low Satisfactory": New
2
Originations for CRA-Qualifying

27
E. Strategic Plan Ratings System and Alternate Evaluation Method
1. Strategic Plan Ratings System: Evaluation of the Bank’s performance under this Strategic Plan will be
based upon the Strategic Plan Ratings System set forth below in Table 11 (same as the one used in Ally Bank’s
2017-2019 and 2020-2022 Plans). This system is similar to the rating system used by federal regulators to
evaluate large banks, except that the Strategic Plan Rating System below was modified to increase the rating
thresholds by one point each to receive an “Outstanding” or a “Satisfactory” rating.
Table 11: Overall Ratings and Points
The four overall ratings draw from the five-tiered Component Ratings set forth in Table 12 below, with 24 points
being available each year. The Combined CRA-Qualifying Loans & CD Investments performance accounts for 75%
of the evaluation and CD Services accounts for 25%.
Table 12: Component Ratings
2. Alternate Evaluation Method: Ally Bank is committed, at the very minimum, to meeting this Strategic
Plan’s measurable goals for a “Satisfactory” rating. However, as provided for in 12 C.F.R. §228.27(f)(4), if the
Bank does not “meet substantially its plan goals for a satisfactory rating,” Ally Bank may elect to be evaluated
under the Lending, Investment and Service tests for large banks.
Rating Points
Outstanding 21+
Satisfactory 12-20
Needs to Improve 5-11
Substantial Noncompliance 0-4
Rating
Combined CRA-Qualifying
Loans & CD Investments
CD
Services
Outstanding 18 points 6 points
High Satisfactory 13 points 4 points
Low Satisfactory 9 points 3 points
Needs to Improve 4 points 1 point
Substantial Noncompliance 0 points 0 points

28
SECTION VII. REQUEST FOR APPROVAL AND CONTACT INFORMATION
A. Regulatory Criteria for Approval
Ally Bank respectfully submits that it has fulfilled all of the regulatory requirements for CRA strategic plans,
including those governing development of the plan, public participation in the plan, and the plan’s measurable
goals. As established herein, Ally Bank’s CRA performance context (12 C.F.R. §228.21(b)(1) – (7)) thoroughly
supports the Bank’s measurable goals. Ally Bank believes that Federal Reserve Board approval of the Bank’s
Strategic Plan and its measurable goals set forth in Section VI above are appropriate under applicable criteria for
evaluation of a strategic plan outlined in 12 C.F.R. §228.27(g)(3)(i) – (iii) as follows:
(3) Criteria for evaluating plan. The Board evaluates a plan’s measurable goals using the following criteria,
as appropriate:
(i) The extent and breadth of lending or lending-related activities, including, as appropriate, the
distribution of loans among different geographies, businesses and farms of different sizes,
and individuals of different income levels, the extent of community development lending,
and the use of innovative or flexible lending practices to address credit needs;
(ii) The amount and innovativeness, complexity, and responsiveness of the bank’s qualified
investments; and
(iii) The availability and effectiveness of the bank’s systems for delivering retail banking services
and the extent and innovativeness of the bank’s community development services.
The extent and breadth of Ally Bank’s combined lending and investment measurable goals meet these
requirements in a number of ways, including the 10% increase from the Bank’s measurable goals for
“Outstanding” in its 2020 – 2022 Plan. Ally Bank will continue to seek out and create new lending, investment
and service opportunities that will benefit the UTAA and the BSRA, in accordance with this Strategic Plan’s
measurable goals.
B. Request for Approval of Ally Bank CRA Strategic Plan 2023-2026
For the reasons set forth above, Ally Bank respectfully requests Federal Reserve Board approval of this CRA
Strategic Plan 2023-2026.
C. Contact Information
Questions regarding this Strategic Plan may be directed to the following:
Jan M. Bergeson
Executive Director & CRA Officer
Ally Bank
200 West Civic Center Drive, Suite 201
Sandy, UT 84070
Phone: (801) 790-5048
Email: [email protected]m

29
APPENDICES
Appendix 1: Ally Bank Product, Deposit, Awards, and Financial Information
Appendix 2: Map of Utah Assessment Area and Census Tracts
Appendix 3: Additional Demographic Information
Appendix 4: Additional Needs Assessment Information
Appendix 5: Map of Broader Statewide or Regional Area
Appendix 6: Proof of Publication of Request for Public Comment
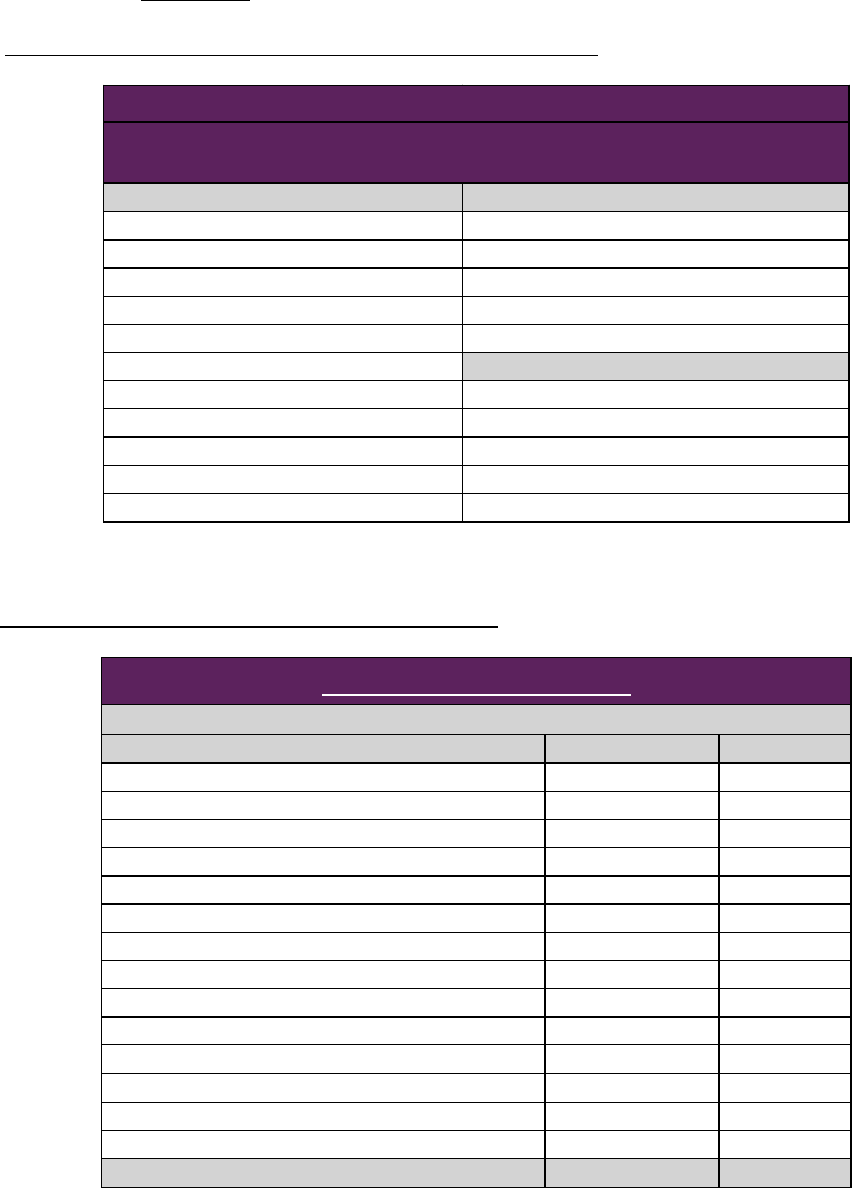
30
Appendix 1: Ally Bank Product, Deposit and Financial Information
A.1 Ally Bank Deposit and Loan Product Offerings (as of March 30, 2022)
A.2 Ally Bank Loan and Lease Portfolio (as of March 31, 2022)
Ally Bank Product Offerings
As of March 30, 2022
Deposit Products Lending Products
Consumer Consumer
Interest Checking Indirect Automotive Financing
Savings Account Mortgage Financing
Money Market Savings Consumer Credit Card
Certificates of Deposit Pont-of-sale Consumer Loans
Individual Retirement Accounts
Commercial
Wholesale Floorplan Loans
Real Estate Loans
Working Capital Loans
Equipment Loans
Community Development Loans
Ally Bank - Loans and Leases
As of March 31, 2022
Product Type $000s % of Total
Loans secured by real estate
Construction $213,000 0.17%
1-4 Family Open-end $228,000 0.18%
1-4 Family Closed-end First Liens $18,534,000 14.78%
1-4 Family Closed-end Junior Liens $45,000 0.04%
Commercial Real Estate $4,833,000 3.85%
Commercial & Industrial $26,519,000 21.14%
Loans to individuals for personal expenditures
Credit Cards $1,036,000 0.83%
Automobile $69,634,000 55.52%
Other Consumer $1,208,000 0.96%
Obligations of states and political subdivisions $179,000 0.14%
Loans to nondepository financial institutions $2,610,000 2.08%
Lease financing receivables $382,000 0.30%
Total $125,421,000 100.00%
Source: Ally Bank's 03/31/2022 Call Report

31
A.3 Ally Bank Deposits: Ally Bank has established a strong and growing online retail deposit business that has
differentiated itself in the financial services industry with consumer-focused best practices such as products
with no hidden fees, rules or penalties; no overdraft fees; straightforward and clear disclosures; and an ATM
fee reimbursement feature. The following is a summary of Ally Bank’s deposits as of March 31, 2022:
Ally Bank also had approximately $4 billion of brokered deposits and $2.6 billion of intercompany deposits as
of March 31, 2022.
B. Ally Bank Awards: Ally Bank is frequently recognized as the “Best Online Bank” by industry and consumer
publications for providing customers a strong value proposition (competitive rates and fees), best-in-class
digital experiences, and exceptional service. Example awards include:
C.1. Ally Bank Consolidated Reports of Condition and Income – March 31, 2022: Ally Bank’s Consolidated
Reports of Condition and Income as of March 31, 2022 may be accessed at the following link (after accessing
the link, in the Search function select “Call Report” and “3/31/22” and then type Institution Name “Ally
Bank”): https://cdr.ffiec.gov/public/ManageFacsimiles.aspx
C.2. Projected Financials: A summary of Ally’s projected financials is set forth in Confidential Exhibit A to this
Strategic Plan.
Total Deposit Mix
As of March 31, 2022
Product Group Balances ($M) % of Total % of Retail
Retail CDs $31,052 21.42% 22.46%
Online Savings Accounts $88,884 61.32% 64.29%
Money Market Accounts $6,711 4.63% 4.85%
Checking Accounts $4,689 3.23% 3.39%
IRAs $4,514 3.11% 3.27%
Other Retail Deposits $2,400 1.66% 1.74%
Retail Deposits $138,250 95.38% 100.00%
Brokered Deposits $4,049 2.79%
Interco Deposits $2,653 1.83%
Total Deposits $144,952 100.00%

32
Appendix 2: Map of Utah Assessment Area and Census Tracts
A. Map of Ally Bank’s Utah Assessment Area: Davis, Morgan, Salt Lake, Summit, Tooele, Utah, Wasatch and
Weber Counties
B. UTAA Census Tracts by County
1251.02 1251.03 1251.04 1252.01 1253.01 1253.04 1253.05 1253.06 1253.07 1254.07
1254.08 1254.09 1254.10 1254.11 1254.12 1254.13 1254.14 1254.15 1255.01 1255.02
1255.03 1256.00 1257.01 1257.02 1258.01 1258.04 1258.05 1258.07 1258.09 1258.10
1259.05 1259.06 1259.07 1259.08 1260.01 1260.02 1261.01 1261.05 1261.06 1261.07
1261.08 1262.03 1262.04 1262.05 1262.06 1263.03 1263.04 1263.05 1263.06 1264.02
1264.04 1264.05 1264.06 1265.00 1266.00 1267.00 1268.01 1268.02 1269.01 1269.02
1270.02 1270.03 1270.05 1270.06 1271.00 9800.00
Davis County Census Tracts
9701.01 9701.02 9702.00 9999.99
Morgan County Census Tracts

33
Appendix 2: Map of Utah Assessment Area and Census Tracts (cont.)
1001.00 1002.00 1003.06 1003.07 1003.08 1005.00 1006.00 1007.00 1008.00 1010.00
1011.01 1011.02 1012.00 1014.01 1014.02 1015.00 1016.00 1017.00 1018.00 1019.00
1020.00 1021.00 1023.00 1025.01 1025.02 1026.00 1027.01 1027.02 1028.01 1028.02
1029.00 1030.00 1031.00 1032.00 1033.00 1034.00 1035.00 1036.00 1037.00 1038.00
1039.00 1040.00 1041.00 1042.00 1043.00 1044.00 1047.00 1048.00 1049.00 1101.03
1101.04 1101.05 1101.06 1102.00 1103.00 1104.01 1104.02 1105.00 1106.00 1107.01
1107.02 1108.00 1109.00 1110.01 1110.02 1111.04 1111.05 1111.06 1111.07 1111.08
1111.09 1112.01 1112.02 1113.02 1113.04 1113.05 1113.06 1114.00 1115.00 1116.01
1116.02 1117.01 1117.02 1118.01 1118.02 1119.03 1119.04 1119.05 1119.06 1120.01
1120.02 1121.01 1121.02 1122.01 1122.02 1123.01 1123.02 1124.02 1124.04 1124.05
1124.06 1125.01 1125.03 1125.04 1125.05 1126.04 1126.08 1126.09 1126.10 1126.11
1126.12 1126.13 1126.14 1126.15 1126.16 1126.17 1126.18 1126.19 1126.20 1126.21
1127.00 1128.04 1128.05 1128.12 1128.13 1128.14 1128.15 1128.16 1128.18 1128.21
1128.22 1128.23 1128.24 1128.25 1128.26 1128.27 1128.28 1128.29 1128.30 1128.31
1129.04 1129.05 1129.07 1129.12 1129.13 1129.14 1129.16 1129.17 1129.18 1129.20
1129.21 1130.07 1130.08 1130.10 1130.11 1130.12 1130.13 1130.14 1130.16 1130.17
1130.21 1130.22 1130.23 1130.24 1130.25 1131.01 1131.02 1131.05 1131.08 1131.09
1131.10 1131.11 1131.12 1131.13 1131.14 1133.07 1133.08 1133.09 1133.10 1133.11
1133.12 1133.13 1133.14 1134.06 1134.08 1134.09 1134.10 1134.11 1134.12 1134.13
1134.14 1134.15 1135.05 1135.09 1135.10 1135.11 1135.12 1135.13 1135.14 1135.15
1135.20 1135.21 1135.22 1135.23 1135.26 1135.27 1135.28 1135.32 1135.33 1135.36
1135.37 1135.38 1135.39 1135.40 1135.41 1135.42 1135.43 1135.44 1135.45 1136.00
1137.01 1137.02 1138.01 1138.02 1138.04 1138.05 1139.03 1139.04 1139.05 1139.06
1139.08 1139.09 1140.00 1141.00 1142.00 1143.01 1143.02 1143.03 1143.04 1145.00
1146.01 1146.02 1147.00 1148.00 1151.07 1151.08 1151.09 1152.10 1152.11 9800.00
9801.00
Salt Lake County Census Tracts
9641.01 9641.03 9641.04 9642.01 9642.02 9642.03 9643.03 9643.04 9643.05 9643.06
9643.07 9643.08 9644.01 9644.02
Summit County Census Tracts
1306.00 1307.01 1307.04 1307.05 1307.06 1307.07 1307.08 1308.00 1309.00 1310.01
1310.03 1310.04 1310.05 1311.01 1311.02 1312.00 9800.00
Tooele County Census Tracts

34
Appendix 2: Map of Utah Assessment Area and Census Tracts (cont.)
0001.02 0001.03 0001.04 0001.05 0002.03 0002.05 0002.06 0002.07 0002.08 0004.00
0005.04 0005.05 0005.06 0005.07 0005.08 0005.10 0005.11 0006.01 0006.03 0006.04
0007.03 0007.06 0007.07 0007.08 0007.09 0007.10 0007.11 0008.01 0008.03 0008.04
0009.01 0009.03 0009.04 0010.01 0010.02 0011.03 0011.05 0011.06 0011.07 0011.08
0012.01 0012.02 0013.00 0014.01 0014.03 0014.04 0015.01 0015.03 0015.04 0016.01
0016.02 0017.01 0017.02 0018.01 0018.02 0018.03 0019.00 0020.01 0020.02 0021.01
0021.02 0022.04 0022.05 0022.06 0022.08 0022.09 0022.10 0022.11 0022.12 0022.13
0023.00 0024.00 0025.00 0027.02 0027.03 0029.01 0029.02 0030.01 0030.02 0031.03
0031.04 0031.05 0031.06 0032.01 0032.03 0032.04 0032.05 0033.01 0033.02 0034.01
0034.03 0034.04 0034.05 0101.07 0101.10 0101.14 0101.15 0101.16 0101.17 0101.18
0101.19 0101.20 0101.21 0101.22 0101.23 0101.24 0101.25 0101.26 0101.27 0101.28
0101.29 0101.30 0101.31 0101.32 0102.08 0102.09 0102.10 0102.11 0102.12 0102.13
0102.16 0102.17 0102.19 0102.20 0102.21 0102.22 0102.23 0102.24 0102.25 0102.26
0103.03 0103.05 0103.06 0103.07 0103.08 0104.04 0104.05 0104.06 0104.07 0104.08
0104.09 0104.10 0104.11 0105.03 0105.04 0105.05 0105.06 0106.00 0107.00 0109.00
9801.00 9802.00 9803.00 9804.00 9805.00 9806.00
Utah County Census Tracts
9405.01 9601.00 9602.01 9602.02 9602.03 9602.04 9604.01 9604.02 9605.00 9801.00
Wasatch County Census Tracts
2001.00 2002.02 2002.03 2002.04 2003.01 2003.02 2004.00 2005.00 2006.00 2007.00
2008.00 2009.00 2011.00 2012.00 2013.01 2013.02 2014.00 2015.00 2016.00 2017.00
2018.00 2019.00 2020.00 2101.01 2101.02 2102.01 2102.03 2102.04 2103.03 2103.04
2103.05 2103.06 2104.04 2104.05 2104.06 2104.07 2104.08 2105.08 2105.09 2105.10
2105.11 2105.12 2105.13 2105.14 2105.15 2105.16 2105.17 2105.18 2106.00 2107.01
2107.03 2107.04 2108.00 2109.00 2110.00 2111.00 2112.01 2112.02
Weber County Census Tracts

35
Appendix 3: Additional Demographic Information
A. 2022 Economic Report to the Governor: https://gardner.utah.edu/wp-content/uploads/ERG2022-
Full.pdf?x71849
B. Kem C. Gardner Policy Institute’s Research Brief, Salt Lake County’s Historic Apartment Boom: Past,
Present and Future, March 2022: https://gardner.utah.edu/wp-content/uploads/AptMrkt-Zions-
Mar2022.pdf?x71849
C. Kem C. Gardner Policy Institute’s whitepaper, The State of the State’s Housing Market, October 2021:
https://gardner.utah.edu/wp-content/uploads/StateOfState-Oct2021.pdf?x71849
D. National Low Income Housing Coalition 2021 Utah Housing Profile: https://nlihc.org/housing-needs-by-
state/utah
E. Utah Department of Workforce Services Tenth Annual Report on Intergenerational Poverty 2021:
https://jobs.utah.gov/edo/intergenerational/igp21.pdf
F. Kem C. Gardner Policy Institute’s Data Book, Diversity in Utah,Race, Ethnicity and Sex, May 2021:
https://gardner.utah.edu/wp-content/uploads/DiversityDataBook-May2021.pdf?x71849.
G. Utah Department of Health Primary Care Needs Assessment 2021:
https://ruralhealth.health.utah.gov/wp-content/uploads/2021/12/2021-PCNA.pdf
H. KSL, Salt Lake City ranked 2nd best startup city in US by real estate data company (published 5 February
2022): https://www.ksl.com/article/50341173/salt-lake-city-ranked-2nd-best-startup-city-in-us-by-real-
estate-data-company
I. The Milken Institute, Report, Best Perforiming Cities 2022, Charting Economic Resilience and Opportunity:
https://milkeninstitute.org/sites/default/files/2022-03/Best-Performing%20Cities%20US%202022.pdf
J. Utah Business. All eyes on Utah: Healthcare innovation is Utah’s next great economy, (published 17 May
2022): https://www.utahbusiness.com/all-eyes-on-utah-healthcare-innovation-is-utahs-next-great-
economy/
K. Mountain West Capital Network, Utah's Breaks Financial Transaction Value Record for Second Year in a
Row, According to MountainWest Capital Network Report (published 18 May 2022):
https://www.prnewswire.com/news-releases/utahs-breaks-financial-transaction-value-record-for-
second-year-in-a-row-according-to-mountainwest-capital-network-report-301550658.html
L. Entrata Utah’s Rental Market by the Numbers, September 10, 2021:
https://info.entrata.com/newsletters/whitepaper/2021/Utah_by_the_Numbers.pdf
M. 2022 Economic Report to the Governor - Highlights (Summary pages set forth below, with full 200-page
document being available at the following link: https://gardner.utah.edu/wp-
content/uploads/ERG2022.pdf?x71849

36

37
Appendix 3: Additional Demographic Information (cont.)

38
Appendix 3: Additional Demographic Information (cont.)

39
Appendix 3: Additional Demographic Information (cont.)

40
Appendix 3: Additional Demographic Information (cont.)
N. Utah Commissioner of Financial Institutions Annual Report to the Governor (7/1/2020 – 6/30/2021)
https://dfi.utah.gov/wp-content/uploads/sites/29/2021/10/Annual.pdf

41
Appendix 4: Additional Needs Assessment Information
A. List of 2022 Needs Assessment Survey Participants:
B. Additional Needs Assessment References
1. Salt Lake Housing Forecast 2021, Salt Lake Board of Realtors, located at the following link:
https://slrealtors.com/wp-content/uploads/2021/01/2021-Housing-Forecast-Report.pdf
2. State of Utah Annual Report on Homelessness 2021, located at the following link:
https://jobs.utah.gov/homelessness/homelessnessreport.pdf
3. Utah Public Health Data Resource, Complete Health Indicator of Refugee Arrivals, located at the following:
https://ibis.health.utah.gov/ibisph-view/indicator/important_facts/RefArr.html
4. 2020 Results Report of the Promise Partnership Regional Council, located at the following link:
https://uw.org/wp-content/uploads/RMR-2020-21-SINGLES-VFF-LR.pdf
5. Voices for Utah Children, Smart Money: Covering Uninsured Kids Will Save Utah Millions Every Year,
September 2021, located at the following link: https://www.utahchildren.org/newsroom/speaking-of-
kids-blog/item/1139-smart-money-covering-uninsured-kids-saves-ut-millions
6. Salt Lake County Consortium Action Plan 2021-2022, located at the following link:
https://slco.org/globalassets/1-site-files/housing-community-development/files/public-notices/salt-lake-
county-fy21-draft-action-plan---executive-summary.pdf
AAA Fair Credit Foundation People Helping People
Alliance House Rocky Mountain Community Reinvestment Corporation
And Justice For All Rural Housing Development Corporation dba Self-Help Homes
Artspace Senior Charity Care Foundation
Bountiful Community Food Pantry Spy Hop
Boys and Girls Club of Greater Salt Lake St. Anne's Center/Lantern House
Community Action Services and Food Bank Suazo Business Center
Community Development Corporation of Utah Success in Education Foundation
Community Development Finance Alliance The Children's Center Utah
Community Nursing Services The Christian Center of Park City
Crossroads Urban Center The INN Between
Flourish Ventures The Other Side Academy
Friends for Sight The Road Home
Friends of Switchpoint The Sharing Place
Guadalupe School Treehouse Children's Museum
Habitat for Humanity of Summit and Wasatch Counties TURN Community Services
Holy Cross Ministries University Growth Fund
Housing Connect Utah Community Action
Impact Mental Health Utah Housing Coalition
International Rescue Committee Utah Partners for Health
Journey of Hope Utah Utah Shakespeare Festival
Junior Achievement of Utah Volunteers of America, Utah
Kickstart Wallace Stegner Academy
Maliheh Free Clinic Wasatch Community Gardens
Mountainlands Community Housing Trust Wasatch Homeless Health Care dba Fourth Street Clinic
Neighborhood House Women of the World
NeighborWorks Mountain Country Home Solutions YMCA of Northern Utah
Park City Tots
Ally Bank 2022 Needs Assessment Survey Participants

42
Appendix 5: Map of Ally Bank’s Broader Statewide or Regional Area
Ally Bank’s broader satewide or regional area includes the following states (shaded in dark yellow on the map
below): Arizona, California, Colorado, Idaho, Montana, Nevada, New Mexico, Oregon, Utah, Washington and
Wyoming.

43
Appendix 6: Proof of Publication of Request for Public Comment
Ally Bank solicited formal public comment on this CRA Strategic Plan by publishing notice in at least one
newspaper of general circulation in the Bank’s UTAA, as required by 12 C.F.R. §228.27(d)(2). This notice was
published on August 7, 2022, with the public comment period expiring 30 days later. The notice was published in
the Salt Lake Tribune and Deseret News, which are both newspapers of general circulation in the Bank’s
assessment area (see proof of publication below).
