
The Art of Testing Less without Sacrificing Quality
Kim Herzig
i
Michaela Greiler
ii
Jacek Czerwonka
ii
Brendan Murphy
i
i
Microsoft Research, United Kingdom
ii
Microsoft Corporation, Redmond, United States
Abstract—Testing is a key element of software development
processes for the management and assessment of product quality.
In most development environments, the software engineers are
responsible for ensuring the functional correctness of code.
However, for large complex software products, there is an
additional need to check that changes do not negatively impact
other parts of the software and they comply with system
constraints such as backward compatibility, performance, security
etc. Ensuring these system constraints may require complex
verification infrastructure and test procedures. Although such
tests are time consuming and expensive and rarely find defects
they act as an insurance process to ensure the software is
compliant. However, long lasting tests increasingly conflict with
strategic aims to shorten release cycles. To decrease production
costs and to improve development agility, we created a generic test
selection strategy called THEO that accelerates test processes
without sacrificing product quality. THEO is based on a cost
model, which dynamically skips tests when the expected cost of
running the test exceeds the expected cost of removing it. We
replayed past development periods of three major Microsoft
products resulting in a reduction of 50% of test executions, saving
millions of dollars per year, while maintaining product quality.
Index Terms—measurement, cost estimation, test improvement.
I. INTRODUCTION
Software testing is a key element of software development
processes. The purpose of testing is to ensure that code changes
applied to a software product do not compromise product
quality. Often, testing is associated with checking for functional
correctness. However, for large complex software systems, it is
also important to verify system constraints such as backward
compatibility, performance, security etc. Complex systems like
Microsoft Windows and Office are developed by thousands of
engineers that simultaneously apply code changes, which may
interfere with each other. In such environments, testing may be
seen as an insurance process verifying that the software product
complies with all necessary system constraints at all times. By
nature, system and compliance tests are complex and time-
consuming although they rarely find a defect. Large complex
software products tend to run on millions of configuration in the
field and emulating these configurations requires multiple test
infrastructures and procedures that are expensive to run in terms
of cost and time. Making tests faster is desirable but usually
requires enormous development efforts. Simply removing tests
increases the risk of expensive bugs being shipped as part of the
1
Theo stands for: Test Effectiveness Optimization using Historic data.
final product. This is a generic issue for developing large
complex software systems [1]. At the same time, long running
test processes increasingly conflict with the need to deliver
software products in shorter periods of time while maintaining
or increasing product quality and reliability. Increasing
productivity through running less tests is desirable but threatens
product quality, as code defects may remain undetected.
The goal of this work is to develop a cost based test selection
strategy (called THEO
1
) to improve development processes.
THEO is a dynamic, self-adaptive test selection strategy, which
does not sacrifice product quality. THEO automatically skips
test executions when the expected cost of running a test exceeds
the expected cost of not running it. We designed THEO to ensure
that all tests will execute on all code changes at least once before
shipping the software product. Executing all tests at least once
ensures that we eventually find all code defects. Thus, THEO
does not sacrifice product quality but may delay defect detection
to later development phases. THEO and its underlying cost
model are based on historic test measurements to estimate future
test execution costs and causes no test runtime overhead.
Additional dynamic or static test analysis data, such as coverage
or dependency graphs are not required.
We evaluated the effects of THEO by simulating historic
development processes for three major Microsoft products:
Windows, Office, and Dynamics. Combined, our simulation
results cover more than 26 month of industrial product
development and more than 37 million test executions.
We make the following contributions in this paper:
We develop a cost model for test executions based on
historic test execution results that causes no test
execution runtime overhead, and is capable of
readjusting its cost estimations based on execution
contexts (e.g., configurations of the test environment).
We develop THEO, a self-adapting test selection
strategy to accelerate test processes without sacrificing
code quality.
We evaluate THEO by simulating its impact on historic
Windows, Office, and Dynamics developments.
We briefly discuss expected secondary improvements
such as developer satisfaction.
In Section II, we provide background information about
development and verification processes to explain the context of
this work, motivation and methodology are described in

Section III. We define the historic data feeds in Section IV.
Based on this input, we derive failure probability functions
(Section V) used in our cost model (Section VI). Section VII
contains a description on simulating THEO on past development
processes. Sections VIII and IX discuss simulation
measurements and results. Secondary improvements are briefly
discussed in Section X. We close the paper with threats to
validity (Section XI), related work (Section XII) and a
conclusion (Section XIII).
II. DEVELOPMENT AND VERIFICATION PROCESSES
In this section, we provide a brief overview of the complex
subject of software development methodologies. The process for
developing large software products is predominantly through
developing a single component across multiple code branches
(e.g. Microsoft Windows) or through developing independent
components (e.g. Microsoft Office) which form the product.
When developing code across multiple code branches, a code
branch is a forked version of the code base that allows parallel
modifications without interference (for more details we refer to
Bird and Zimmermann [2] and Murphy et al. [3]). The
alternative is to design the product into multiple independent
components. Each component can be developed independently
on a single code branch [4].
Independent from the development methodology,
development teams are often responsible for verifying functional
correctness of any code change. Where system constraints exist
on the product, additional test infrastructure is required to ensure
all code meets those constraints. Since product constraints are
system properties, they often need to be verified at system level.
The complexity of the verification requirements is dependent
upon system size and the number of system constraints. For
example, Windows uses multiple development branches that
integrate into a single trunk branch (see Fig. 1. ). Developer
commit their code changes to development branches (Branch B1
in Fig. 1. ) and integrate these code changes through multiple
integration branches (B2 and B3 in Fig. 1. ) into the trunk branch,
which contains the current stable version of the next Windows
release. Each integration path between any two branches is
guarded by so-called quality gates checking for various
constraints, e.g. backward compatibility requirements, both in
terms of the hardware it runs on and in terms of supported
applications. To verify that Windows meets these constraints
requires the emulation of millions of different execution setups
at each branch level. The lower the level of branches a quality
gate fails, the higher the number of affected engineers and the
more expensive a defect becomes.
At the same time, any complex test infrastructure evolves
over time. New test are added, older tests might get less
important or even deprecated. Maintaining tests and preventing
test infrastructures from decay can be an enormous effort. For
older products, there may be a lack of ownership for some of the
older tests. These tests can affect development speed as the more
tests are executed and the longer the runtime of tests, the longer
the verification process and the slower the development speed,
e.g. the time required to integrate code changes into the trunk
branch. Additionally, verification time depends on the number
of test failures. Most test failures require human effort to inspect
and to fix the underlying issue. Note that test failures may be due
to code defects or due to test reliability issues and that running
and analyzing these failures is a time consuming task, especially
at system and integration level. System tests can run for minutes
or hours as they often require entire systems to be set-up and
tore-down. At the same time, developing large complex software
systems usually implies large development teams developing
code changes in parallel that need to be tested also in parallel.
Consequently, increasing the effectiveness and efficiency of
test processes has an immediate effect on product development.
Running less tests might help to improve test performance.
However, reducing testing imposes the risk of elapsing defects
to later development stages and unnecessary involving or
affecting more developers.
III. MOTIVATION & METHODOLOGY
The goal of this work is to decrease development costs and
to increase productivity without sacrificing product quality. As
we discussed in Section II, achieving this goal requires a careful
balance between conservative test strategies to minimize the
number of defects elapsing into later development stages, and
reducing test time to allow faster integration processes and
higher productivity. Any test optimization strategies should not
compromise the quality of the code shipped to customers. It may
be acceptable to find defects later than possible, but it remains
unacceptable to weaken overall product quality. Our
optimization strategy ensures that all test scenarios are executed
at least once for each code change before integrating the code
change into the main product code base, e.g. the trunk branch.
From the example shown in Fig. 1. , it is acceptable to skip a test
scenario on branch B2 if and only if the very same test scenario
will be executed on branch B3 for the very same code change.
The basic assumption behind this work and most other test
optimization and test selection approaches is that for given
T2
Branch B1
Branch B2
Branch B3
time
trunk
T1
T6
T4
T5
T3
Fig. 1. Integration path example. The integration path of change C applied
to branch B1 lists the branches B1, B2, B3, and trunk including the
timestamps of the corresponding successful merge operations.

scenarios, not all tests are equally well suited. Some tests are
more effective than others are. However, deciding the
effectiveness of tests and when to execute them is not trivial.
The approach presented in this paper uses historic test
execution data and development process cost factors to perform
test selection. Each test execution is considered an investment
and the expected test result considered as return of investment.
Using a cost model, our goal is to create a dynamic, self-adaptive
test selection strategy, which readjusts its cost estimations based
on test execution context. To provide an actionable solution that
fits into the Microsoft development processes, we considered
only solutions that cause no runtime overhead and that required
no additional data collection. THEO only uses historic test data
collected by standard testing frameworks and excludes code
coverage data as collecting code coverage can increase the
runtime overhead. Later, we will show that THEO ensures all
tests are executed at least once for each code change. Therefore,
it does not affect the overall code coverage of the test process.
IV. HISTORIC TEST PERFORMANCE DATA FEEDS
The process collects the results of prior test executions; this
data is already collected by most test execution frameworks. The
individual data sources we use to select test cases are depict in
TABLE I. . The main data collection categories are:
A. General Test Execution Information
The name of the executed test (TestName) and the unique
identifier of the test execution instance (TestExecID) are
collected. This data allows us to bind and group test execution
results to the according test case.
B. Test Runtime
We use the time taken for the test to run, i.e. the test
execution time (TestExecDuration) for each test execution as
recorded by the test framework.
C. Test Results
Further, we collect the results of all tests being run within the
development process. A test failure is where the expected result
of a test could not be produced (i.e., assertion failed), or the
whole test execution terminated with an error. Usually, we
assume that a failing test indicates a code defect, caused by
introducing a defect (e.g. through side effects) when merging
multiple parallel-developed code changes. However, it might
also be that the test case reporting the test failure is not reliable.
We call test failures due to test reliability issues false alarms.
Categorizing the test result as passing or failing is implicitly
given by the testing framework. However, it is also important to
further distinguish test failures into code defects and false
alarms. To do so, we need additional information. Using links
between test failures and bug reports, we can distinguish test
failures due to code defects from false alarms [5]. If the failure
led to a bug report that was later fixed by applying a code change
we mark it as a code defect. Otherwise, the failed test execution
is marked as a false alarm. To identify their cause, test failures
always need to be manually inspected to either fix the problem
or identify the test failure as false alarm. Due to resource
restrictions, not all test failures can be investigated. Therefore,
test failures that were not manually investigated are marked as
undecided and ignored, as their cause is indeterminable.
D. Execution Context
Modern software systems tend to be multi-platform
applications running on different processor architectures, e.g.
x64 and arm, different machines, and different configurations.
We define an execution context as a set of properties used to
distinguish between different test environments. In this paper,
we use the execution context properties BuildType, Architecture,
Language, Branch (see TABLE I. for detailed description).
However, the concept of execution contexts is variable. Adding
or removing properties will influence the number of different
execution contexts but requires no modification of the general
approach. This is a crucial point as a test may show different
execution behaviors for different execution contexts. For
example, a test might find more issues on code of one branch
than another depending on the type of changes performed on that
branch. For example, tests cases testing core functionality might
find more defects on a branch containing kernel changes than on
a branch managing media changes. Thus, our approach will not
only differentiate between test cases, but also bind historic defect
detection capabilities of a test to its execution context.
V. TEST FAILURE PROBABILITIES
Given a planned test execution and given the corresponding
execution context, we can use past test executions of the same
test in the same execution context and derive the number of
reported defects and the number of false test alarm that the test
reported. From these past observations, we can derive two
failure probabilities:
as the probability that the combination
of test and execution context will detect a defect (true positive)
and
as the probability that the combination of test and
execution context will report a false alarm (false positive). These
probabilities are defined as:
TABLE I. TEST EXECUTION DATA USED FOR TEST SELECTION.
Data point
Description
General test execution information
TestName
Unique name of test case executed.
TestExecID
Unique identifier of test case execution.
Test runtime information
TestExecDuration
Number of seconds the recorded test case execution
lasted.
Test result information
TestExecResult
The result of the test execution. Possible value:
passed, code defect, false alarm, undecided.
Requires interpretation as described in Section IV.C
Execution context information
BuildType
The build type of the binaries on which the test was
executed. Possible value: debug, release.
Architecture
Architecture information of the binaries under test.
Possible values: x86, x64, arm.
Language
Language information of the binaries under test, e.g.
en-us. Especially media and GUI tests depend on it.
Branch
Unique identifier of the source code branch on which
the test execution was performed.

where the tuple
is a combination of test and execution
context , where represents the number
of defects reported by when executed in c,
represents the number of times has been executed in , and
where represents the number of false test
alarms caused by when executed in . For example, consider a
test executed 100 times in an execution context , e.g. on build
type release, architecture x64, branch b, and language en-us,
which reported 4 false alarms and 7 defects, then
and
. Both probability measurements
consider the entire history from the beginning of monitoring
until the moment the test is about to be executed. Consequently,
probability measures get more stable and more reliable the more
historic information we gathered for the corresponding test.
Note that test failure probabilities enclose code coverage like
information. For tests not covering a changed code area and for
test covering the code area but not checking any execution
results, the defect detection probability
will be zero.
VI. COST MODELLING THEORY
The decision of when to execute or skip a test case in a given
execution context is solely based on cost. The idea is to estimate
the cost of executing or not executing a test in a given execution
context beforehand and to choose the less expensive option.
A cost model was developed to deliver the cost factors for
the test selection strategy, using the data feeds and test failure
probabilities discussed in Section IV. It is sensitive to the history
of a test case as it considers past test executions in the same
context to assess the expected cost values. For each scheduled
test execution, the cost model considers two different scenarios:
executing the scheduled test and not executing it. For both
scenarios and the given execution context, we estimate the
corresponding expected costs and decide for the scenario which
is expected to be less expensive. Thus, if the estimated cost of
not executing the test (
) is lower than the cost executing
it (
), THEO will skip the test execution—not selecting
the test to be executed.
For both execution scenarios, the contributing cost factors
must be considered. Executing a test raises both the
computational cost (Section VI.A) and the cost of inspecting the
test result (Section VI.B), if necessary. Executing tests that fail
without detecting a real code defect will trigger unnecessary
failure inspections performed by engineers. On the other hand,
not executing a test might lead to undetected defects that will
escape to later development stages and therefore impact more
engineers than necessary (Section IV.C)
In this paper, cost factors, which are described with positive
values, express the expected cost to be paid. We could also have
described cost saving values with negative amounts and cost
increasing values with positive amounts, but we explicitly
wanted to avoid any up-front judgment on these figures.
A. Base Cost of Test Executions
A major cost factor is the time-shared cost of infrastructure
necessary to execute a test on all required execution contexts.
2
Price for Azure A7 high memory VM as of Feb. 2014: $1.6 per hour
The constant
is a constant representing the per
minute infrastructure cost. Multiplied with the execution time
per test, we get the total infrastructure cost of running a test. For
the Microsoft development environment we computed
to have a value of 0.03 $/min. The cost factor
corresponds roughly to the cost of a memory intense Azure
Windows virtual machine
2
and includes power and hardware
consumption, as well as maintenance.
For example, consider we executed a test 100 times in a
given execution context and that each execution took 10
minutes. The total machine cost required to run the test in that
context accumulates to 100 * 10 * 0.03 $/min = $30.
B. Cost of Test Inspections
All test failures require human inspection effort, but
inspecting failing tests due to anything other than code defects is
unnecessary and should be avoided. The cost of a test inspection
equals the amount of time required to conduct the inspection
times the salary of the engineer conducting the inspection. The
cost constant
represents the average cost rate of test
failure inspections at Microsoft. It considers the size of the test
inspection teams, the number of inspections performed and the
average salary of engineers on the team. The average cost per
test inspection is $9.60. Although this cost may vary from case
to case, for simplicity reasons, we use the average cost of a test
inspection in our model. Note that this cost reflects only the time
spent by inspecting engineers. Additional cost factors such as
waiting time or the need to run extra tests is not included.
C. Cost of Escaped Defects
Code defects escaping a test run can be expensive. The
longer a defect remains hidden the more people can potentially
be affected and the more expensive the escaped defect become.
Defects closer to release dates tend to be more expensive [6] and
increased time from defect introduction to its detection increases
cost due to aggravated root cause analysis (more changes have
been applied since then). Understanding and fixing an older
change is more difficult. Additionally, the greater the number of
engineers affected by a defect, the more expensive disruptions
will be while fixing the defect. Defects usually imply some sort
of development freeze, e.g. no check-ins until issue resolved.
The constant
represents the average cost of an
escaped defect. This cost depends on the number of people that
will be affected by the escaped defect and the time duration the
defect remains undetected. We used a value of $4.20 per
developer and hour of delay for
. This value
represents the average cost of a bug elapsing within Microsoft.
Depending on the time the defect remains undetected and the
number of additional engineers affected, elapsing a defect from
a development branch into the main trunk branch in Windows
can cost tens of thousands of dollars.
We do not model defect severity explicitly. There are two
main reasons for this. First, the severity of a defect cannot be
determined prior to its occurrence—we would need to predict
defect severity, which will not be reliable or actionable. Second,
all defects breaking a system and integration test and causing
development activity to freeze on the corresponding branch must
be considered severe. Vice versa, system constraints and
properties whose violations are not considered severe will not be
tested during system and integration testing. Such defects are
caught by pre-check-in verification processes or dog-food and
manual testing procedures. For example, breaking look and feel
properties may not cause a development freeze. The impact of
the defect on the overall system is too low to cause a sever
disruption of the overall development process.
D. Final Cost Function
Finally, we combine the individual cost components into two
cost functions: the expected cost of executing a test (
)
and the expected cost for not executing a test (
).
represents the expected cost if we decide to execute
the test which depends on the machine cost (
), the
probability that the executed test will fail due to any other reason
as a defect (
), and the cost of conducting an unnecessary test
failure inspecting (
):
represents the expected cost of not executing the test
which depends on the cost of escaped defects (
) and
the number of additionally affected engineers ()
and the time the defect remains undetected (
):
The number of engineers () is a static property
of the engineering system and can be determined by
counting the number of engineers whose code changes
passed the current code branch. The
is the
average time span required to fix historic defects on the
corresponding code branch. Both properties are easy to
measure and reliable (we verified these values with the
corresponding product teams).
or tests that found no defects in the given execution context,
and
is zero and the test is skipped. The same test
for a different execution context (e.g. different branch) is likely
to have a different
value and thus might remain enabled.
Note, that we skip tests only if we know that the code change
will be tested by the same execution context later again, e.g. on
a lower branch level as shown in Fig. 1.
VII. IMPROVEMENT STRATEGY SIMULATION
Applying THEO to a live development environment without
a period of thorough evaluation is too risky as it can directly
impact product quality. The result presented are based on
simulations of THEO on past development periods. This section
discusses the process of simulating the execution of the tests and
also simulating the impact of any failures that would propagate
as tests are removed. Simulating the test selection process also
allows us to compare our results with actual test and code quality
behavior.
A. Simulating Test Case Executions
To simulate the behavior and impact of our test selection
strategy, we replayed test executions as they occurred in past
development periods. Tests executions and their test results
(failed or passed) are recorded in databases by the test execution
frameworks at Microsoft. Using these databases, we know the
test suite and test case executions, the execution contexts these
tests were executed, and the order in which these tests run. This
information is sufficient for the simulation. Our simulation
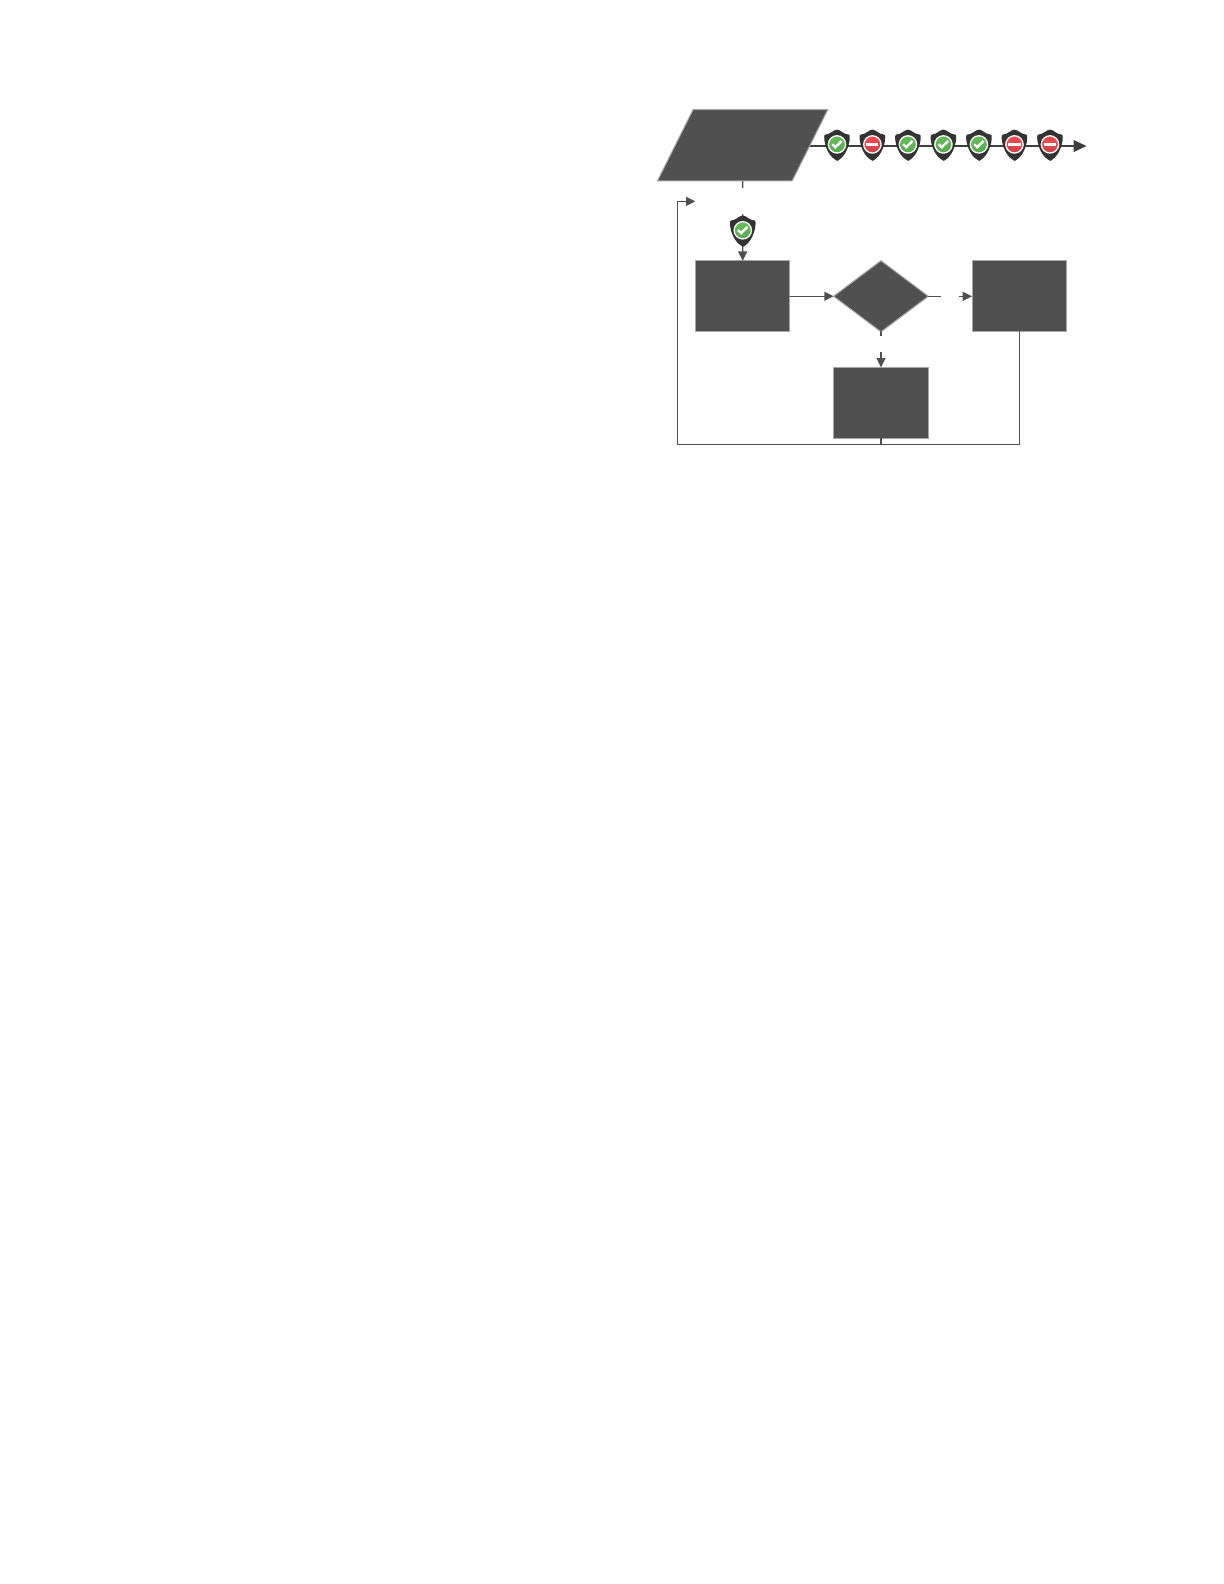
process follows the following basic steps, described in Fig. 2.
Step 1: Using the databases containing the test executions
and their corresponding test execution results (failed or
passed), we order these historic test executions by their
execution timestamp. Thus, our test optimization strategy is
fed with test executions in the order they were applied.
Step 2: Each historic test execution and the corresponding
test execution context definition is fed into a simulation
process running an implementation of our test selection
strategy. The test selection process then returns a binary
decision indicating whether the test case received as input is
selected to be executed by the test selection strategy.
Step 3: Depending on the binary result, the originally
executed test is marked as skipped or executed in a separate
simulation table. Skipped test executions represent those test
executions that would not be executed when using our test
selection strategy.
Our simulation process does not execute test cases. It only makes
decisions on whether a test case would have been executed,
depending on the cost balance tightly influence by its defect
finding capabilities. The result of this test case simulation is a
simple list of test case executions that would have been
prevented when using our test selection strategy. This list can be
used to compare against the original set of executed tests.
B. Simulating Defect Detection
Removing test executions may impact code quality. Defects
detected by test executions that have been removed by THEO
time
Test selection
Simulator
Execute?
Recorded,
historic
test executions
Mark execution
as skipped
Mark execution
as executed
NO
YES
Next()
Fig. 2. Flow chart illustrating the test execution simulation process. For each
test execution and execution context, ordered by time, we decide which
tests should be executed.

would remain undetected, at least for some time. Disabling test
executions is likely to have impact on code changes and
developer behavior, which cannot be simulated. Thus, we have
to estimate how undetected defects would propagate through the
development process and when they would be detected.
The heuristic estimating when and where escaped defects
would have been recaptures requires more data about the actual
project specific development process. This data is needed to gain
further insight in how code changes, and thus defects, propagate
through the development process. For this part of our simulator,
we collect the following, project specific datasets and make
some basic assumptions about code defects and test behavior.
Integration paths of code changes and defects
Assuming a base code branch, usually called trunk, the
integration path of a code change is a sequence of branches and
timestamps the corresponding code change was applied to
before the code change was merged into trunk. For projects
using a single development branch, e.g. Microsoft Office, the
integration path of a code change is a single entry identifying the
name of the single branch and the commit timestamp. For
projects using multiple code branches, e.g. Microsoft Windows,
the integration path usually contains multiple entries. For
example, consider the example shown in Fig. 1. The integration
path of change C lists the branches B1, B2, B3, and trunk
including the timestamps of the corresponding merge operation
that applied C to the code base in each branch.
For each change originally applied to the version control
system, we compute their corresponding integration paths
tracing code changes through the version control system [3]. For
more details on that procedure, we refer to Murphy et al. [3].
Basic defect and test behavior assumptions
We make the following two assumptions with respect to code
issues and test cases detecting these code issues:
1. A combination of test case and execution context
3
, that
detected and reported a defect at time
will also detect
and report the same defect at any time
if and only if
and if
is executed on an integration path of
the defect. This assumption disregards that (even though
unlikely) the code defect might have be suppressed but
not fixed by other code changes applied to the code base.
2. The code issue can be replicated by re-running the test
in the corresponding execution context.
We discussed these assumptions with various Microsoft
product teams who verified and confirmed their validity. Product
teams also confirmed that in few cases, code defects escape their
original branches and are re-captured on higher-level branches
or later on the same branch.
C. Assigning defects to simulated test executions
The integration path of code changes is assumed to
correspond to the propagation path of undetected defects, and
3
For defect propagation purposes, we ignore all branch specific execution
context information as long as the change containing the defect was
integrated into the branch.
can be used to estimate which test execution would have re-
captured an escaped defect. In the example shown in Fig. 1. a
defect in change C is caught by test T2 and the code does not
progress past branch B2. A bug fix is created and verified by
tests T4, T5 and T6. If THEO skips test T2 the defect is assumed
to be immediately merged into branch B3. THEO assumes the
defect is caught by test T6 as it runs the same tests as T2. In this
scenario the bug fix would be applied in branch B1 after running
test T6 and THEO would assume that the cost of fixing the defect
is now higher than its original cost.
While the original association between defect and test
execution is stored in the test execution framework database, our
simulator returns a modified version of the original associations
reflecting simulation results. For each test that is executed during
simulation, we assign all original code issues detected during test
execution. Additionally, we assign all escaped defects to the test
execution that would have been caught given the heuristics
above. As a result, the number of defects associated with a test
execution equals the number of defects during the actual
execution of the test, plus an additional set of escaped defects.
D. Executing all Test Cases At Least Once
The goal of this work is to optimize testing processes without
sacrificing product quality. This implies that we ensure that all
escaped defects are eventually caught, before releasing the
product to customers. To satisfy this condition, we ensure all
originally executed combinations of tests and execution contexts
for all code changes applied to the code base are executed at least
once. To ensure this happens we use two separate criteria,
depending on the development process:
Option 1: For single branch development processes, e.g.
Microsoft Office, we enforce each test to execute at least
every third day
4
. Since all code changes are applied to the
same branch, re-execution of each test for each execution
context periodically ensures that each code change has to go
through the same verification procedures as performed
originally.
Option 2: For multi-branch development processes, e.g.
Microsoft Windows, we enforce to execute a combination of
test and execution context on the branch closest to trunk on
which the test had been executed originally.
Thus, THEO can only skip test executions if the criteria
described above allow a test to be skipped. Otherwise, THEO’s
decision to skip a test in a given execution context will be
ignored by the simulator and the test will be executed.
E. Training Phase
As the underlying cost model depends on risk factors
extracted from historic data, these risk factors will be unknown
and unreliable in the early stages of the simulation process, in
which no historic data is known. To compensate, each test and
execution context combination has to go through a training
4
This value is the result of a complex analysis we conducted with the
Office product team and reflects the optimal solution for the system. Due
to confidential reasons, we cannot share the details of this process.

phase of 50 executions before the simulator will allow THEO to
disable the corresponding test in the given execution context.
VIII. SIMULATION EVALUATION
A. Test Execution Reduction
The first evaluation identifies the number of test executions
that were skipped during the simulation of the test selection
strategy. To retrieve this number, we count the number of
originally recorded test executions and subtract the number of
test executions that our test strategy would have executed during
simulation. We report the relative test reduction rate as the
number of skipped test execution divided by the total number of
originally executed test execution during development.
Considering the execution time of individual test executions, see
Section IV.B, we can translate the relative test reduction rate into
relative test execution time improvements—the total execution
time of all skipped test executions divided by the total test
execution time of all tests executed originally. We further show
reduction rates over time. The number of skipped test executions
and their summed execution duration determines how much
machine cost
has been saved.
B. Test Result Inspection
As discussed in Section VI.B, test failures require human
effort for inspection in order to decide what action to take.
Skipping test cases that would have caused unnecessary test
inspections (false alarms) is an improvement. Relating these
suppressed false alarms with the corresponding cost factor for
test failure inspections (
), identifies the relative
improvement with respect to test inspection time and the
associated development cost improvements.
C. Escaped Defects
While the reduction in test executions (Section VIII.A) and
the reduction in test inspections (Section VIII.B) relate to
productivity and cost improvements, the number of defects that
escaped due to skipped test executions reflects the negative
aspects of THEO and relates to development cost increases. We
report the number of escaped defects relative to the number of
all code defects reported by test executions. The simulator is
pessimistic assuming defects can only be found by the same test
cases that are ignored (comparing TestName and TestExecID),
in reality they may be caught earlier by other test cases.
D. Cost Improvement
Skipping tests may save development time. At the same time
it imposes risk of escaped defects temporarily compromising
code quality, and thus to increase development cost—finding
defects later in the development tends to be more expensive [6].
To validate if the estimated development cost improvements
predominate the estimated development cost increases, we
report the total cost balance as the balance of cost reductions.
We add the cost reductions due to reduced test time and du to
less test failure inspections and subtract the extra cost of escaped
bugs. A positive balance reflects cases in which the
improvements predominate. Negative balances refer to cases in
which our optimization strategy THEO does not payoff and
would have caused additional development costs rather than
lowering them.
E. Evaluation Subject
We evaluated the effects of THEO on three major Microsoft
products: Windows, Office, and Dynamics. Combined, our
simulation results cover 26 months of product development,
more than 37 million test executions. TABLE II. contains
information about the duration of simulated development
periods and the number of simulated test cases per project.
Results presented for Windows reflect the entire Windows 8.1
development period (~11 months). For Windows, we simulated
more than 30 million test executions. Simulation results for
Office cover development activities and test executions
covering three months—a total of more than 1.2 million test
executions. For Dynamics, we simulated a development period
of 12 months with more than 6.5 million test executions. While
Windows and Dynamics use multi-branch development setups,
Office uses a single collaboration branch. Thus, for simulations
for Windows and Dynamics, we enforce to execute a
combination of test and execution context on the branch closest
to trunk (Option 2 discussed in Section VII.D), while for Office
we simulate using the time based test execution policy (Option
1 discussed in Section VII.D).
IX. SIMULATION RESULTS
In this section, we present and discuss the results of our
simulation experiments as described in Section VII. We will
restrict the discussion in this section to measurable
improvements. Section X contains a discussion on secondary
improvements that cannot be measured directly.
Similar to the cost model the overall cost improvement
depends on the constant cost estimations as presented in Section
VIII. The results are summarized in TABLE III.
A. Test Execution and Test Time Reduction
THEO would have skipped 40.6% of all Windows test
executions across all branches. Considering the runtime of these
tests and relating it to the total runtime of all executed tests,
THEO would have saved 40.3% of the total test execution time.
This is a significant improvement. In simulation, submitting a
code change to a development branch in Windows could have
been integrated into trunk in only 60% of the original integration
time. Note that this measurement considers only test execution
time, but does not consider other development or human factors.
Thus, the test time improvement of 40% may not translate to a
40% increase in integration time, but it certainly lowers the
lower bound of integration time. Multiplying the test time
improvement with the cost factor for test execution
(
), we yield a cost improvement of over $1.6
million. Note that the test time cost improvement figures
TABLE II. EVALUATION SUBJECT DETAILS.
Windows
Office
Dynamics
Simulated
period
~11 months
~3 months
~12 months
#test
executions
> 30 million
> 1.2 million
> 6.5 million
# branches
> 1
1
> 1

consider only the time of not executing the skipped tests. It does
not include potential cost improvements due to skipping test
setups, test teardowns, removing entire dedicated test machines
from a branch, etc. Thus, the test time cost improvement must
be seen as a lower bound of the actual cost improvement.
The average test execution reduction rate for Dynamics is above
50%. This means that THEO would have prevented more than
half of the originally executed test executions and saved 47% of
test execution time. In theory, code could have been moved
nearly 50% faster into the trunk branch, a significant
improvement. Although the test execution and test time
reduction rate exceeds the values achieved for Windows, the test
machine cost improvements that correlated with the reduced test
time are two orders of magnitude lower than for Windows. This
is due to the fact, that tests executed for Dynamics terminate
much faster than Windows tests. Thus, the reduction rate is
translating into less computational time and thus is less lucrative.
The same is true for Office tests, which also execute much faster
and therefore the savings on reduction of test execution time are
lower than for Windows. The cost savings for Office are further
less significant as we only simulate a three-month period and test
executions on one branch. Nevertheless, THEO would have
skipped a significant number of 34.9% of all performed test
executions and saved 40.1% of the total test execution time
B. Test Result Inspection.
As discussed for the cost modelling theory (Section VI),
THEO specifically targets unnecessary test inspections caused
by test failures due to other reasons than code defects (false test
alarms). Suppressing such test failures implies reduction of
unnecessary test result inspections, which translates into cost
savings. Row “Test result inspection” of TABLE III. contains
the relative number of spared test inspections for all three
products. For Windows and Dynamics, the reduction rate lies
around 33%; one third of originally carried out test result
inspections were unnecessary. For Office, THEO would
suppress 21.1% of all false positives. Interestingly, the
associated cost improvements for Windows ($61k) and Office
($104k) are again two orders of magnitudes lower when
compared to Dynamics ($2.3M). The reason for the difference is
again the different absolute number of test failures suppressed.
C. Escaped Defects
While removed test executions and reduced test inspections
determines a positive cost savings, the number of temporarily
escaped defects increases development costs.
In our Windows simulation, 0.2% of all defects escaped at
least one test execution. As shown in TABLE IV. 71% of these
escaped defects escaped only one branch and were found in the
corresponding next merge branch. 21% of escaped Windows
defects escaped two branches and 8% escaped even 3 branches.
Importantly, none of the defects escaped into the trunk branch.
On Dynamics, THEO would have elapsed 13.4% of all defects,
a much higher escape rate as for Windows. The vast majority
(97%) of these escaped Dynamics defects were caught on the
direct consecutive merge branch. The remaining 3% escaped
two branch levels. For both Windows and Dynamics, the extra
cost caused by escaped bugs is significant. However, in both
cases, these new extra costs are orders of magnitudes lower than
the highest cost savings achieved by removed test executions
and inspections.
For Office, the results are a bit different. Whereby the
percentage of bugs that escaped is 8.7%, which is comparable to
Dynamics, the costs are $75k higher in relation to the cost
savings. This is due to an additional cost of manual testing work
that we added as a penalty for Office in case the bugs was not
found within 10 days. The rationale behind this lies in the way
the Office test and development is performed. Nevertheless,
approximately 40% of bugs escaped would have been found
already in the next scheduled build and test.
D. Cost Improvement.
Looking at the overall cost balance, we see cost savings for all
three evaluation subjects. For Windows, we estimate a total cost
saving of $1.6M, for Dynamics, a total cost saving of
approximate $2.0M and for Office a cost saving of approximate
$100k. These values may seem small considering the total
development budgets of projects of their scale. However, this
only identifies test savings. Considering the actual test execution
reduction rates of 35% to 50% puts these numbers into
perspective. The actual values are secondary, it is important that
the achieved productivity increase though faster integrations.
E. Variable Performance over Time
Fig. 3. shows the relative test execution reduction over time
(measured in development days) for Windows. The dark area
corresponds to originally executed tests that were removed
during simulation. As shown, THEO requires an initial training
TABLE III. SIMULATION RESULTS FOR MICROSOFT WINDOWS, OFFICE, AND DYNAMICS.
Windows
Office
Dynamics
Measurement
Rel. improvement
Cost
improvement
Rel. improvement
Cost
improvement
Rel. improvement
Cost
improvement
Test executions
40.58%
--
34.9%
--
50.36%
--
Test time
40.31%
$1,567,607.76
40.1%
$76,509.24
47.45%
$19,979.03
Test result inspection
33.04%
$61,532.80
21.1%
$104,880.00
32.53%
$2,337,926.40
Escaped defects
0.20%
$11,970.56
8.7%
$75,326.40
13.40%
$310,159.42
Total cost balance
$1,617,170.00
$106,063.24
$2,047,746.01
TABLE IV. DISTRIBUTION OF ESCAPED DEFECTS OVER NUMBER OF
ESCAPED BRANCHES FOR WINDOWS AND DYNAMICS.
Number of escaped branch levels
1
2
3
Windows
71%
21%
8%
Dynamics
97%
3%
0%

phase (see Section VII) in which we observe the current testing
process to estimates risk factors before applying any test
selection. Once THEO starts skipping test executions, the ratio
of removed executions converges to an almost stable state. The
plot shows fluctuations in the relative number of reduced test
executions, e.g. a sharp drop from nearly 55% to 40% midway
through the plotted timespan. The reason for these fluctuations
in test execution reduction rates are natural fluctuations in code
quality. The quality of submitted code changes is not constant; a
drop in overall code quality causes more test failures and directly
influences risk factors. Changes in risk factors can cause
previously skipped tests to be re-enabled. Reduction rates for
Office and Dynamics look similar. Due to space reason, we
abstain from showing these plots.
X. SECONDARY IMPROVEMENTS
The measurable improvements discussed in Section IX are
likely to have further, secondary consequences. Although, these
improvements are not directly measurable, they are an important
part of the improvement of the development processes.
A. Code Velocity
Reducing the number of executions and consequently the
overall required test time may have positive effects on code
velocity. Executing fewer tests implies that code changes have
to spend less time in verification and changes can be integrated
faster, freeing up engineering time that may have been spent
evaluating false positives. However, the immediate impact on
code velocity is hard to measure. Code velocity is determined by
many different aspects, including human behavior, which is not
possible to simulate. Thus, it is hard to predict how THEO would
affect actual development speed. It might well be that the
bottleneck of current development processes is not only testing.
Nevertheless, the number of executed tests represents a lower
bound to code velocity, as the consecutive time necessary to pass
all required tests is the minimal time required to integrate code
changes. By lowering the number of executed tests, THEO
lowers the lower bound for code velocity.
B. Developer Satisfaction
A very important but also hard to measure factor of every
development process is developer satisfaction. Reducing the
time for testing and the number of required test inspections is
likely to increase developer satisfaction. It should help to
increase the confidence in test results and decisions based on
testing. Increasing the speed of the development process will
itself also impact the developer experience. The ability to merge,
integrate, and share code changes faster can reduce the number
of merge conflicts and is likely to support collaboration.
XI. THREATS TO VALIDITY
Like most empirical studies, the presented study has threats
to validity. We identified three main groups of threats.
A. Generalizability
We investigated test executions specific to three Microsoft
products and their development processes. Even though some
terminology might be unique to Microsoft, the execution of tests
during software development and the impact of test execution
time on development speed are generalizable.
The estimated costs presented in this paper are specific to
Microsoft. The cost model considers several independent but
development process specific aspects and cost factors are likely
to vary across releases and projects (e.g. cost factors for
machines and engineers). Replicating this study for different
projects or releases requires detailed reviews and adjustments.
B. Construct Validity
The approach to estimate the impact of escaped defects and
to identify those test cases that would eventually re-capture these
defects is a heuristic and associated cost values must be
considered approximations. However, our data was derived
through investigations, discussions and fine-tuning with the
corresponding product teams. We consider the approximations
of these heuristics as fair and realistic. Cost factors used in this
study are based on average Microsoft development figures and
numbers (e.g. average salary and work hours per year). These
numbers vary and might not consider all possible aspects.
Execution context information might be particular important
for system and integration tests while other tests, e.g. unit tests,
might be more independent from them. However, the presented
concept is generic. Reducing the number of execution contexts
to one or further increasing the number of execution contexts
does not threat the validity of the overall approach.
C. Internal Threats to Validity
The simulator may contain defects. To conquer this threat,
we implemented multiple test cases and performed manual
inspections. Through validating with product teams, we are
confident that the data collected and analyzed reflects the
development processes accurately.
XII. RELATED WORK
In this section, we give an overview of related studies.
A. Test Selection, Prioritization, and Reduction
“Measuring the absolute effectiveness of testing is generally
not possible, but comparison between effectiveness of tests is”
[7]. Based on this concept, Basili and Selby [8] presented one of
the first studies comparing the effectiveness and cost of testing
Fig. 3. Relative test execution reduction rate for Windows over time. The area
shows the relative number of tests skipped by THEO.
0%0%
10%
20%20%20%
30%
40%40%40%
50%
60%
Development days (Windows)
Relative test time improvement

strategies showing that changing or choosing different test
strategies might impact test effectiveness.
Many of the following research studies focused on the area
of test case selection, prioritization, and reduction. In 2007, Yoo
and Harman [9] presented a comprehensive survey of research
studies showing that many techniques assume access either to
code, execution traces or some sort of model to derive selection
criteria (i.e., based on code coverage) [9, 10, 11]. In contrast,
the strategy discussed in this paper, does not make any such
assumption. We treat tests entirely as black boxes. Lately,
Anderson et al. [12] used software repositories to measure
historic test performances. This study was carried out in parallel
to this work and does not provide any dynamic test selection
solution, but rather assess the effectiveness of tests.
Schroeder and Korel [13] used input-output analysis to
construct test input to reduce the number of required black box
test executions without lowering test effectiveness. Contrary to
their study, THEO measures test effectiveness based on a cost
model and uses the context and frequency of executions to drive
efficiency improvement. Altering inputs for tests would not be
actionable at Microsoft. Goradia [14] used the fault exposing
potential of a test as the selection criteria, whereby he relies on
mutation analysis, i.e., modification of the original program to
determine the probabilities of a test to reveal a fault. More
generally, a number of empirical case studies and extensive
literature reviews compared and identify test tools most likely to
yield optimal test effectiveness [14, 15, 16, 17, 10, 18].
With respect to test executions costs, Vallespir and Herbert
[19] used machine and inspection costs for individual unit tests
to conclude that the number found defects is low compared to
the relatively high cost of unit tests. However, the cost
calculation presented in [19] are based on three samples and are
rather vague and seem not applicable for development processes
nor for system and integration tests at Microsoft.
B. Cost Aware Improvement Strategies
Using cost-aware test improvement strategies is not unique.
Yoo and Harman [20] and Alspaugh et al. [21] used time-aware
techniques selecting a subset of test cases that can be executed
in a given time budget. Do et al. [22] assessed the effect of time
constraints on the cost and benefits of prioritization techniques.
Additionally, empirical studies exist that consider the impact of
testing strategies on the cost-effectiveness in the wider context
of the overall software lifecycle [10, 23]. Lately, Li and Boehm
[24] proposed a value-based test prioritization strategy ranking
tests by their risk exposure coverage and the relative cost of tests.
Gustafson [25] applied cost factors to software flow graphs to
define areas that require additional testing. The difference
between these studies and THEO is that THEO is solely based
on a dynamic, empirically derived cost model, which directly
impacts the strategy decisions. Our model uses not only the cost
and risk of executing or skipping a test but relates both values to
each other. Empirical evaluations and application of testing
techniques at industrial settings [26, 27, 28] remain limited [9].
All those studies focus on regression test suites. To the best
of our knowledge, this study is the first that evaluates system and
integration test effectiveness based on execution contexts such
as branching structures and architectures.
C. Merge Conflicts and Awareness
Even though version control systems allow parallel
development activities and avoid conflicts, several studies
showed that merge conflicts occur frequently, whereby most of
the studies focused on facilitating collaboration effectiveness.
One of the first studies that showed how frequent merge conflicts
occur has been performed by Zimmermann [29]. He showed that
between 22% and 46% of integrations could not be
automatically resolved and resulted in conflicts. In a recent
study, Brun et al. [30] showed that merge conflicts are frequent
and persistent. In summary, they showed that 33% of merges that
were reported to contain no textual conflicts by the version
control system, in fact contained higher-order conflicts, which
manifested themselves as a build or a test failure. Also Perry et
al. showed significant correlations between the degree of parallel
work and the number of quality problems [31]. The effect of
merge conflicts on quality has also been studied by Bird and
Zimmermann [2]. Those studies aimed at quantifying the degree
of merge conflicts, or at establishing collaborative awareness for
merge conflicts, we focus on quantifying and improving the
effectiveness and efficiency of tests.
XIII. CONCLUSION
We presented a novel cost based test selection strategy,
THEO, which skips test executions where the expected cost of
running the test exceeds the expected cost of not running it. Our
strategy is dynamic and self-adaptive and only uses historical
test data, which is already collected by most test frameworks.
THEO was verified through simulating its impact on the
Microsoft Windows, Office, and Dynamics developments.
THEO would have reduced the number of test executions by up
to 50% cutting down test time by up to 47%. At the same time,
product quality was not sacrificed as the process ensures that all
tests are ran at least once on all code changes. Removing tests
would result in between 0.2% and 13% of defects being caught
later in the development process, thus increasing the cost of
fixing those defects. Nevertheless simulation shows that THEO
produced an overall cost reduction of up to $2 million per
development year, per product. Through reducing the overall
test time, THEO would also have other impacts on the product
development process, such as increasing code velocity and
productivity. These improvements are hard to quantify but are
likely to increase the cost savings estimated in this paper.
The technique and results described in this paper have
convinced an increasing number of product teams, within
Microsoft, to provide dedicate resources to explore ways to
integrate THEO into their actual live production test
environments.
ACKNOWLEDGMENT
We thank the Windows, Office, and Dynamics development
teams for their help and feedback. This work is based on data
extracted from varies development repositories by the
CodeMine process managed by Microsoft’s Tools for Software
Engineers group. Our special thanks go to Jason Means, Blerim
Kuliqi, Alex Gorischek, Alain Zariffa, Wayne Roseberry,
Adrian Marius Marin, Craig Campbell, and Alan Back.

REFERENCES
[1]
M. Vakilian, R. Sauciuc, J. D. Morgenthaler and V. Mirrokni,
"Automated Decomposition of Build Targets," 2014.
[2]
C. Bird and T. Zimmermann, "Assessing the Value of Branches
with What-if Analysis," in Proceedings of the ACM SIGSOFT
20th International Symposium on the Foundations of Software
Engineering, Cary, North Carolina, 2012.
[3]
B. Murphy, J. Czerwonka and L. Williams, "Branching
Taxonomy," Microsoft Research, Cambridge, 2014.
[4]
D. Sprott, "Enterprise Resource Planning: Componentizing the
Enterprise Application Packages," Commun. ACM, vol. 43, pp.
63--69, apr 2000.
[5]
K. Herzig and N. Nagappan, "The Impact of Test Ownership and
Team Structure on the Reliability and Effectiveness of Quality
Test Runs," in Acceppted for 8th International Symposium on
Empirical Software Engineering and Measurement (ESEM),
Torino, 2014.
[6]
F. Shull, V. Basili, B. Boehm, A. Brown, P. Costa, M. Lindvall,
D. Port, I. Rus, R. Tesoriero and M. Zelkowitz, "What we have
learned about fighting defects," in Software Metrics, 2002.
Proceedings. Eighth IEEE Symposium on, 2002.
[7]
E. Weyuker, "Can we measure software testing effectiveness?,"
in Software Metrics Symposium, 1993. Proceedings., First
International, 1993.
[8]
V. R. Basili and R. W. Selby, "Comparing the Effectiveness of
Software Testing Strategies," IEEE Trans. Softw. Eng., vol. 13,
no. 12, pp. 1278--1296, December 1987.
[9]
S. Yoo and M. Harman , "Regression testing minimization,
selection and prioritization: a survey," Softw. Test. Verif. Reliab.,
vol. 22, no. 2, pp. 67--120, March 2012.
[10]
S. Elbaum, A. G. Malishevsky and G. Rothermel, "Test Case
Prioritization: A Family of Empirical Studies," IEEE Trans.
Softw. Eng., vol. 28, no. 2, pp. 159--182, February 2002.
[11]
J. A. Jones and M. J. Harrold, "Test-Suite Reduction and
Prioritization for Modified Condition/Decision Coverage," in
Proceedings of the IEEE International Conference on Software
Maintenance (ICSM'01), 2001.
[12]
J. Anderson, S. Salem and H. Do, "Improving the Effectiveness
of Test Suite Through Mining Historical Data," in Proceedings
of the 11th Working Conference on Mining Software
Repositories, 2014.
[13]
P. J. Schroeder and B. Korel, "Black-box test reduction using
input-output analysis," in Proceedings of the 2000 ACM
SIGSOFT international symposium on Software testing and
analysis, Portland, Oregon, USA, 2000.
[14]
T. Goradia, "Dynamic impact analysis: a cost-effective
technique to enforce error-propagation," in Proceedings of the
1993 ACM SIGSOFT international symposium on Software
testing and analysis, Cambridge, Massachusetts, USA, 1993.
[15]
Y. Zhang, X. Zhao, X. Zhang and T. Zhang, "Test effectiveness
index: Integrating product metrics with process metrics," in
Cyber Technology in Automation, Control, and Intelligent
Systems (CYBER), 2012 IEEE International Conference on,
2012.
[16]
G. Whyte and D. L. Mulder, "Mitigating the Impact of Software
Test Constraints on Software Testing Effectiveness.," Electronic
Journal of Information Systems Evaluation, vol. 14, pp. 254 -
270, 2011.
[17]
G. Rothermel, R. Untch, C. Chu and M. Harrold, "Test case
prioritization: an empirical study," in Software Maintenance,
1999. (ICSM '99) Proceedings. IEEE International Conference
on, 1999.
[18]
P. Braione, G. Denaro, A. Mattavelli, M. Vivanti and A.
Muhammad, "An industrial case study of the effectiveness of
test generators," in Automation of Software Test (AST), 2012 7th
International Workshop on, 2012.
[19]
D. Vallespir and J. Herbert, "Effectiveness and Cost of
Verification Techniques: Preliminary Conclusions on Five
Techniques," in Computer Science (ENC), 2009 Mexican
International Conference on, 2009.
[20]
S. Yoo and M. Harman, "Pareto efficient multi-objective test
case selection," in Proceedings of the 2007 international
symposium on Software testing and analysis, London, United
Kingdom, 2007.
[21]
S. Alspaugh, K. R. Walcott, M. Belanich, G. M. Kapfhammer
and M. L. Soffa, "Efficient time-aware prioritization with
knapsack solvers," in Proceedings of the 1st ACM international
workshop on Empirical assessment of software engineering
languages and technologies: held in conjunction with the 22nd
IEEE/ACM International Conference on Automated Software
Engineering (ASE) 2007, Atlanta, Georgia, 2007.
[22]
H. Do, S. Mirarab, L. Tahvildari and G. Rothermel, "An
empirical study of the effect of time constraints on the cost-
benefits of regression testing," in Proceedings of the 16th ACM
SIGSOFT International Symposium on Foundations of software
engineering, Atlanta, Georgia, 2008.
[23]
G. Rothermel, S. Elbaum, A. G. Malishevsky, P. Kallakuri and
X. Qiu, "On test suite composition and cost-effective regression
testing," ACM Trans. Softw. Eng. Methodol., vol. 13, no. 3, pp.
277--331, july 2004.
[24]
Q. Li and B. Boehm, "Improving scenario testing process by
adding value-based prioritization: an industrial case study," in
Proceedings of the 2013 International Conference on Software
and System Process, San Francisco, CA, USA, 2013.
[25]
D. A. Gustafson, "Guidance for Test Selection Based on the Cost
of Errors," in Proceedings of the July 9-12, 1984, National
Computer Conference and Exposition, 1984.
[26]
M. Sherriff, M. Lake and L. Williams, "Prioritization of
Regression Tests using Singular Value Decomposition with
Empirical Change Records," in Proceedings of the The 18th
IEEE International Symposium on Software Reliability, 2007.
[27]
M. Skoglund and P. Runeson, "A case study of the class firewall
regression test selection technique on a large scale distributed
software system," in Empirical Software Engineering, 2005.
2005 International Symposium on, 2005.
[28]
N. b. Ali, K. Petersen and M. Mäntylä, "Testing highly complex
system of systems: an industrial case study," in Proceedings of
the ACM-IEEE international symposium on Empirical software
engineering and measurement, Lund, Sweden, 2012.

[29]
T. Zimmermann, "Mining Workspace Updates in CVS," in
Proceedings of the Fourth International Workshop on Mining
Software Repositories, Minneapolis, MN, USA, 2007.
[30]
Y. Brun, R. Holmes, M. D. Ernst and D. Notkin, "Proactive
detection of collaboration conflicts," in Proceedings of the 19th
ACM SIGSOFT symposium and the 13th European conference
on Foundations of software engineering, Szeged, Hungary,
2011.
[31]
D. E. Perry, H. P. Siy and L. G. Votta, "Parallel changes in large-
scale software development: an observational case study," ACM
Trans. Softw. Eng. Methodol., vol. 10, no. 3, pp. 308--337, July
2001.
